The Week Onchain (Week 51, 2021)

Bitcoin investors are increasingly underwater, with 1-in-4 coins held at an unrealized loss. We analyse this top heavy market and what it means for sentiment moving forward.

The Week Onchain (Week 51, 2021)

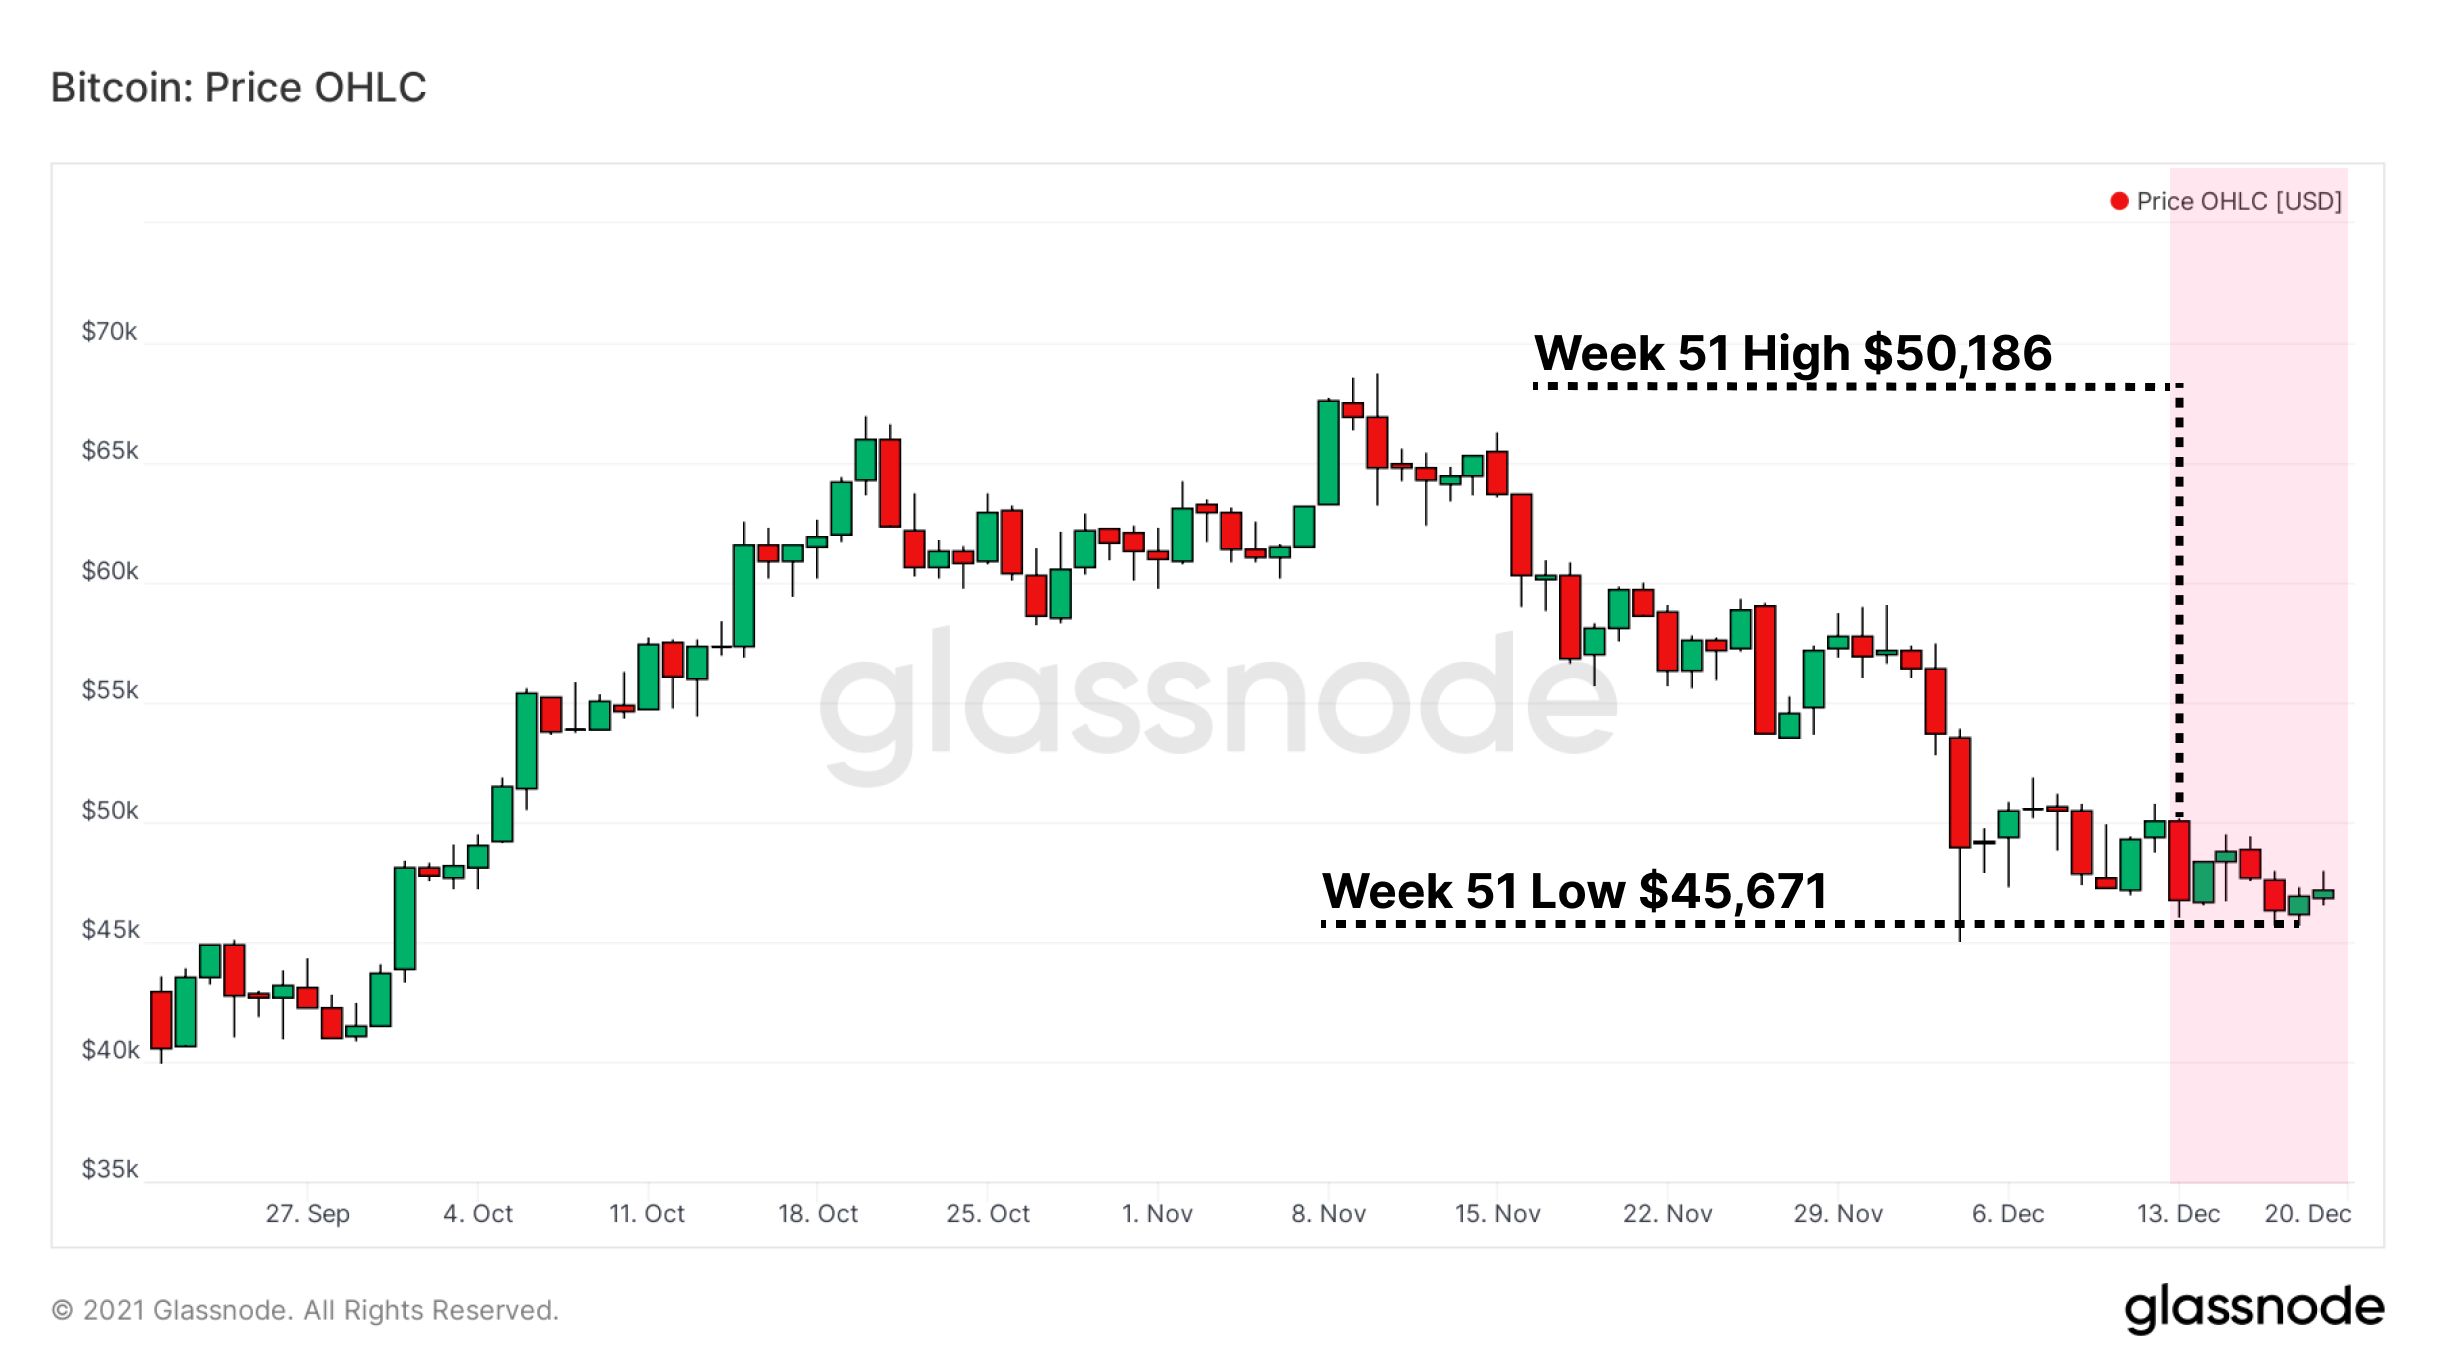
Bitcoin endured a second consecutive week of price ranging, following the sharp drawdown in early December. After opening at $50,093, price saw a high of $50,186 and a low of $45,671, a compressed range that spanned only $4,515 ,with BTC closing out the week down -6.1%.

Many eyes were on the Federal Reserve's comments following the Federal Open Market Committee meeting on Wednesday, and broader markets generally traded in consolidation throughout the week. In this edition, we will explore how Bitcoin investors are currently positioning themselves in the following areas:

  • An observable slow down of both loss realization and profit taking,
  • An assessment of which supply cohorts are transacting on-chain right now,
  • A continuing trend of steadfast accumulation behavior by stronger hands.
Live Chart

Week On-chain Dashboard

The Week On-chain Newsletter now has a live dashboard for all featured charts here. We have also started production for Week On-chain video analysis to provide a deeper dive into the thesis and logic behind each weeks analysis. Visit and subscribe to our YouTube channel, and visit our Video Portal to see our video content.


Spent Coins Get Younger

A common behavior when prices make new highs is for profitable coins to be spent into market strength. Holders from lower prices want to pay themselves for the effort of waiting and taking on risk, and it results in profit taking and elevated activity from older coin cohorts.

The Spent Volume Age Bands, filtered below to display spent coins older than 6-months, illustrates what older spending volume can look like. In the late 2020 bull run, >6m coin spending comprised 7% of on-chain volume. Since then, successive peaks of spending from this group have declined, topping at just 3.5% of daily volume at the recent highs.

Live Chart

This dynamic is also visible in the Realized Cap HODL Waves, which divvy up the circulating supply by their respective weighting in the Realized Cap, helping to emphasize recent spending.

A key observation in the Realized Cap HODL Waves is the compression of the 3m-6m wave, which are owners of coins bought between mid June and September— essentially the year's lows. A squeezing of the 3m-6m band while the senior 6m-1y band bells outward shows coin maturation- as BTC lies dormant and accrues age, it graduates into the older cohort above.

In lockstep with the growing of the older 6m-1y group, is a rise in the youngest bands in October and November at the market all-time high. This behavior shows older coins being spent, which resets their lifespans to zero. Based on the squeeze of the 3m-6m band (and the 1m-3m band to a lesser degree), much of the recent spending emanated from these medium-term holders.

The take home message here is that much of the coin spending underway appears to be from coins purchased in the last 3m-6m, rather than longer-term holders.

Live Chart

Among the investors anticipated to take action at the recent highs were Long-Term Holders, who are consistent distributors in price discovery. The cyclical nature of Long-Term Holders is as follows:

  • Steady accumulation in bearish market phases, eventually reaching a level of 'Peak HODL'.
  • Spending of profitable coins at the all-time high, realizing profits into market strength.
  • By the time price peaks and rolls over, Long-Term Holders have begun net accumulating again.

Distribution events, visualized below as the 7-day change in Long-Term Holder Supply, typically result in peaks of 2% or more supply moved to new buyers. However the recent all-time highs and subsequent pullback have seen a peak spending rate of only 0.6%, just 30% of the expected amount from Long-Term Holders. These low time preference investors seem reticent to spend at current prices, which may speak to a sophistication in their decision making.

Live Workbench Chart

Short-Term Coins Play Musical Chairs

New investors are the first group tested by price weakness. In the days following the November all-time high and beyond the liquidation flush of December 4, loss realization on-chain of $50-$100M per day was common. For loss realization to occur after an all-time high, those spenders must be top buyers.

Net Realized Profit/Loss visualizes the daily outcome of on-chain spending in USD terms. Observe:

  • Consistent profit taking around the all-time highs, as coins from lower prices are spent to new buyers.
  • Steep loss realization in the days afterward as price pulled back over -30%. Losses realized after all-time highs indicates coins purchased at the top.
  • Relatively flat activity in the past two weeks, suggesting investor interest is reaching an exhaustion point at current prices.
Live Chart

With the understanding that older coin spending is declining, and Long-Term Holders mostly on the sidelines, we can intuit that recent coin activity is largely contained within the Short-Term Holder cohort. A look at the standing Profit/Loss ratio of Short-Term Holders can show the health of this group's supply and illustrate periods of overheated price action.

  • High values over 1000 (red) indicate moments of extreme profitability for new investors. These moments are brief and often precede local reversals.
  • Values between 100-1000 (yellow) mean newer buyers are in healthy profit.
  • Values below 1 (blue) indicate Short-Term Holders in loss.
  • Low values near or below 0.1 (green) are moments of heightened vulnerability for new buyers, and frequently mark local bottoms where value is established.

Short-Term Holder PnL spiked dramatically in late October as price ripped to all-time highs. Buyers of coin from August and September suddenly found themselves up 60%+, and the market had to pull back to accommodate profit taking.

Presently, Short-Term Holders finds themselves in aggregate loss, though the pace of decline has slowed along with price. While these coins continue to churn among different hands, their lifespans stay young and they remain members of Short-Term Holder Supply.

Live Workbench Chart

The rotation of coins among newer owners can also be seen in the rate of change of Short-Term Holder Realized Price. As owners of the youngest supply, their cost basis is more responsive to price than their Long-Term Holder cousins. Interpretation of the costs basis for each cohort is nuanced and different:

  • Short-Term Holder Realized Price rises when coins are spent from lower prices, causing them to be re-priced higher and thus raising the aggregate cost basis of the group.
  • Short Term Holder Realized Price declines when price falls. Coins from higher prices are re-priced into new hands at lower costs, pulling down their cost basis.
  • Long-Term Holder Realized Price rises when coins mature from increasingly higher prices as Bitcoin appreciates. The delay in adoption of this group makes their cost basis less responsive to price, and more beholden to maturation behavior by hodlers.
  • Long-Term Holder Realized Price declines rarely, and typically only in prolonged bear markets. Rather than fall, it tends to go sideways as coins mature during long ranging periods for price.

Note the recent increase in Short-Term Holder Realized Price at the October and November highs, showing the re-pricing of coins at higher prices as new investors bought the literal top.

Live Workbench Chart

The ultimate perspective of coin rotation within the Short-Term Holder group is seen in the Percent of Entities in Profit. A remarkable observation on this chart is the arcing trend from late July to present day:

  • In late July, price was $32.3k and 76% of all entities on-chain were in profit.
  • When new highs were created in October and November, 100% of entities were in profit— an expected outcome of price discovery.
  • Now in late December, price is $47.6k (over $15k higher) and there are again only 76% of entities in profit.

For price to be over $15k higher (+47%) than summer while the same amount of investors are in profit, knowing that older spending is muted, a great shuffling of coins had to take place at the top within the Short-Term Holder group. That means they were coins mostly purchased since July, and signals that the current holder makeup is top heavy— many coins were bought at the top and now sit underwater.

Live Chart

As a cherry on top of the discussion about top heavy supply, we look at the Unrealized Price Distribution, which shows all circulating BTC by its last transacted price. A quick glance reveals that 24.6% of all supply is sitting above the current price around $47,000, meaning 1 in 4 BTC is currently underwater.

Live Chart

Despite Weakness, Strong Hands Continue Stacking

A behavior that has left its stamp on the 2021 Bitcoin market is the steadfast accumulation by investors with a limited history of spending. Illiquid Supply is the amount of BTC held by on-chain entities with >=75% inflows in their ledger history.

The supply in possession of these Illiquid entities sold off in May along with much of the market. Since that time, they have maintained a consistent pressure of accumulation, and are now taking possession of coins at a rate of 3.4x daily coin issuance.

Put another way, strong handed HODLers are absorbing supply at more than triple the rate of new coins being mined each day.

Live Workbench Chart

Strong hands are not the only investors pulling coins away from potential buyers. After a large impulse of deposits to exchanges in May (over $300M on a 14-day basis), Bitcoin has been steadily pulled offline into cold storage in the months following the summer lows.

The chart below shows the net transfer volume to/from all exchanges, which is the difference between all deposits and all withdrawals in USD terms. The initial all-time high break in late October saw around $100M of inflows, but the weeks following have been dominated by consistent exchange outflow volume, seeing average values of -$150M to -$175M on a 14-day basis.

Price weakness has so far not engendered a rush to the exits, as investors are instead creating friction between their ownership and the ability to sell their BTC.

Live Chart

One group that doesn't have a reputation for being strong handed is the miners, who have been a consistent source of spending pressure on the Bitcoin network since inception. Well, perhaps their reputation is in need of an overhaul!

In the past two years, miner behavior has undergone a transformation. Newer, more powerful chips have enhanced operational efficiency, and the expansion of miners into North America has given many of them access to operating capital by exercising cheap debt and corporate equity. The typical miner in 2021 is more resilient than past generations.

What once was a reliable outflow of spending from miner wallets has shifted since 2019, and miners are now depositing more minted supply into their treasuries than before. The chart below shows the 90-day sum of Miner Netflow Volume (in USD) as a percentage of Market Cap, and the multi-year rise is evident.

If miners evolve into being HODLers, a group who are naturally incentivized to spend, then acquiring new Bitcoin into the future could become exceedingly difficult.

Live Workbench Chart

In case you missed it, the past week saw circulating supply pass the 90% mark of its ultimate goal, with circulating supply passing 18.9M BTC. In just under thirteen years, 9/10ths of the total BTC supply has now been issued to miners. Bitcoin's deterministic issuance schedule has much farther to go however, with the remaining 10% of supply set to be minted over the next 119 years or so, ending somewhere near the year 2140.

With so many holder types stacking BTC for the long term, future opportunities to acquire the world's first absolutely scarce digital asset are increasingly limited.

Live Workbench Chart

Product Updates

  • Glassnode System Status now available.
  • Added FTX to Bitcoin exchange metrics.
  • New navigation tool using cmd+k shortcut in Studio.

Disclaimer: This report does not provide any investment advice. All data is provided for information purposes only. No investment decision shall be based on the information provided here and you are solely responsible for your own investment decisions.