A New Experiment in Cumulative Destruction
Introducing the Value of Coin-days Destroyed Multiple, a metric that uses investor spending patterns to identify overheated and undervalued markets.


Introducing the Value Days Destroyed Multiple
For Bitcoin, tracking spending behavior on-chain is a powerful tool in assessing market strength. Within the macro trend shifts of saving and spending lie clues to investor sentiments at scale, and from these we can derive reliable methods for identifying overheated markets.
In this article, we will explore the viability of creating a top signal using trend comparisons of on-chain spending volume.
A live version of the Value Days Destroyed Multiple is available on Workbench
Fundamentals of On-Chain Spending
Why Does Spending Behavior Matter?
At the core layer, market cycles are decided by supply and demand. When prices rise, holders are enticed to relinquish their stakes to new buyers. If demand overpowers available supply, price is capable of parabolic moves, which further unlock supply for sale. The demand of new buyers eventually diminishes, freed up supply floods the market, and prices fall.
This pattern repeats cycle after cycle across every asset class. For the first time in finance, Bitcoin and on-chain analysis let us measure the underlying supply and demand behaviors of market participants beneath the outcomes in price.
Evaluating Spending Activity
To measure spending volume, we look to Coin Days Destroyed (CDD). First proposed in 2011, CDD represents the sum of meaningful settlement activity occurring on-chain, weighted for the time duration of the original stake.
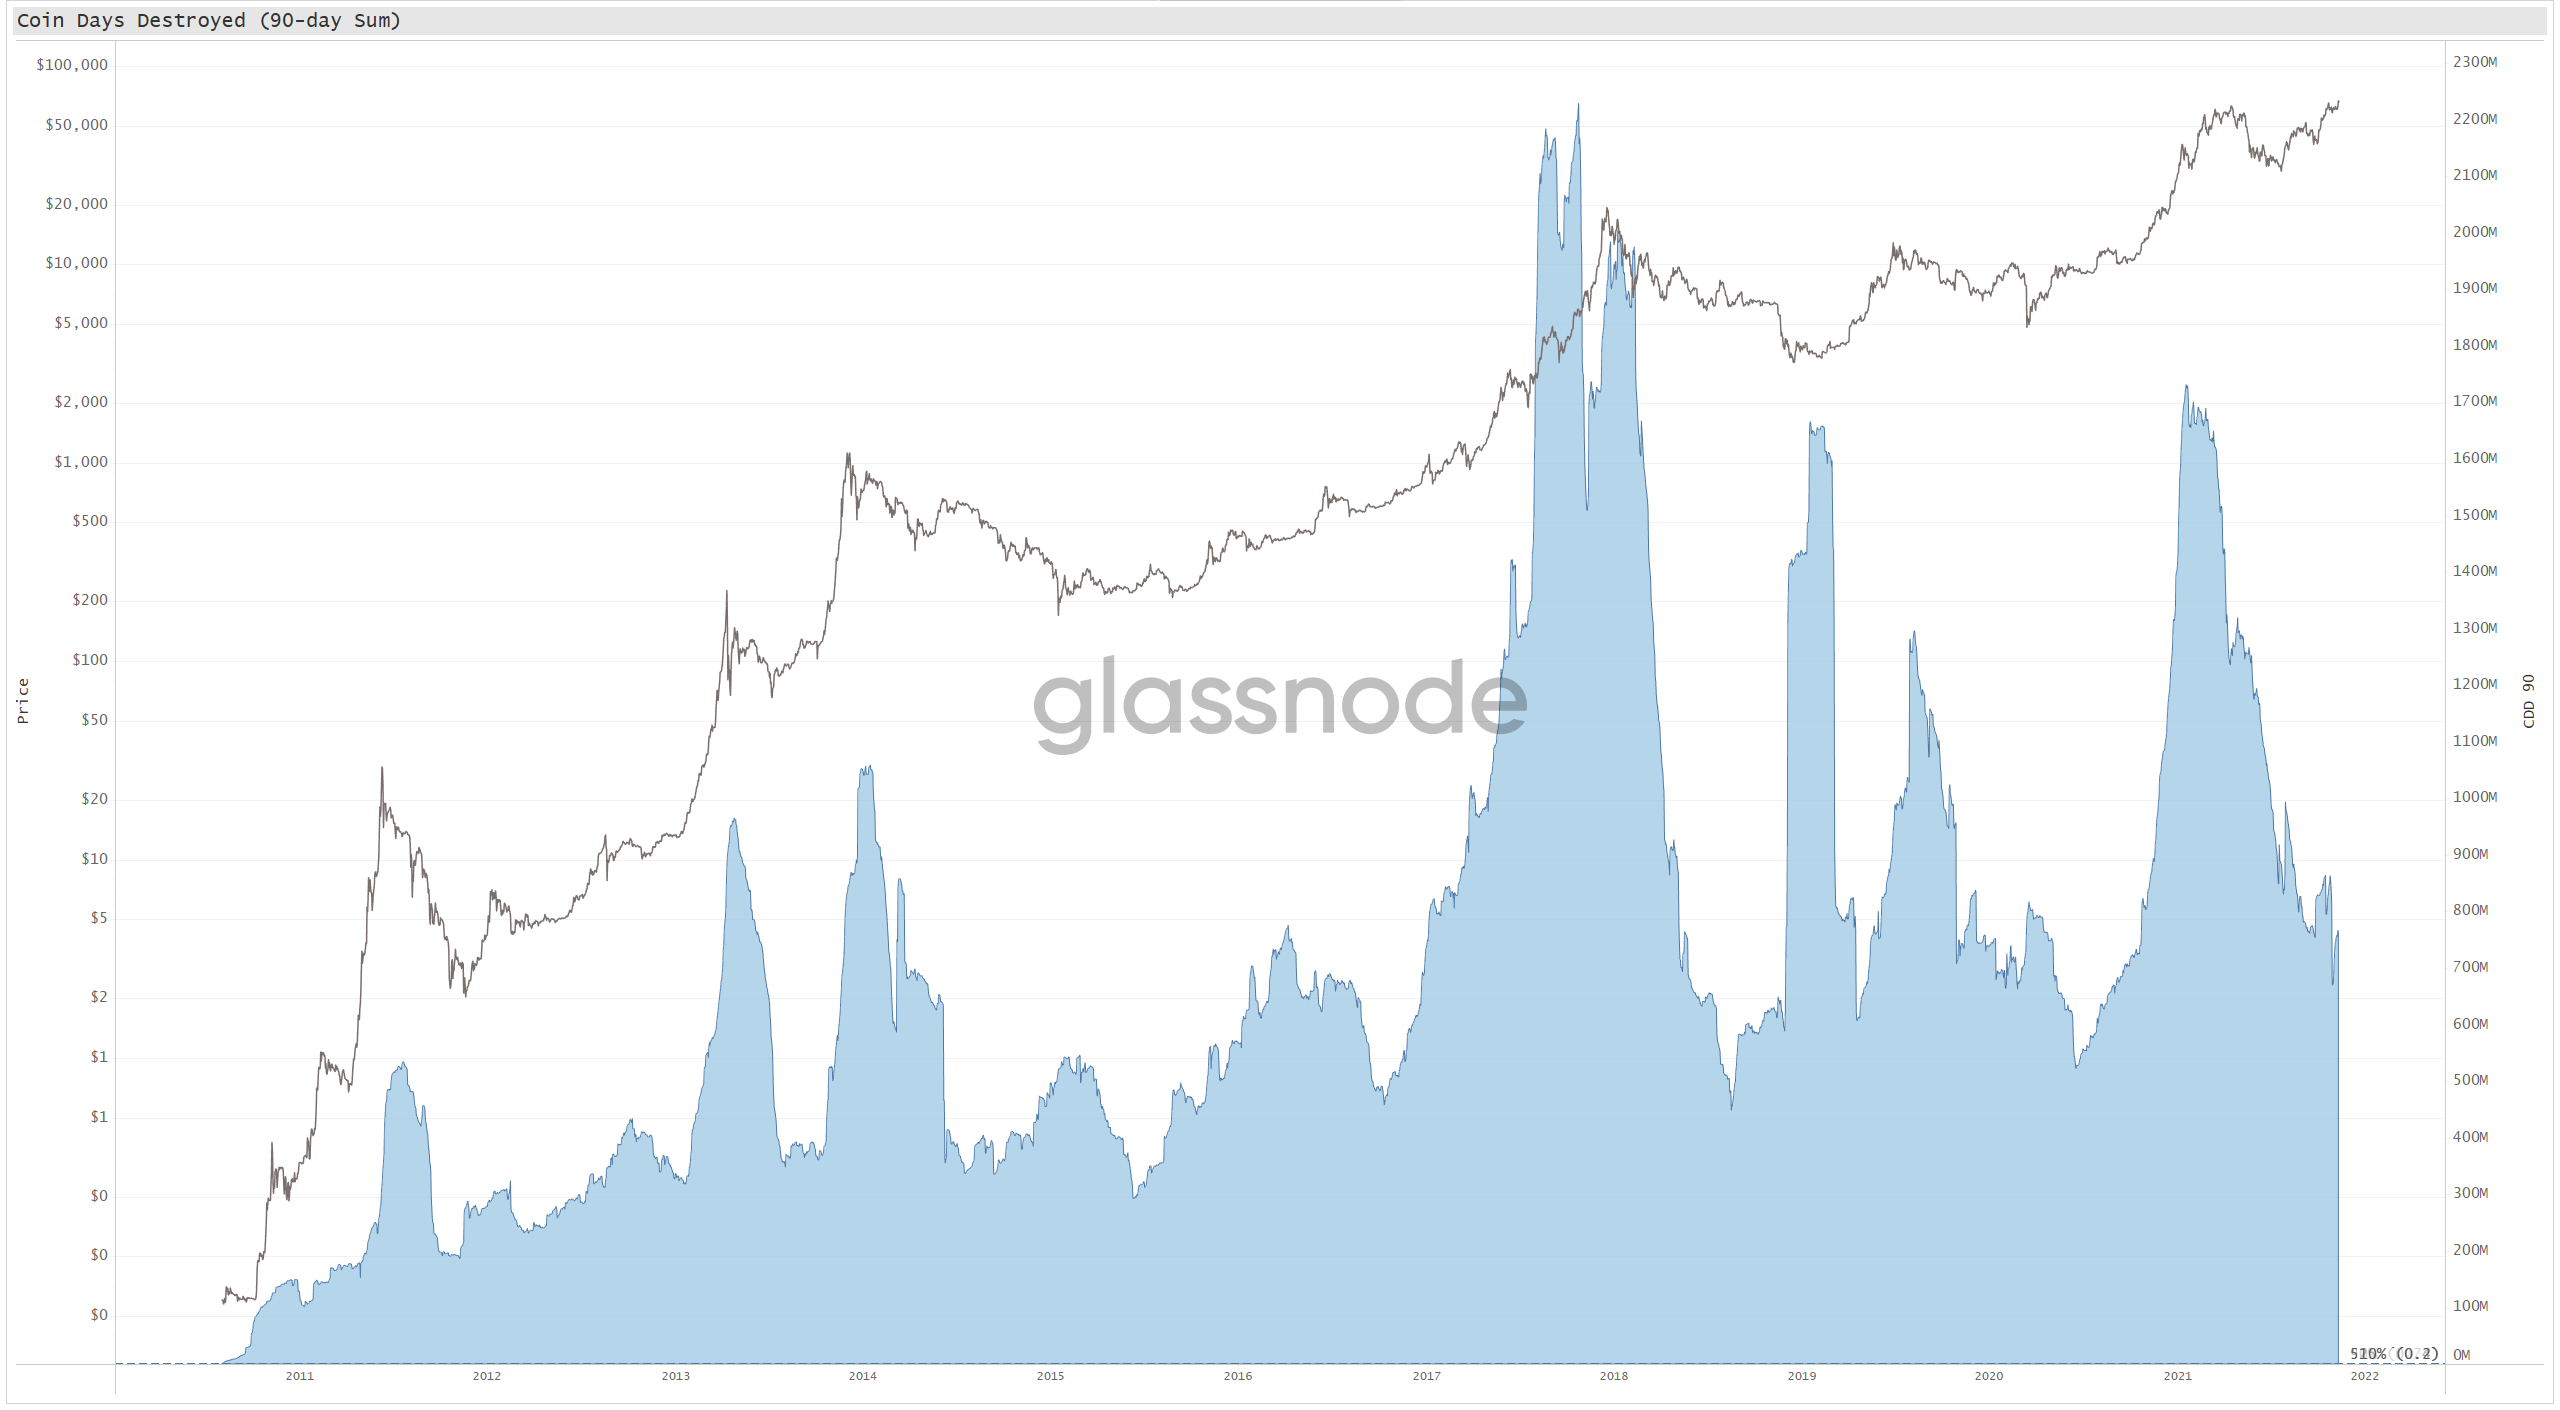
At a high level, Coin Days Destroyed is a proxy for spending velocity. While a valuable measure, CDD carries its own nuance that is important to mention:
- The potential range of spent coin ages is increasing by a value of 1 every day for every coin in circulation, causing a long-term upward drift in maximum CDD values.
- Rising price means individual users can spend less coins to realize profits, (though network adoption is increasing user counts), thus applying a deflationary pressure on the lower range of CDD and expanding the range over time.
The exponential rise in Bitcoin’s price and the perpetual growth of maximum lifespan create behavioral variances in any metric based purely on Coin Days Destroyed. However, we can still use it for signal with some refinement.
Value Days Destroyed Multiple
Accounting for Price
In order to adjust spending activity for the variance of price over time, we multiply CDD by a factor of price. This forms a metric we call Value Days Destroyed (VDD), a synonym of Value of Coin Days Destroyed, initially presented by Hans Hauge. This will align spent coin volumes with their relative valuations and form the basis of our activity measurement.

Devising an Oscillator
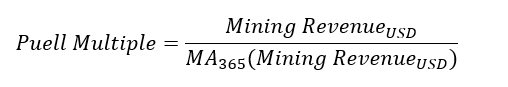
One of the more reliable cyclical on-chain indicators is the Puell Multiple, which compares the near-term and long-term USD value of miner revenue. It excels at using the fundamentals of miner profitability to assess Bitcoin’s market cycles.
By creating a ratio from the daily sum of revenue and the yearly (365-day) average, a confident oscillator emerges showing deviations from recent trends.
It is this sound methodology that we can apply to Value Days Destroyed to derive a complimentary measure of market strength through the lens of spent coin volume.
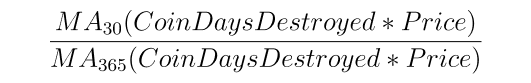
Where the Puell Multiple compares the single day sum of revenue to the previous year, we use a 30-day average of VDD as our near-term metric. The formula is:
Smoothing for Supply Change
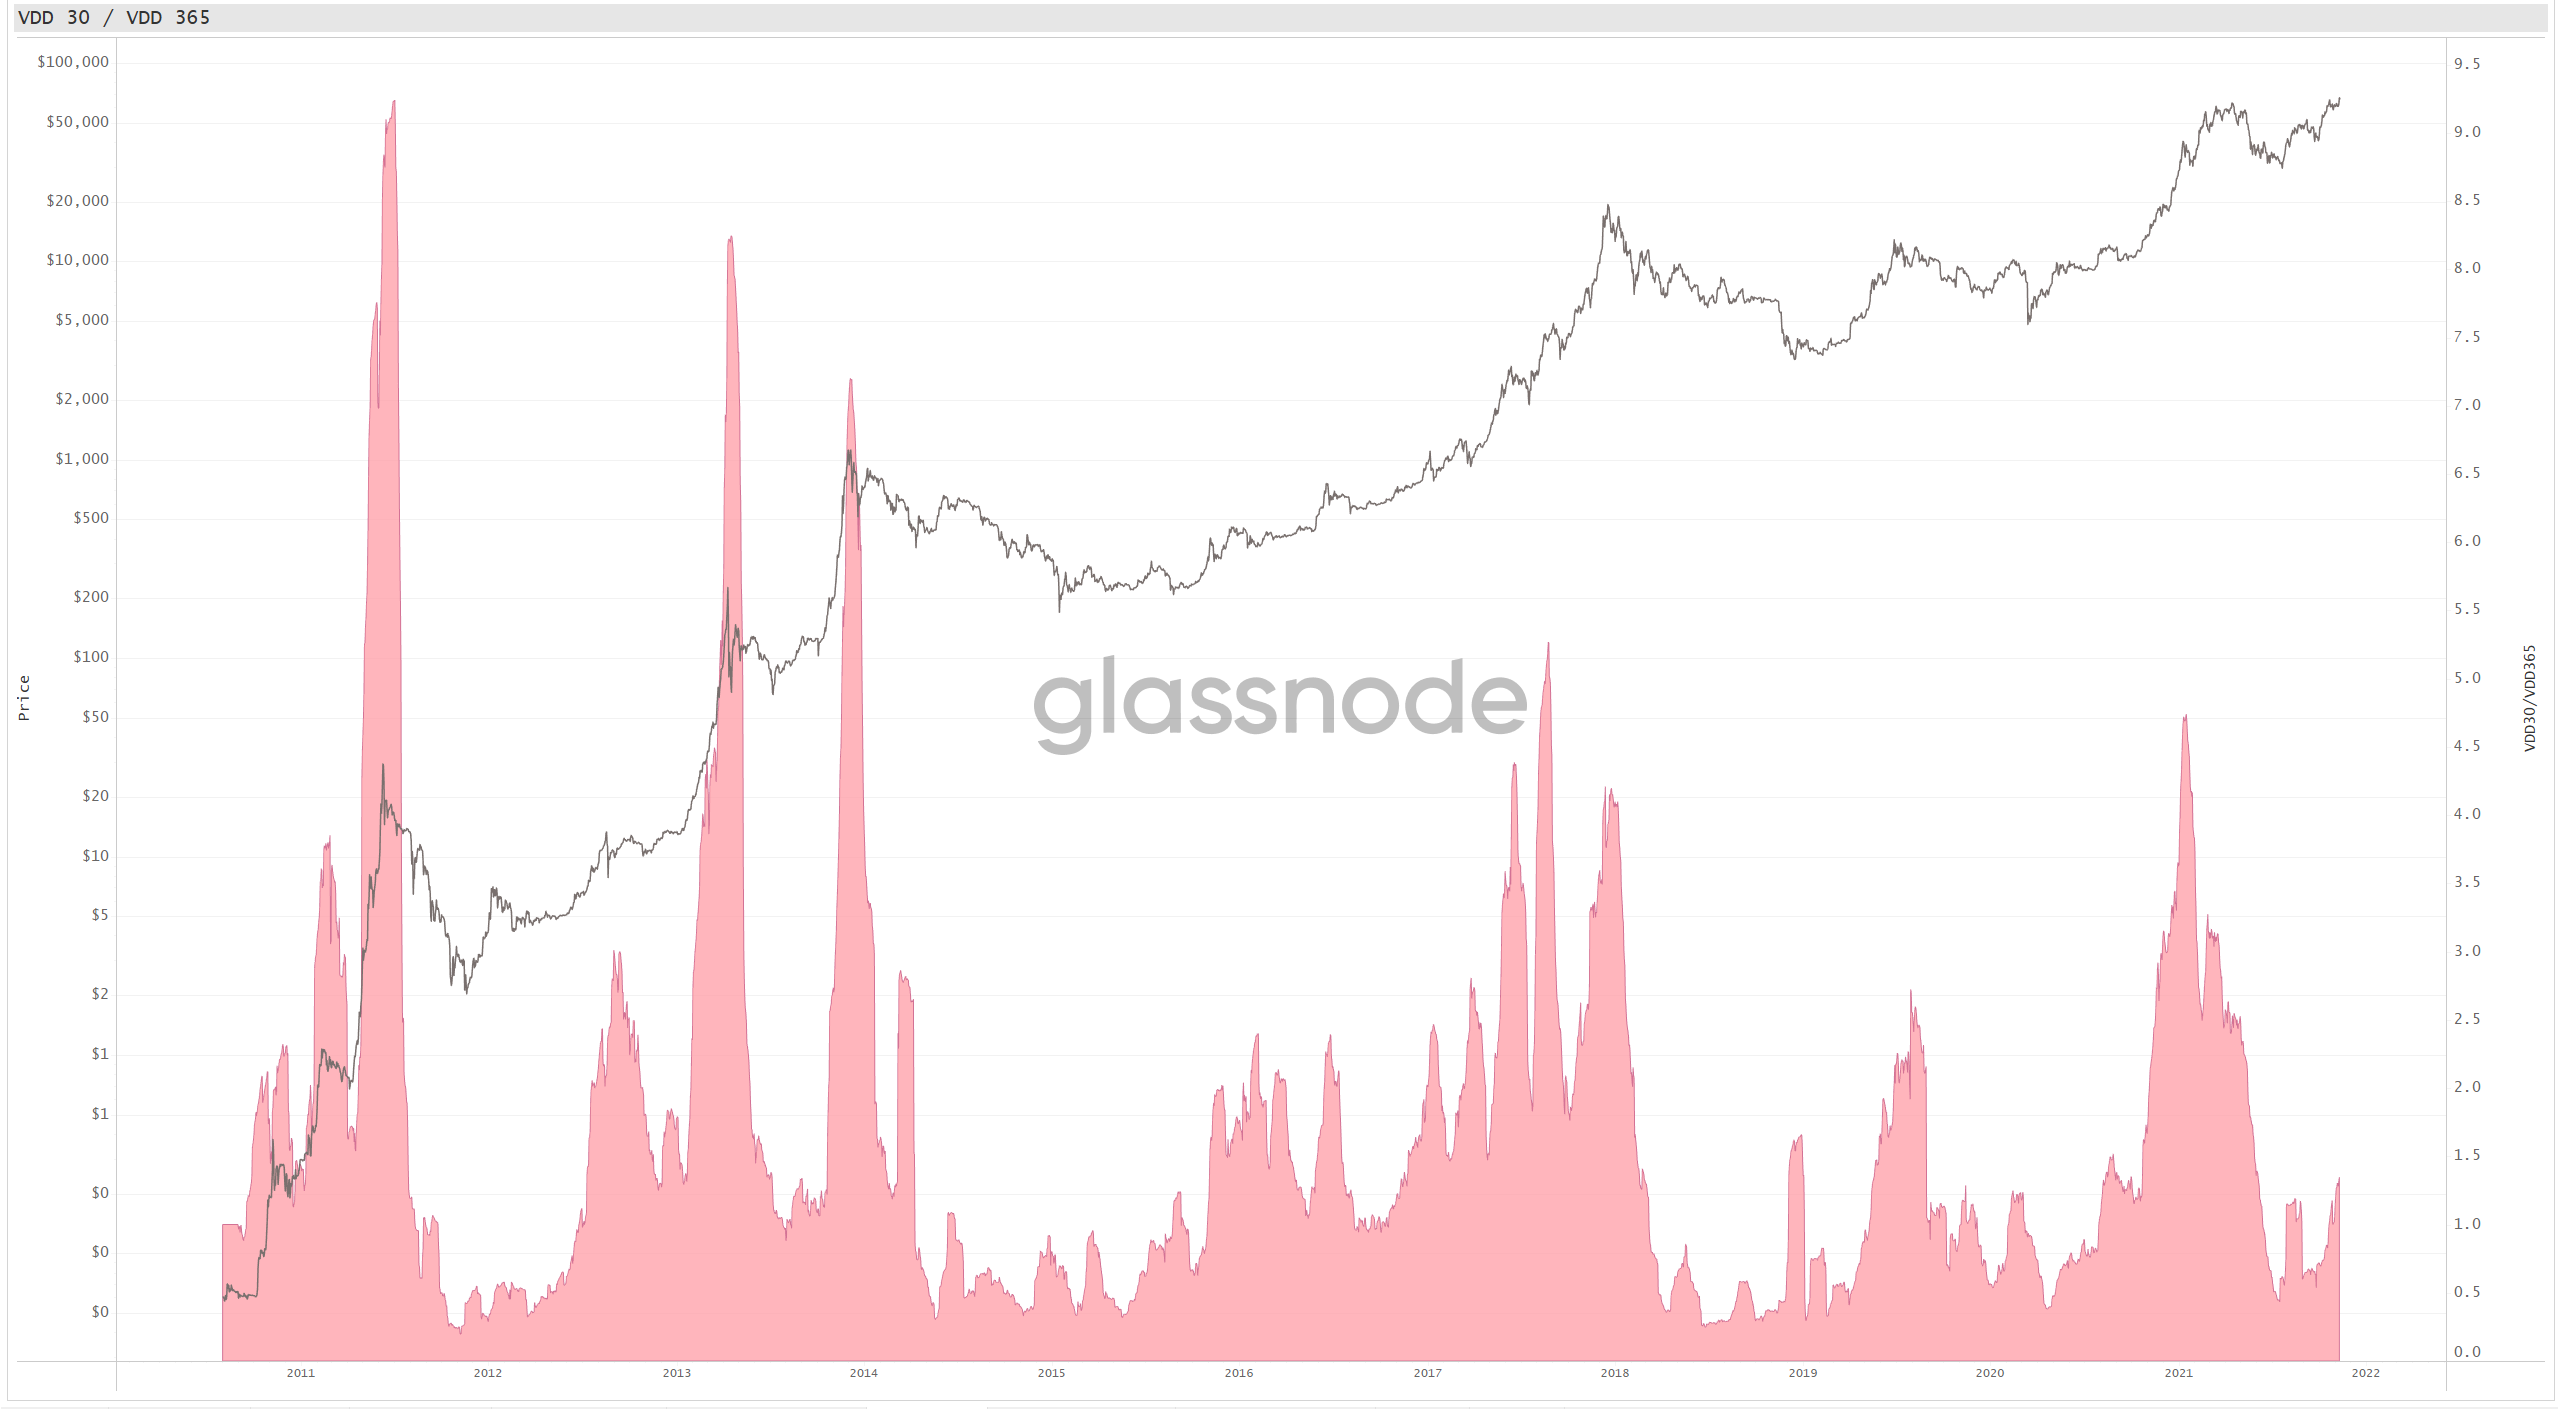
The next piece of the puzzle is to normalize for the perpetual rise in supply and lifespan (and thus coin days) over time. The chart above shows a progressive downtrend as markets mature, and more value and lifespan exists within the network. For this approach, we look to a method proposed by Checkmate for his metric Terminal Price.
When we normalise metrics by Supply, we amplify the old days (small denominator), and mute recent history (large denominator). One technique is to flip the ratio and adjust with a factor of 21e6. This ratio of Circulating Supply divided by 21M will slowly converge to 1 as more supply is mined, making heavier downwards adjustments to older data, and better bringing it in line with more recent and more mature markets, which we usually care more about.
This method of “terminal adjustment” is perfect inspiration for how we can normalize our Value Days Destroyed ratio to best account for supply changes. The final formula can be written as:

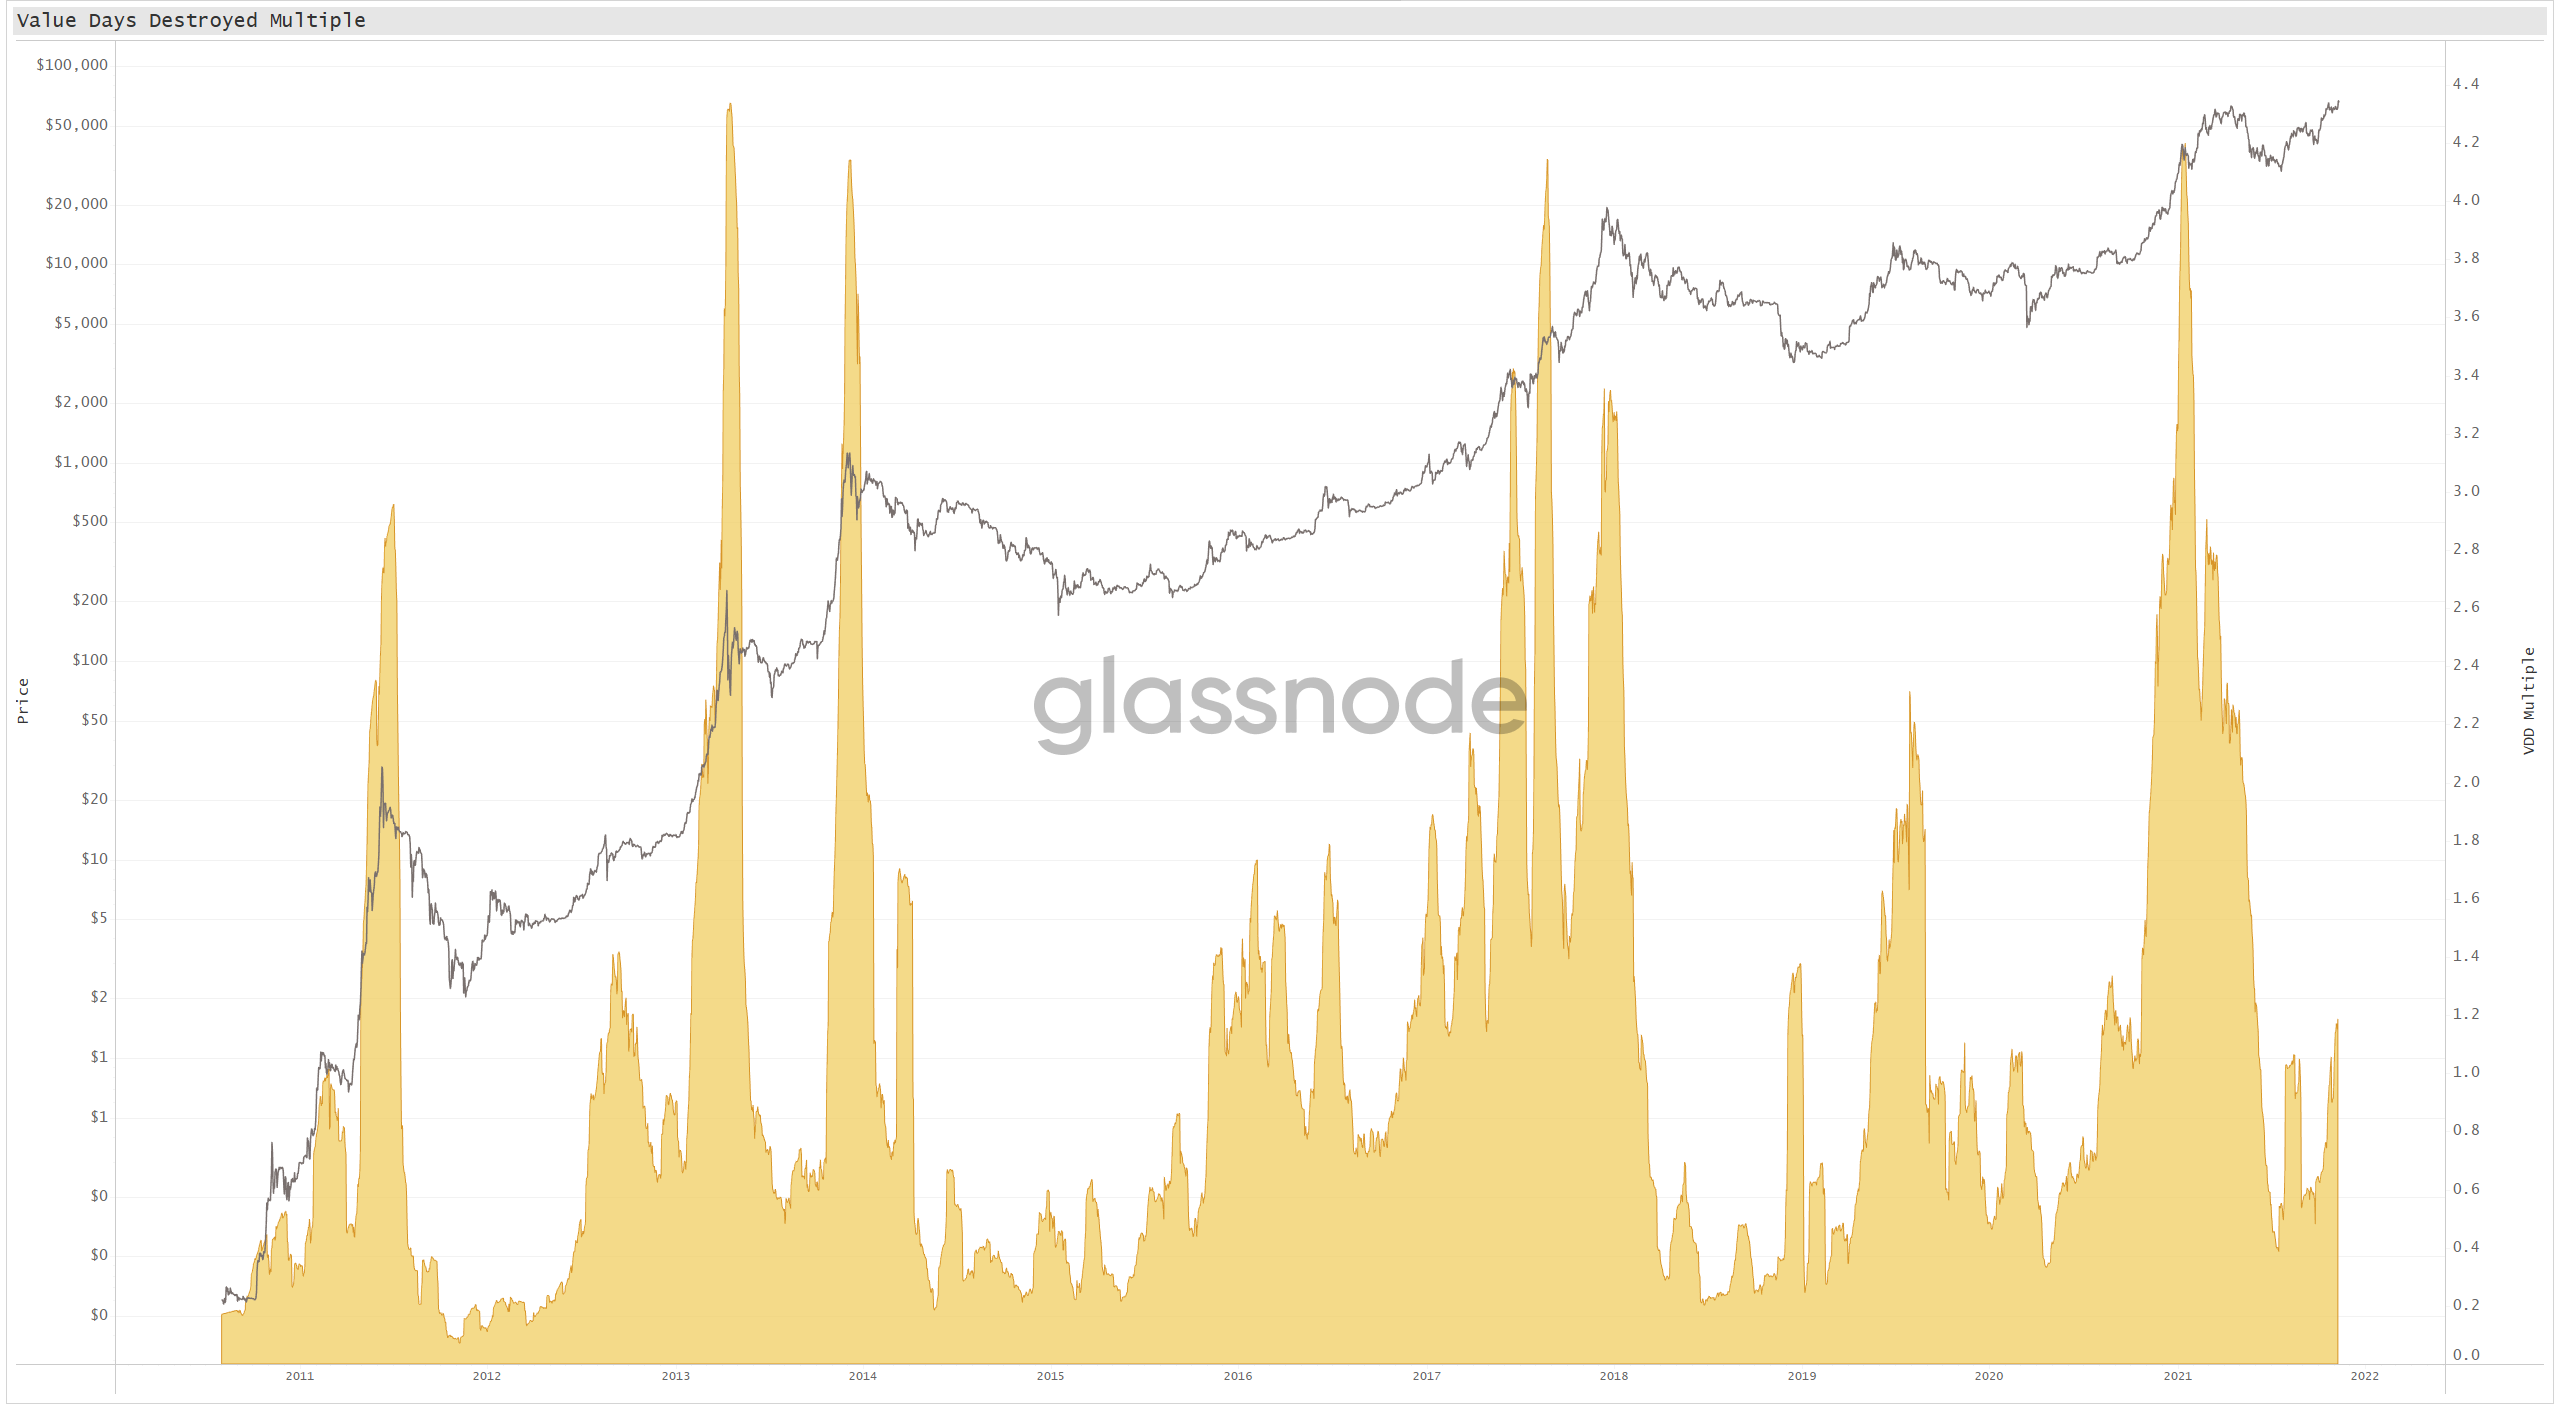
By employing a ratio of circulating supply to future supply cap, the trend shift of Value Days Destroyed is adjusted over time to account for the issuance ceiling. The final results yield an interestingly reliable oscillator with well aligned cycle peaks.
Identifying Probability Ranges
A way to further refine this oscillator is to identify key ranges based on lifetime values. To make this happen, we break out all values of the VDD Multiple across time into a probability histogram, then pinpoint percentages that represent meaningful levels in accordance with frequency.
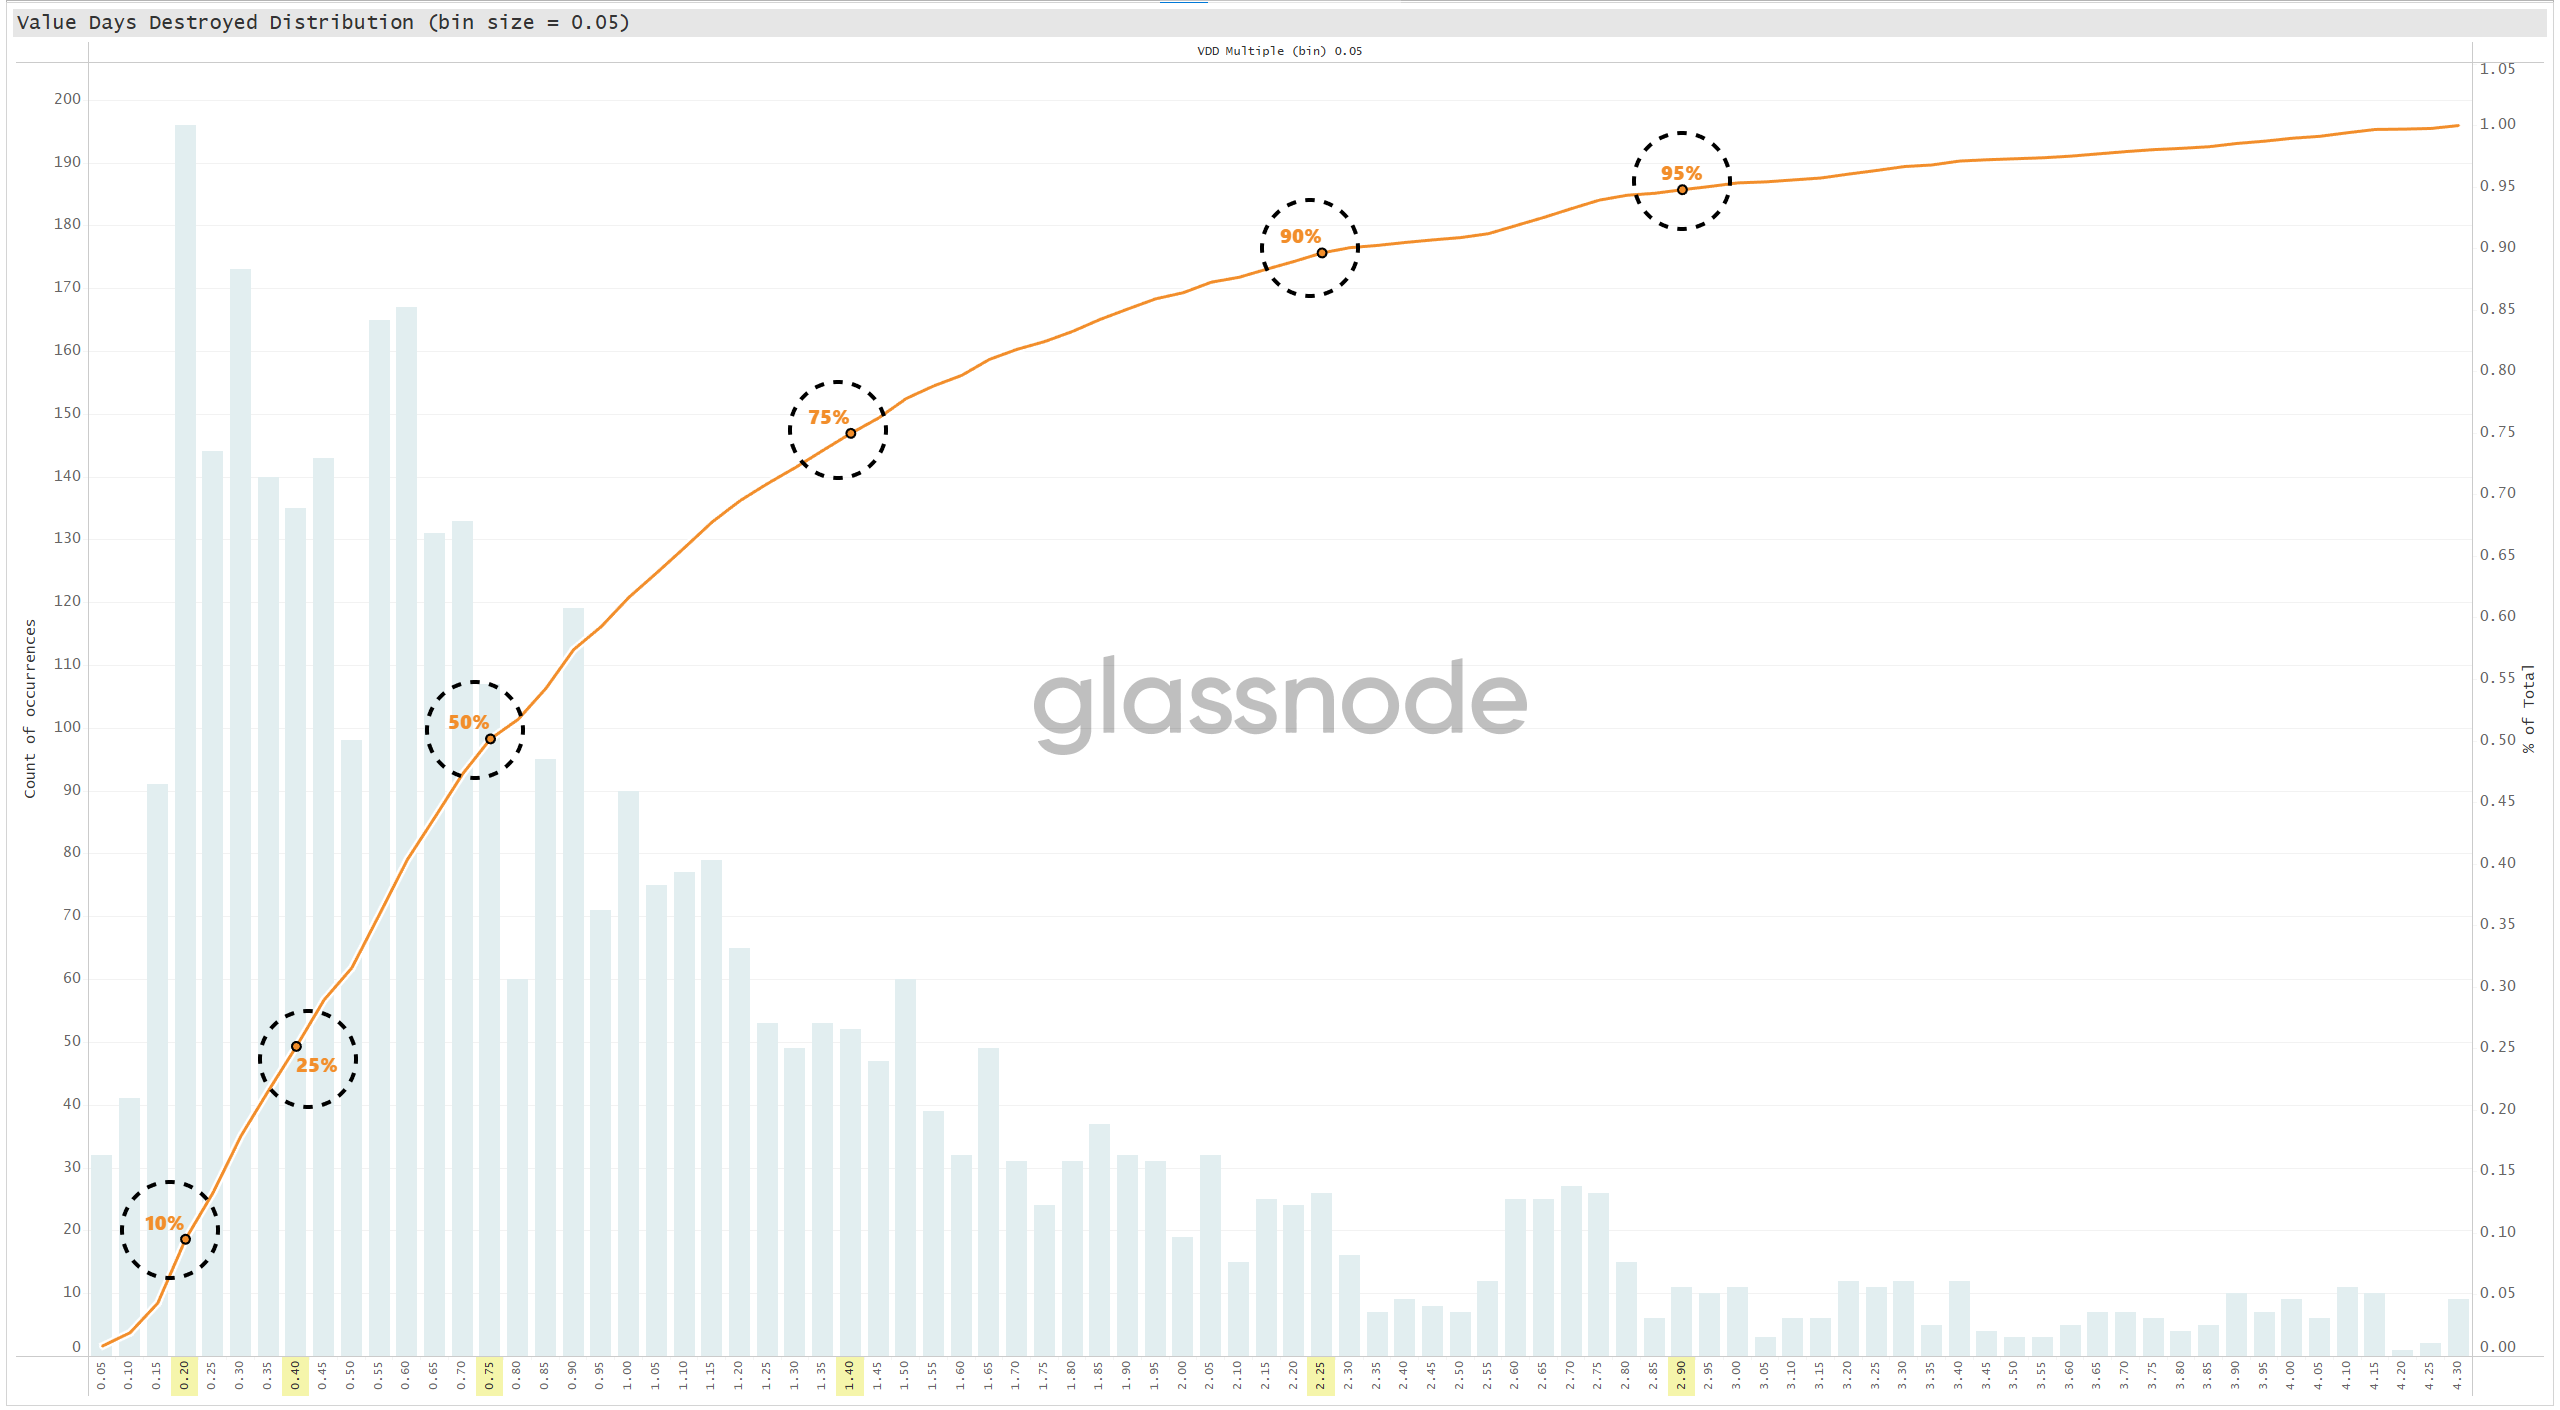
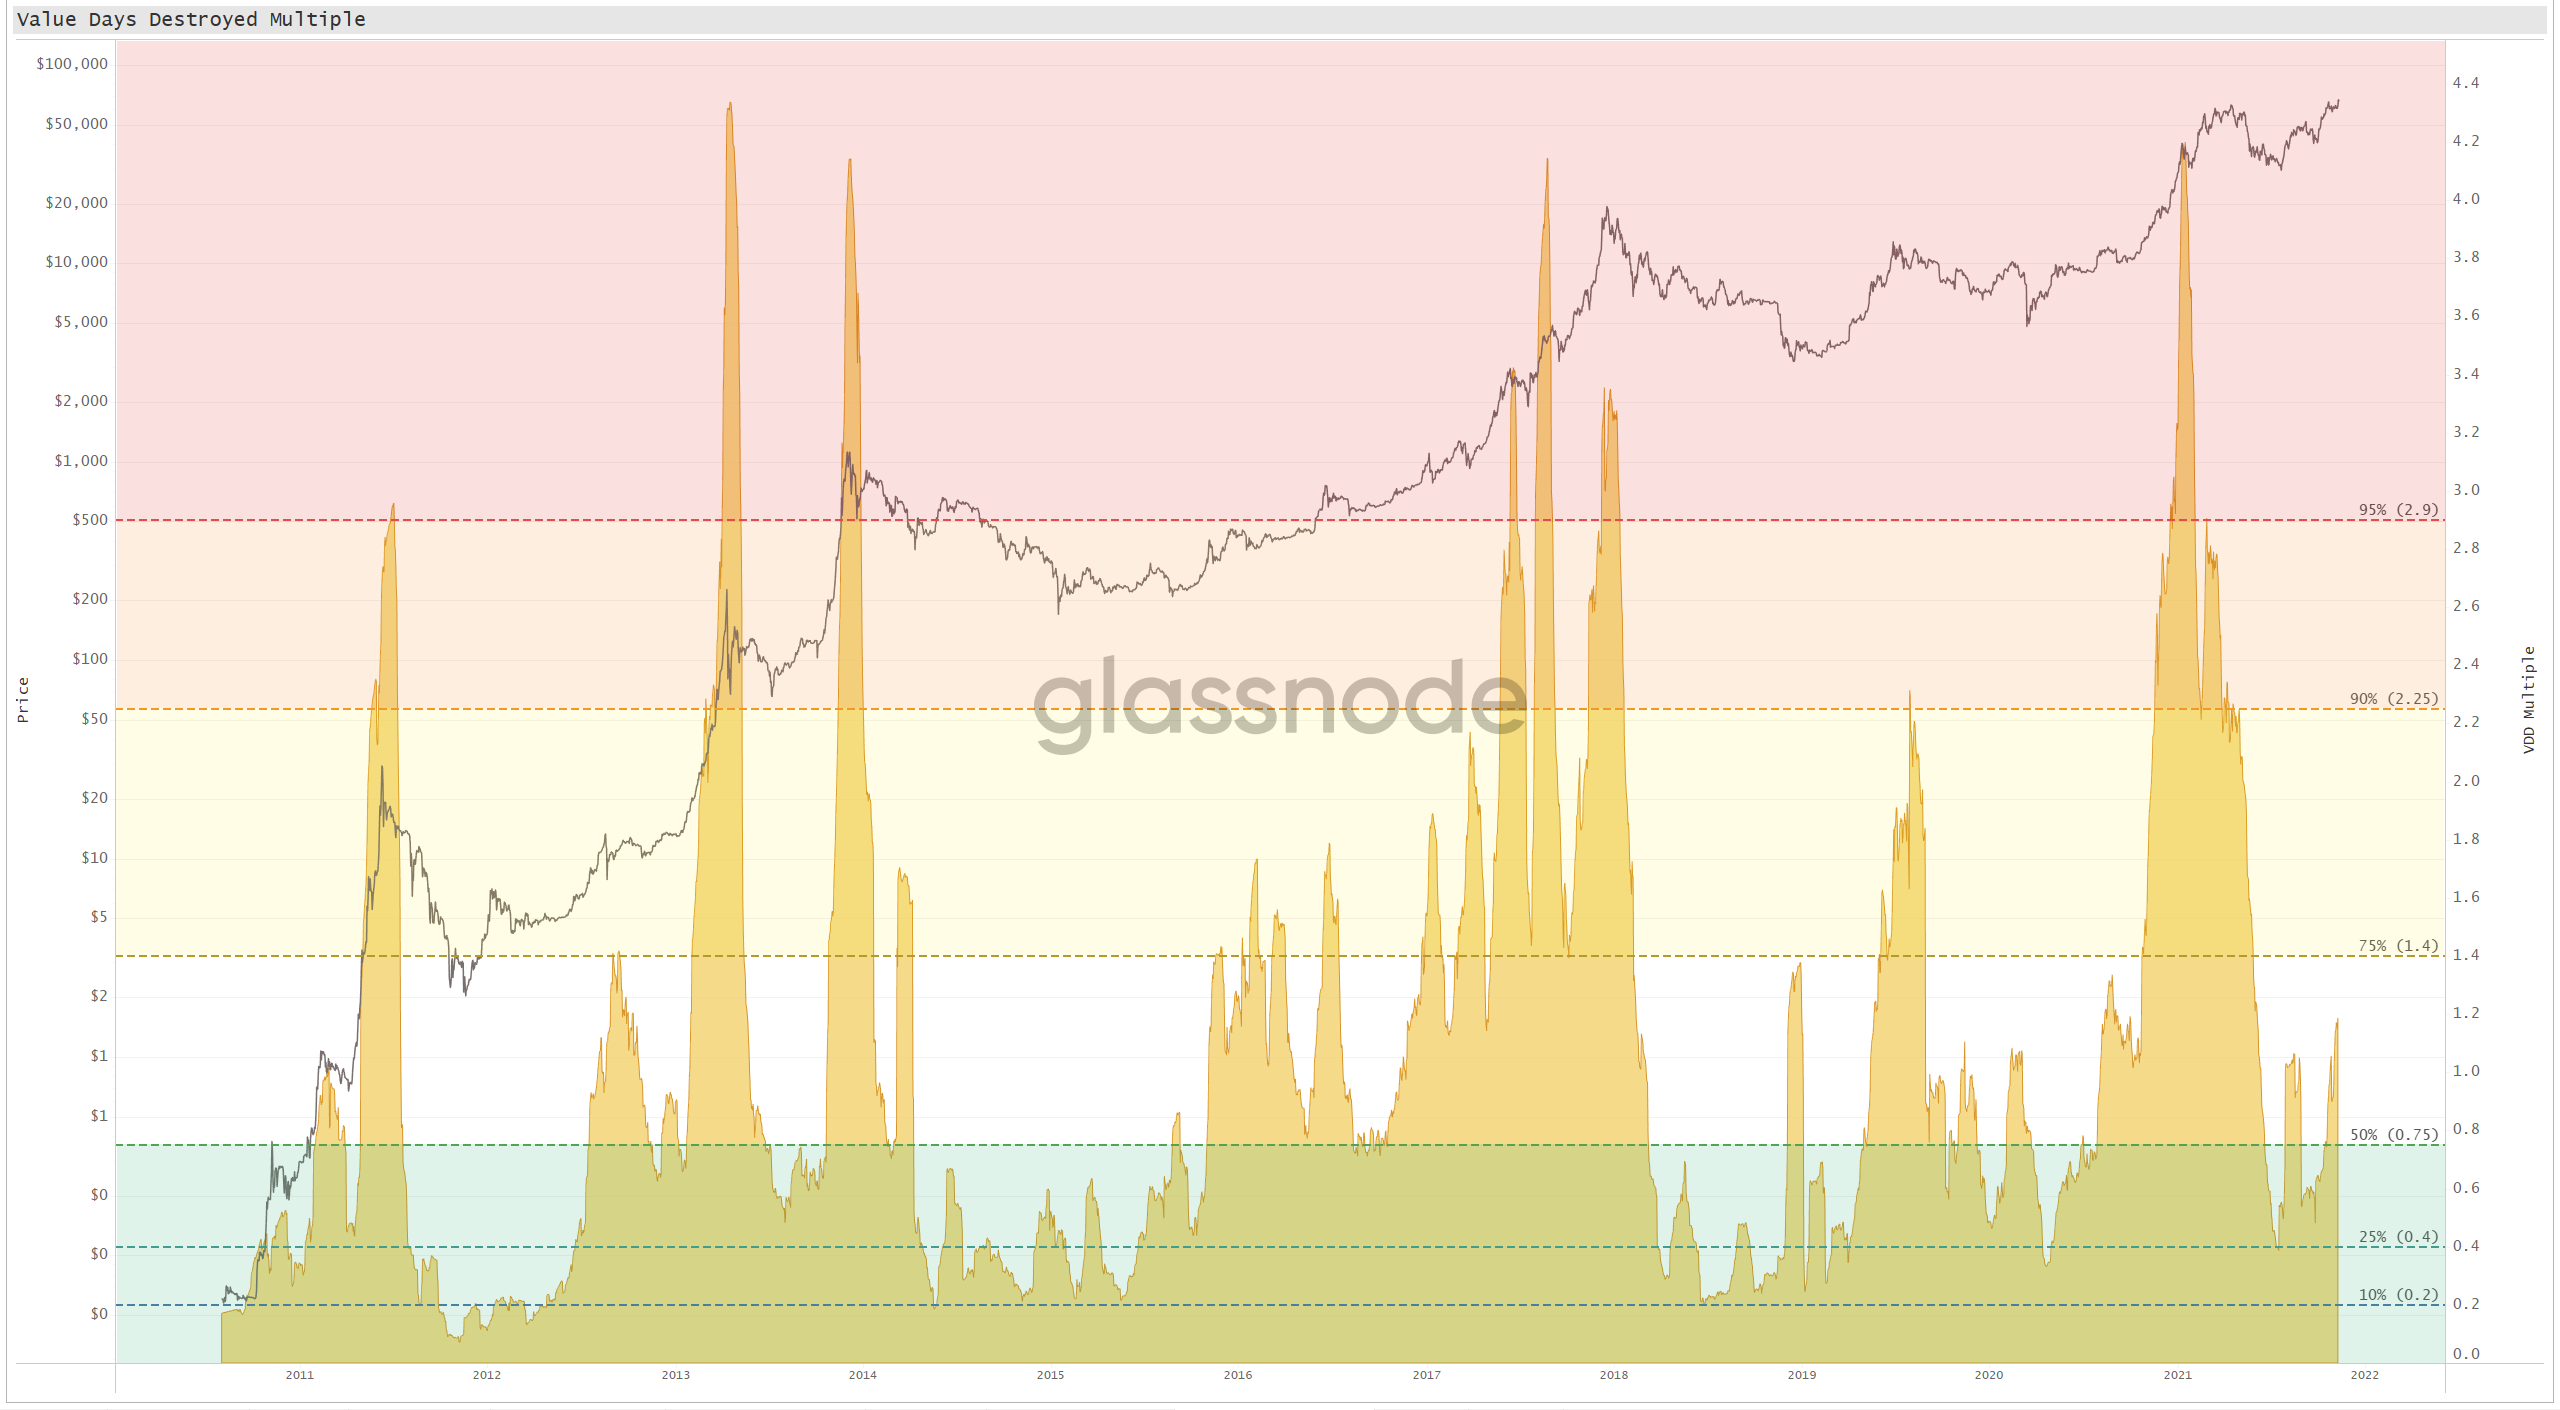
The end result of this exercise produces a series of important bands based on historical occurrence, annotated below as dashed lines.
In the example of the top line at a VDD Multiple of 2.9, the histogram value is listed as 95%. This means that 95% of Bitcoin’s history has traded with a VDD Multiple below 2.9. Thus, only 5% of Bitcoin’s history has seen a higher value than 2.9. These lines help us to interpret the “heat” of the market based on spending velocity.
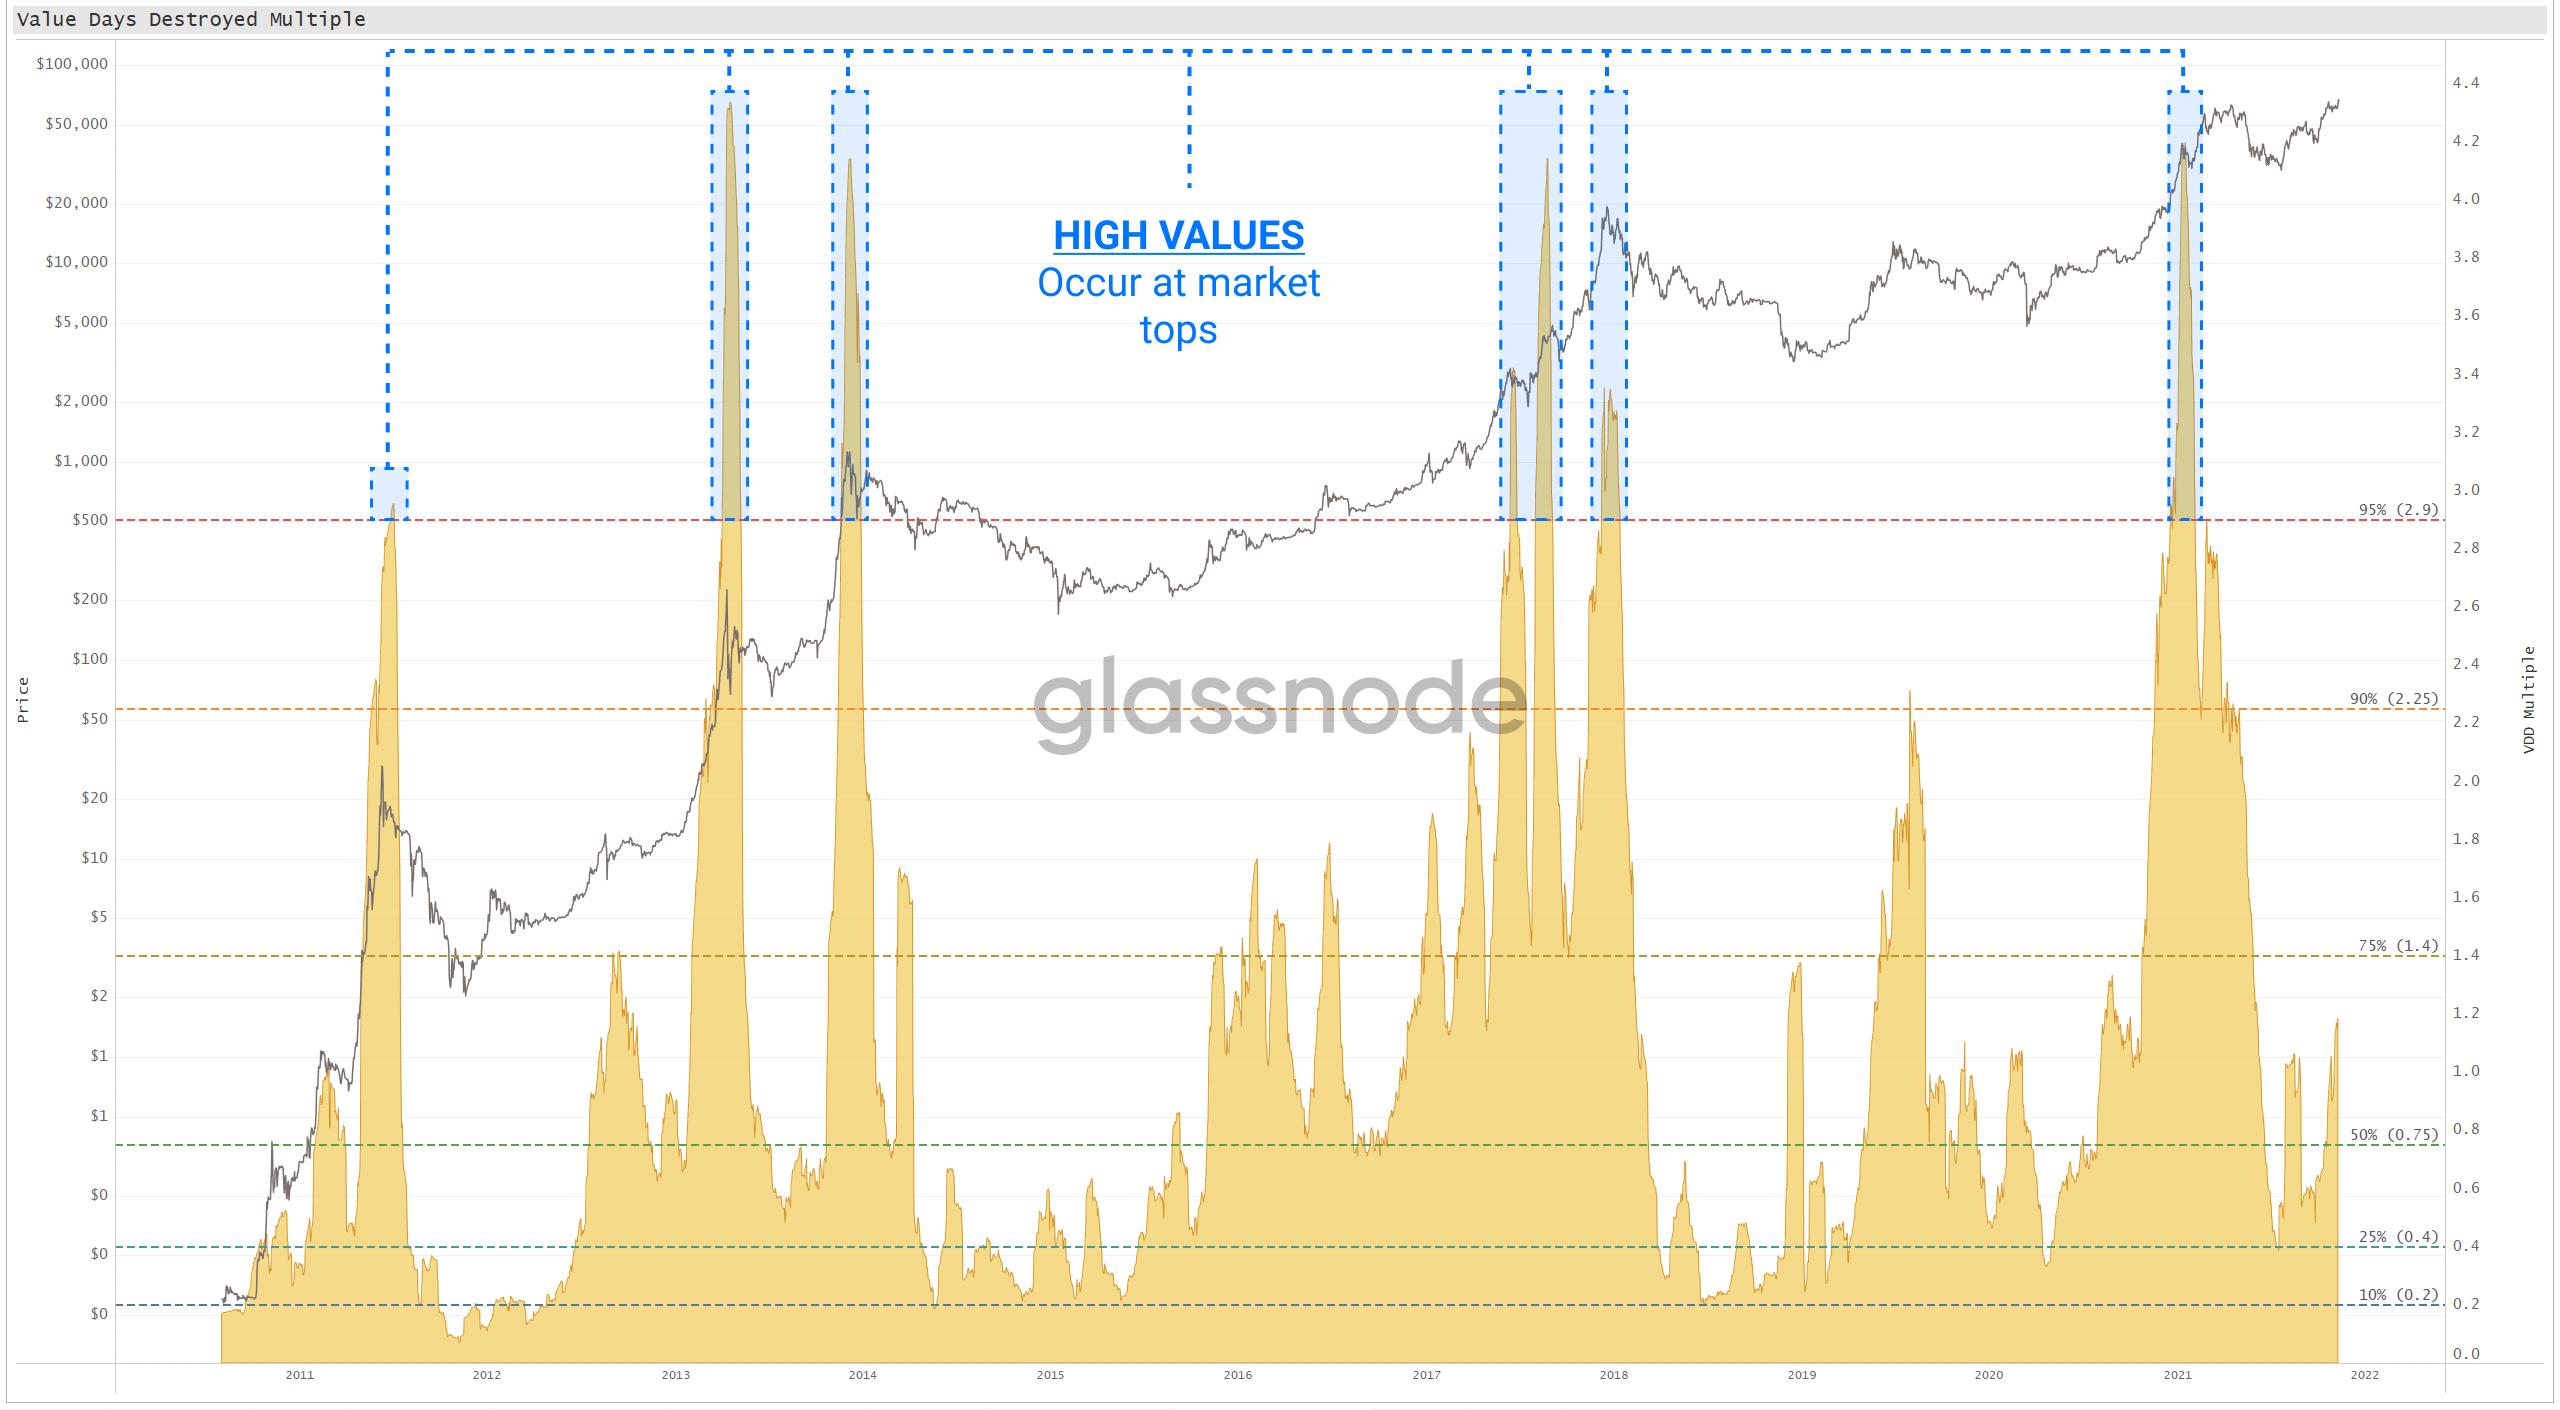
Key Observations
The product of our exercise offers a reliable top end range that aligns at or near all macro price peaks since 2011. Four of the seven signals printed at macro peaks, and the others came while price was creating new highs just before the peaks in late 2017 and early 2021.
Final Thoughts
Using trend shifts in on-chain spending activity as an oscillator proves itself a reliable barometer for market temperature and froth. The Value Days Destroyed Multiple is not a magic pill, but the baked-in inclusion of trend comparisons and the terminal adjustment for supply should give it an advantage toward signalling heated markets in the future. Furthermore, as fewer older coins are spent and the trend swaps to smart money accumulation, the Value Days Destroyed Multiple tends to bottom out signalling a potentially undervalued market.
You will find a Live chart for the Value of Coin-days Destroyed Multiple on Workbench.