Assessing the Distribution of ERC20 Tokens on the Ethereum Network
On-Chain Metrics Show Highly Uneven Token Distribution Across ERC20s

On-Chain Metrics Show Highly Uneven Token Distributions Across ERC20s
TL;DR We integrated four different on–chain distribution metrics for ERC20 tokens that are now available on studio.glassnode.com. These metrics are Percent Supply in Smart Contracts, Richlist Balance, Gini Coefficient, and Herfindahl Index. An analysis of these metrics across 73 ERC20 tokens shows that, generally speaking, tokens are unevenly distributed across network addresses. For instance, on average the richest 1% addresses hold 83.2% of funds held by externally owned addresses.
On–chain data gives insight into the underlying state and activity of decentralised networks. One interesting aspect is analysing and understanding how funds are distributed across stakeholders, with the objective of quantifying to what extent assets are evenly spread across network participants or in the hands of only a few.
The common approach is to look at all addresses within the network and the amount of funds they hold at any given point in time (their balance), and how that balance relates to the total circulating supply.
At Glassnode we’ve done detailed on–chain distribution analyses of ERC20 tokens in the past, in particular for BAT and LINK. As a subsequent step we now aimed at implementing metrics that represent the distribution of a token as a single number, making it easy to track over time and allowing to compare tokens.
Therefore, we’ve added live versions of four distribution metrics for ERC20 tokens, that are available on Glassnode Studio and through our API as of today. These metrics are Percent Supply in Smart Contracts, Richlist Balance, Gini Coefficient, and Herfindahl Index.
In the following I will introduce these metrics and present an analysis where we looked at all 73 different ERC20 tokens currently supported on the Glassnode platform in order to obtain a general assessment of token distribution in the ERC20 ecosystem.
The Methodology
Before defining the metrics, it is important to note how we filter addresses that go into the computation of the Richlist Balance, Gini Coefficient, and Herfindahl Index.
First, we only take into consideration Externally Owned Accounts (EOAs). This, in turn, means that we discard all smart contract addresses. The reason is simple: We want to obtain a metric that tells us how assets that are held by actual (external) users of the network, not funds from many individuals that are being held together in a single smart contract address. In order to obtain full picture and the amount of the total supply that is being discarded in these three distribution metrics, we also implemented a metric that gives the percent of supply in smart contracts.
Second, we discard addresses that we have flagged as “special”. These are asset-specific addresses and include for instance team accounts, ICO addresses, or other special accounts that are part of the token’s conceptual design and utility, and which hold funds that are owned by more that one person.
Finally, we also drop exchange addresses. These are, obviously, cold and hot exchange wallets that hold tokens from many different individuals and which would distort the distribution results.
Note: Our list of flagged exchange addresses and asset-specific “special” addresses is constantly being improved and updated.
The Metrics
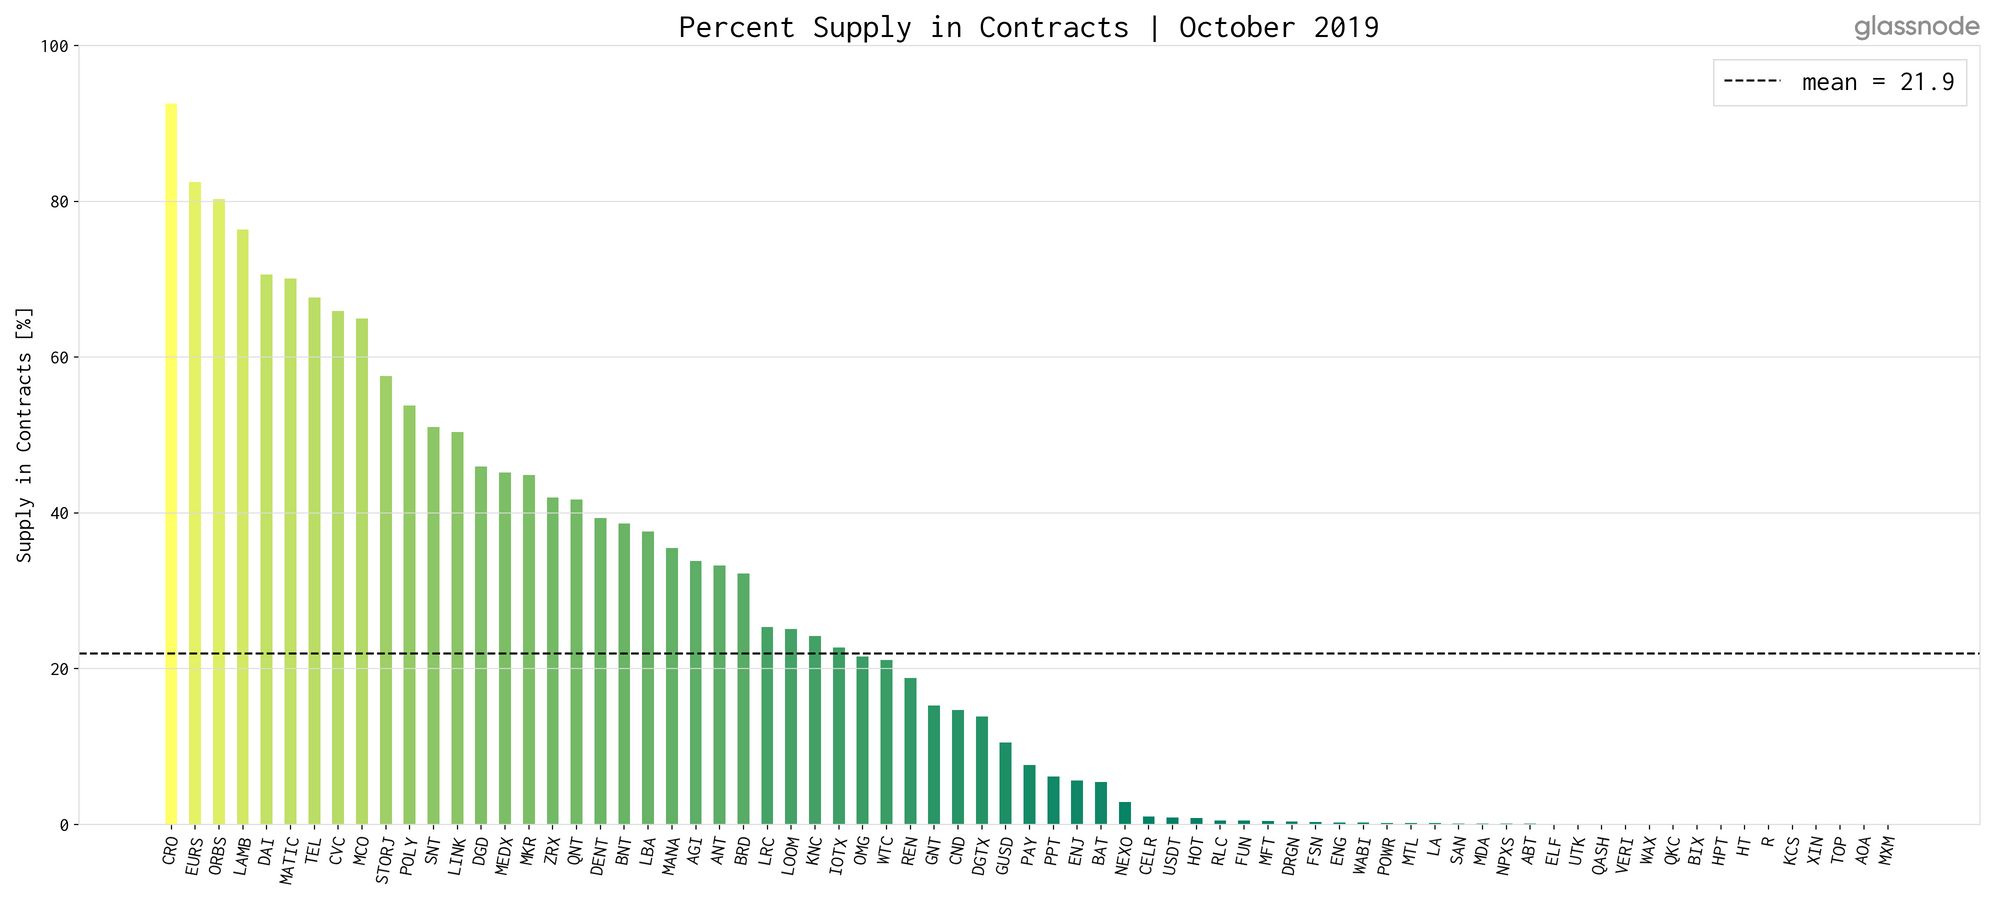
Percent Supply in Smart Contracts
The supply of assets held in smart contracts is self-explanatory: It shows the percentage of the total supply of a token that is held in smart contracts. While it’s an interesting metric in its own right, it also provides the necessary information on the amount of supply that is being dropped to compute the other metrics presented here (which are based on Externally Owned Accounts only).
The amount of supply in contracts of the analysed tokens ranges all the way from basically zero, up to 92% for CRO.
Richlist Balance
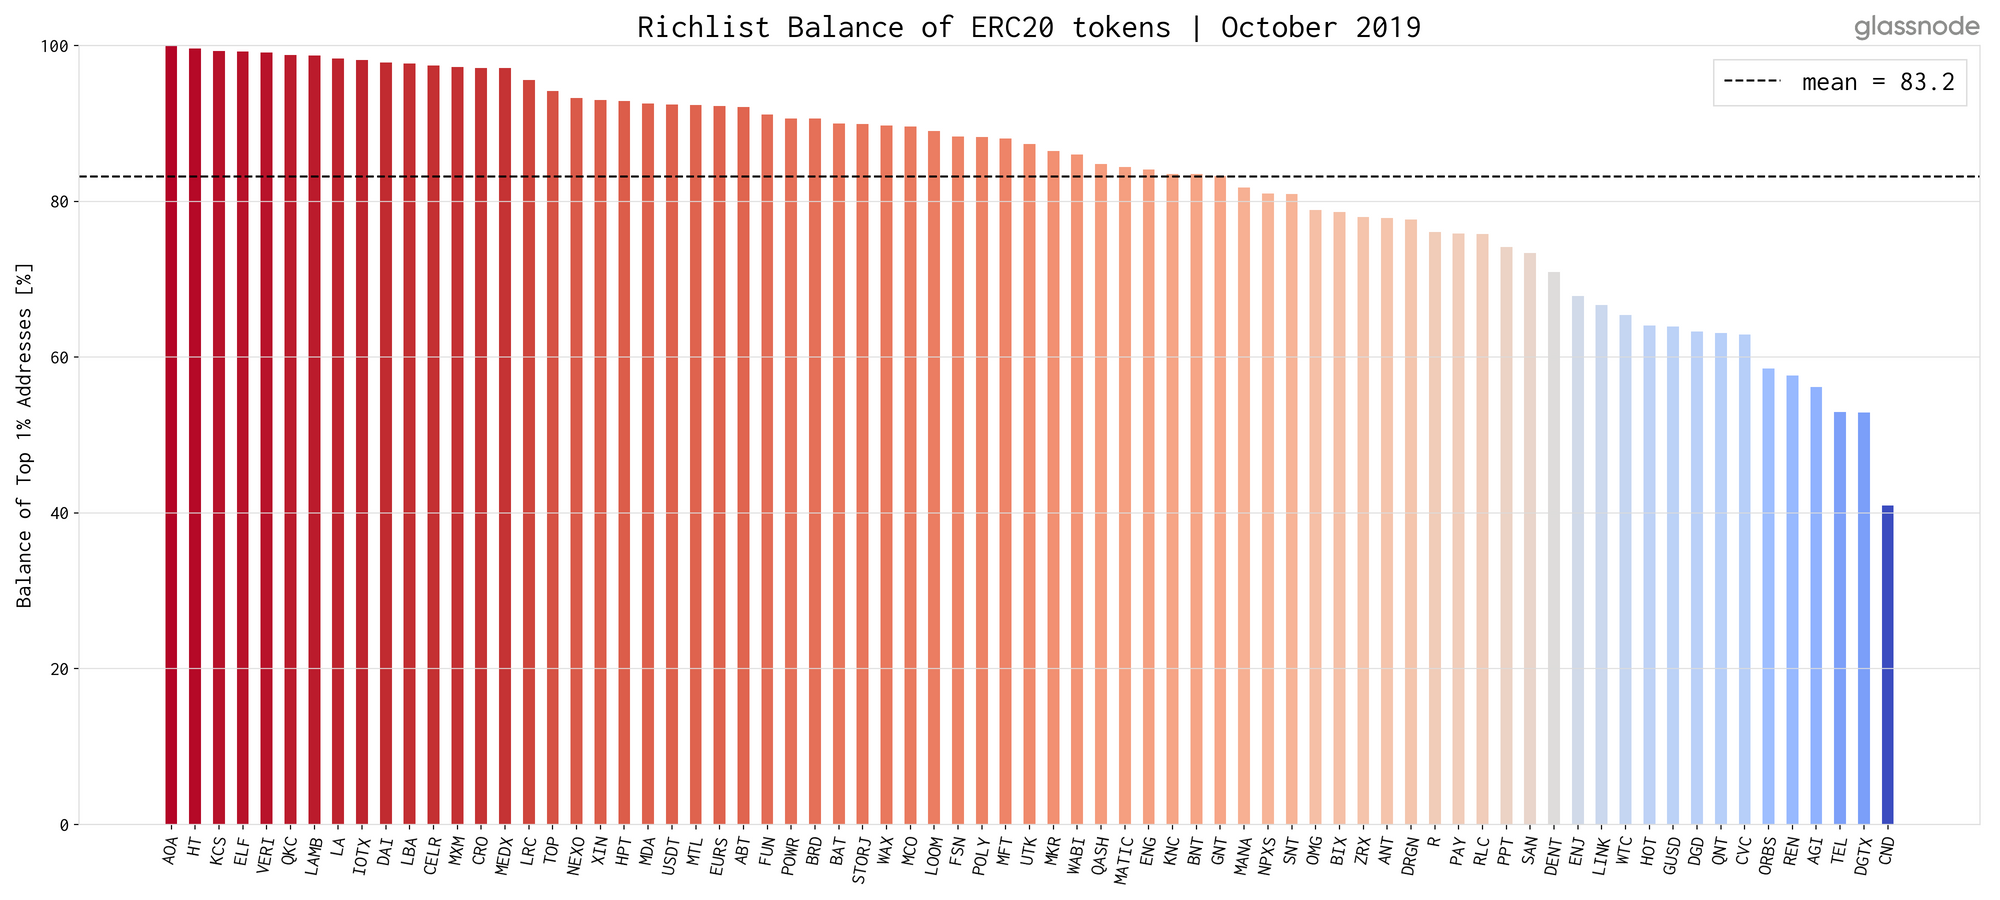
This is probably the easiest and most straight-forward distribution metric presented here: The Richlist Balance is simply the percentage of the EOA supply that is held by the 1% richest addresses (with respect to the token). Hence, it is easy to interpret as it simply shows the amount of funds the richest 1% hold.
The following chart shows that the richest 1% addresses hold between 41% (CND) and almost 100% (AOA) of externally held funds — with a mean of ~83.2%. These numbers indicate a relative concentration of funds on a small number of addresses.
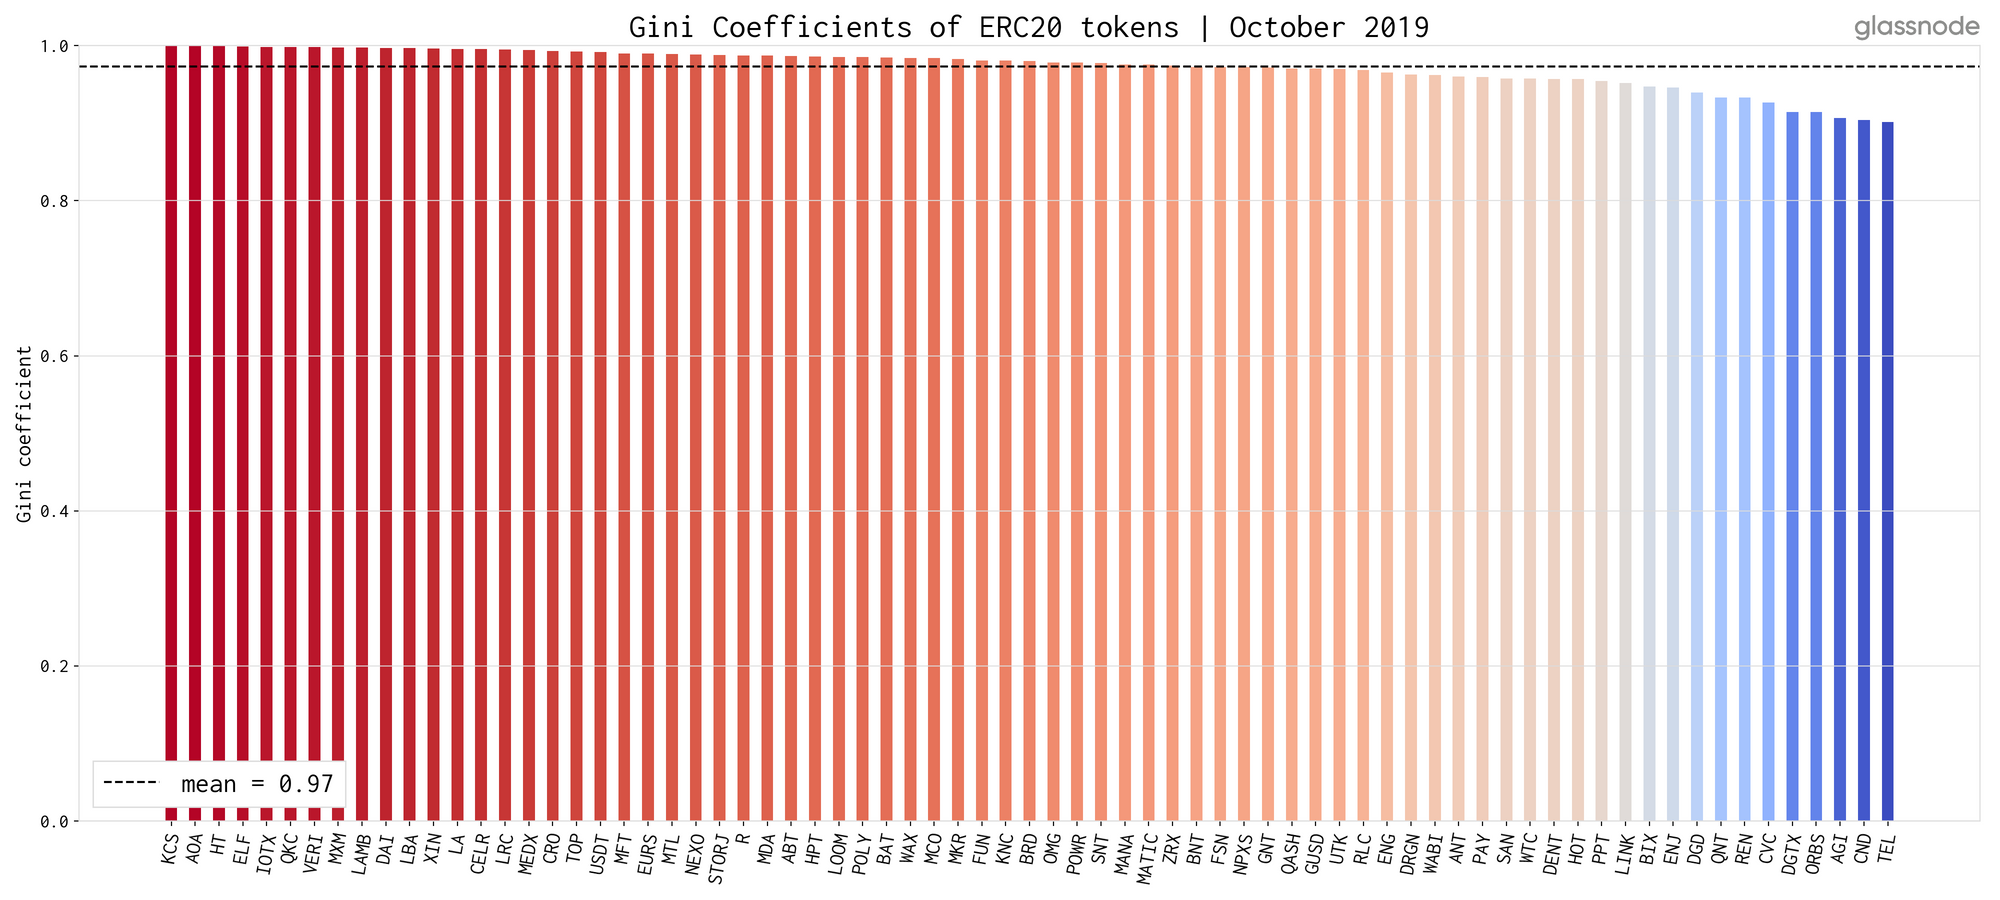
Gini Coefficient
The Gini Coefficient is a well known statistical measure for inequality in distributions. It has been traditionally used as a gauge of economic inequality, measuring income distribution among a country’s population. The coefficient ranges from 0 to 1, with 0 representing perfect equality and 1 representing perfect inequality.
Hence, a token in which every address has the same balance would have a Gini Coefficient of 0. A token in which one address holds all the funds, while all others hold nothing, has a Gini Coefficient of 1.
Our analysis shows that, according to Gini, distribution of tokens is highly unequal. The average Gini Coefficient (as of October 2019) across all analysed tokens is 0.97.
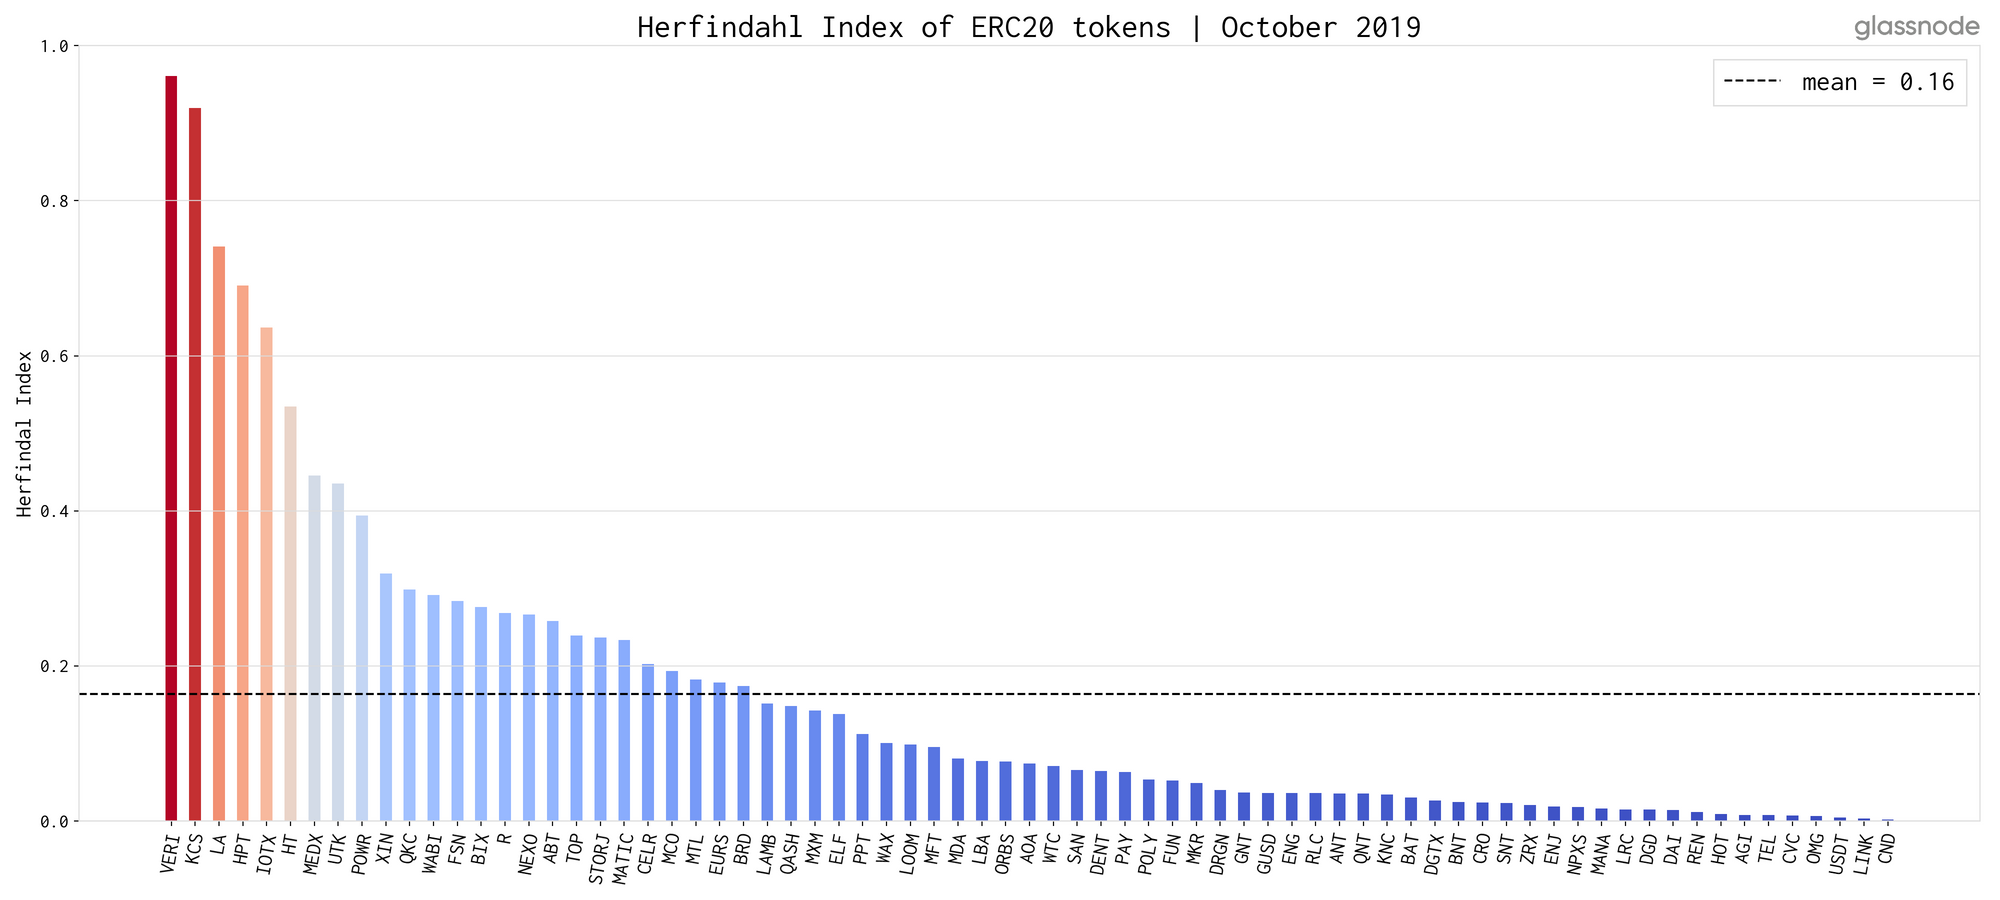
Herfindahl Index
Finally, the Herfindahl Index is a common measure of market concentration and is originally used to determine market competitiveness. It is computed by squaring the market share of each company competing in a market and then summing the resulting numbers.
Here, we experimentally adapted the Herfindahl Index as a metric of concentration of funds within addresses in the network. Thus, the “market” in our case is the total EOA supply, and the “market share” is the relative balance of each address with respect to the EOA supply. Hence, the Herfindahl Index provides us with a single number representing token concentration across addresses in the network.
The Herfindahl Index ranges between 0 and 1: A large score indicates high concentration of supply, whereas a small score is an indicator for more evenly distributed funds across addresses. In particular, the Herfindahl Index is useful for the identification of tokens in which a single addresses/entities owns a predominant amount of the token.
Our results show that the Herfindahl Index is — compared to the Richlist Balance and the Gini Coefficient — the most dispersed, covering the complete interval between 0 and 1 with CND on the lower end (0.002) and VERI on the upper end (0.96).
Objections
There are a couple objections to the presented metrics and analyses that we want to address.
1) “One address does not necessarily map to one user — one user can have many addresses”
This is a common and very valid objection to the proposed methodology. Nonetheless, that fact that one user can control multiple addresses is one that we are willing to tolerate, because the reported results hold true regardless. If anything, handling the fact that a user can have multiple addresses would only skew the distributions even more and emphasise our results showing highly non-uniform distributions. In our opinion, it is much more important to correctly account for addresses that hold funds of many different users.
2) “It is unfair to discard smart contract balances — these can make up a large part of the total supply”
We’re aware that dropping smart contract addresses doesn’t paint the full picture. However, there are good reasons to actually discard them. First, including smart contracts that hold funds from many different stakeholders, would distort the results of the distribution metrics — a trade-off we did not want to make (see the first objection). Of course there are ways to separate the funds in smart contracts to different owners, however this is an approach we did not find to be scalable at this point, therefore we approached this pragmatically. Second, we are interested in these token distributions from the perspective of an investor and trader. And tokens that are being traded, are usually held in EOAs (exception: DEXs). Spotting tokens that are highly concentrated and held by only a few external addresses can be an immediate red flag to invest or trade a particular token. Therefore, looking at EOAs alone is a valuable approach.
3) “It is an unfair comparison, the distribution of funds depends also on the utility of the token, which is different for all”
This objection is one that can be true for the analyses presented here — not for the metrics themselves though. You can use the these metrics on a single token basis, in order to evaluate how the token evolves over time with respect to its distribution and assess its current state. You don’t necessarily need to use these metrics in order to compare and/or rank tokens.
Conclusion
We implemented four different metrics to assess the distribution of ERC20 tokens across Externally Owned Addresses in the Ethereum network: Percent Supply in Smart Contracts, Richlist Balance, Gini Coefficient, and Herfindahl Index. While the first simply gives the ratio of funds held in smart contracts vs EOAs, the other three metrics are a different attempts to measure how evenly funds are distributed across network addresses.
According to the Richlist Balance and Gini, our analyses across 73 different ERC20 tokens show that generally tokens are unequally distributed, while the Herfindahl Index paints a more neutral picture on the concentration of funds in network addresses. The interpretability and the choice of metric that most accurately represent the distribution of tokens in the network is left to the reader. Going forward, we will be closely investigating and deep diving into these metrics ourselves and improve our methodology, with the goal of obtaining the most accurate picture on fund distribution of ERC20 tokens.
Live implementations of all metrics presented here are available on Glassnode Studio and through our API.

- Follow us and reach out on Twitter
- For on–chain metrics and activity graphs, visit Glassnode Studio
- For automated alerts on core on–chain metrics and activity on exchanges, visit our Glassnode Alerts Twitter
Disclaimer: This report does not provide any investment advice. All data is provided for information purposes only. No investment decision shall be based on the information provided here and you are solely responsible for your own investment decisions.