An On-Chain Distribution Analysis of Chainlink (LINK)
In this report we take an in-depth look into the LINK ecosystem; exploring the recent team sell-offs, exchange balances and do a broad token holder distribution analysis.


Glassnode is a blockchain data provider that generates innovative on-chain market intelligence and tools for digital asset stakeholders enabling them to make more informed decisions and help foster wider market maturity.
In this post we are taking a look at the token holder distribution of Chainlink.
The present analysis is based on block 8,152,293 on July 14th 2019, at which point 42,211 addresses were holding more than 1 LINK.
What is Chainlink?

Chainlink is a decentralised oracle network which allows Ethereum smart contracts to securely connect to external APIs, payment systems, and other data sources. To prevent the need for a trusted third party, multiple independent nodes collectively determine the accuracy of an external input before it is written into a smart contract.
The LINK token is used to pay node operators for retrieving data from off-chain feeds, formatting it into blockchain-compatible formats, and performing off-chain computation. It is also staked by node operators to guarantee uptime, correct data, and honest behaviour.
In the past 3 months, LINK has seen a substantial increase in price due to the release of its mainnet, a series of partnerships with the likes of Google and Oracle and getting listed on Coinbase. We covered LINK’s recent price action in Glassnotes Issue #2.
Visit the Glassnode Studio to explore LINK’s core on-chain metrics.
ICO Distribution
Chainlink was initially distributed through an ICO on September 17, 2017. A total of 1,000,000,000 LINK were minted.
- 35% was available during the public sale.
- 35% was allocated for node operator incentives.
- 30% went to the company to support the development of the Chainlink protocol.

Total Supply Distribution
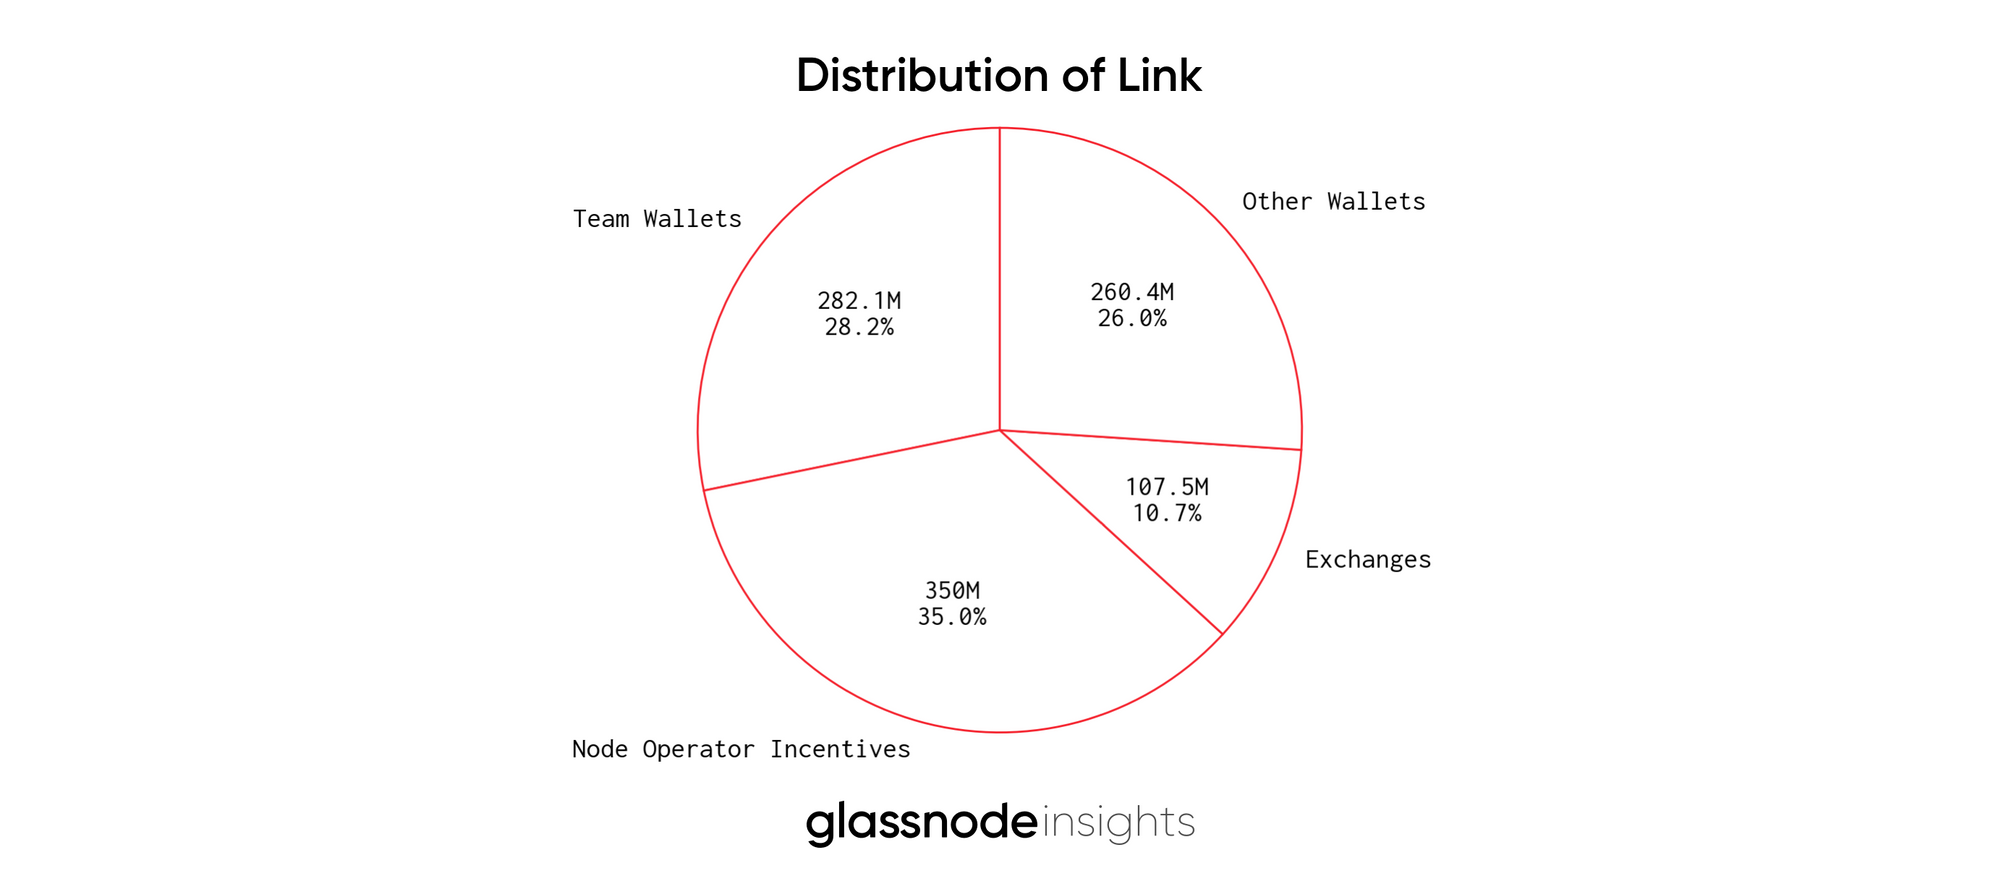
Below we show the current distribution of LINK. We’ve included known team wallets, the node operator allocation, known exchange wallets as well as an aggregate of all other unlabelled LINK holding addresses.
Team Wallet Movements
In the above chart, it’s interesting to note that the team allocation has shrunk by 6.8% since the ICO indicating that the team has sold/moved tokens.
Below is a graph showing the balance of the team reserve over time. Each address was sent 50,000,000 LINK when the token was initially distributed.
The wallets included are the following:
- 0xe0362f7445e3203a496f6f8b3d51cbb413b69be2 - Current balance: 50,000,000 LINK
- 0x75398564ce69b7498da10a11ab06fd8ff549001c - Current balance: 50,000,000 LINK
- 0x5560d001f977df5e49ead7ab0bdd437c4ee3a99e - Current balance: 50,000,000 LINK
- 0xdad22a85ef8310ef582b70e4051e543f3153e11f - Current balance: 46,500,000 LINK
- 0xbe6977e08d4479c0a6777539ae0e8fa27be4e9d6 - Current balance: 50,000,000 LINK
- 0xf37c348b7d19b17b29cd5cfa64cfa48e2d6eb8db - Current balance: 35,590,421.01 LINK
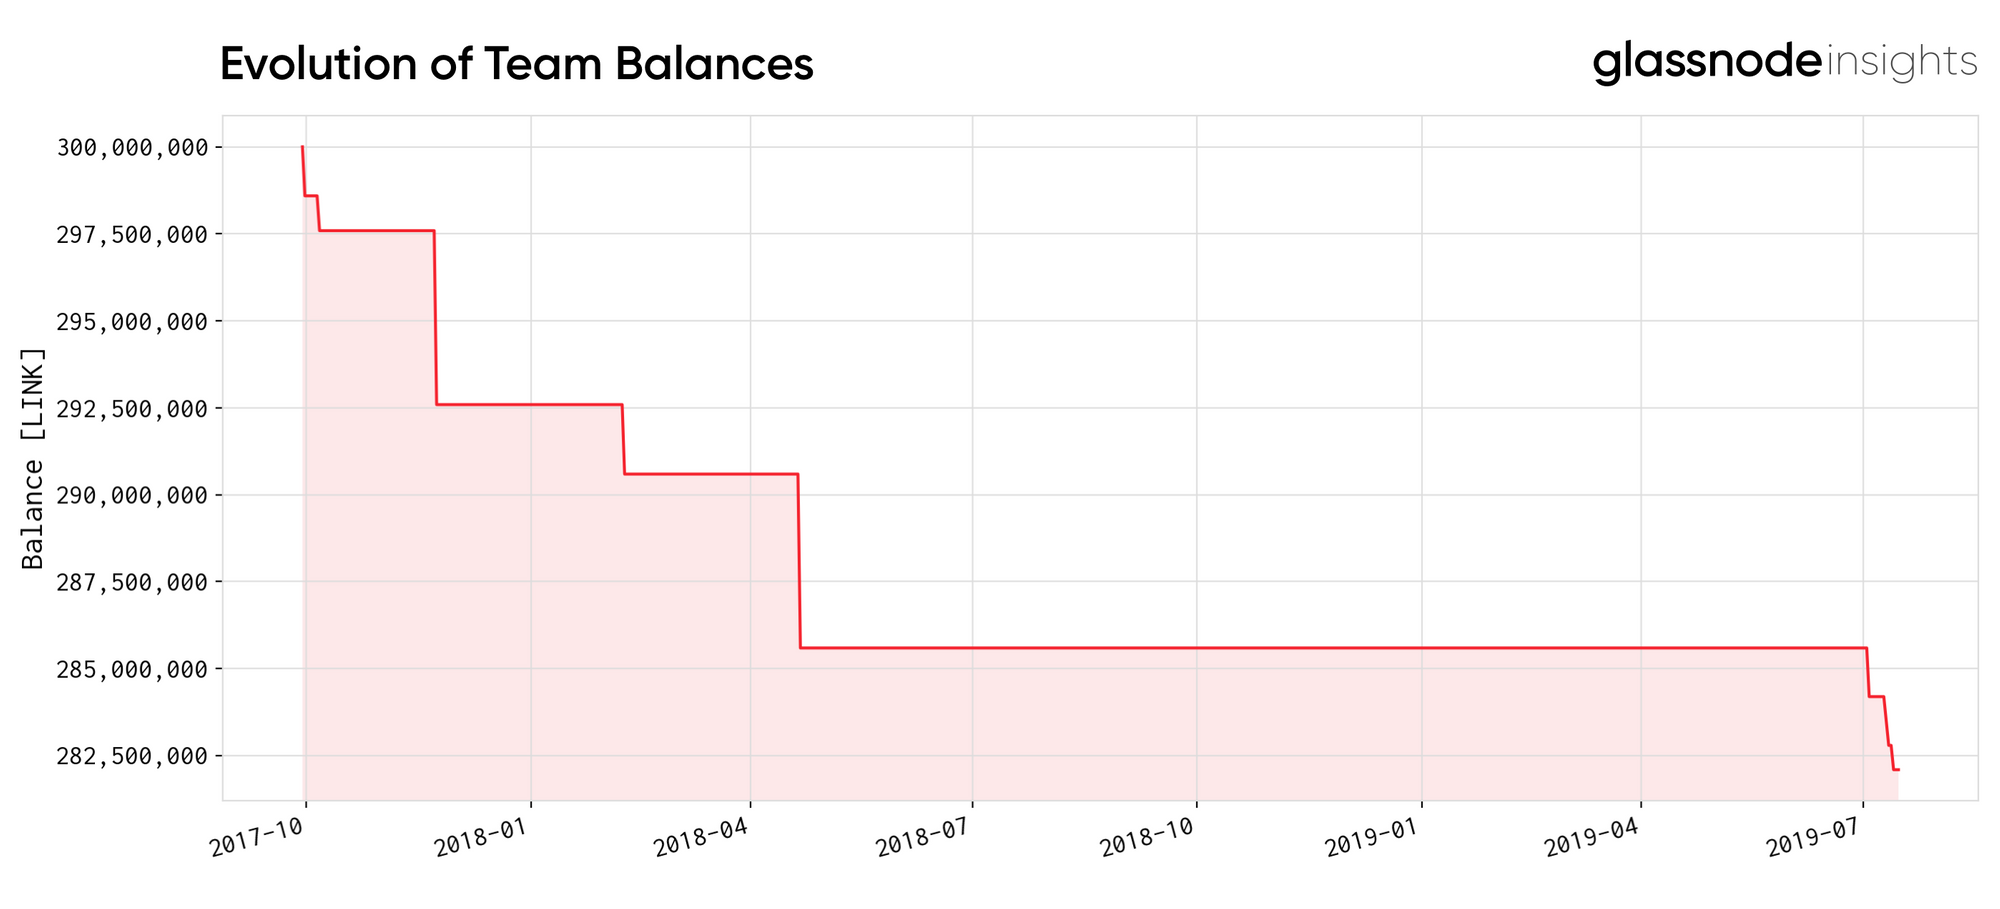
The Chainlink team moved a large portion of tokens throughout the end of 2017 and early 2018 from 0xf37c348b7d19b17b29cd5cfa64cfa48e2d6eb8db. Recently, in early July 2019, they started moving tokens from 0xdad22a85ef8310ef582b70e4051e543f3153e11f.
The first of these transactions happened just 2 days after LINK’s major increase in price, indicating that it’s not just investors that are capitalising on the token’s rise into the top 20. The team have yet to officially comment on these transactions.
(Note: there have been 2 additional 700,000 LINK transactions from this wallet since our snapshot at block 8,152,293. These are not counted in our analysis.)
| txn_hash | from_address | to_address | block_timestamp | value |
|---|---|---|---|---|
| 0x7c469179 | 0xdad22a85 | 0x1f9e26f1 | 2019-07-12 19:03:27 UTC | 700000.00 |
| 0xea3cbba8 | 0xdad22a85 | 0x1f9e26f1 | 2019-07-10 19:24:16 UTC | 700000.00 |
| 0x1eaff34b | 0xdad22a85 | 0x1f9e26f1 | 2019-07-09 00:06:32 UTC | 700000.00 |
| 0xfdc88932 | 0xdad22a85 | 0x1f9e26f1 | 2019-07-02 19:03:28 UTC | 700000.00 |
| 0x5467d81e | 0xdad22a85 | 0x1f9e26f1 | 2019-07-02 14:30:45 UTC | 700000.00 |
| 0xe6f31963 | 0xf37c348b | 0xc059a1ff | 2018-04-20 03:04:17 UTC | 5000000.00 |
| 0xa48762a0 | 0xf37c348b | 0xc059a1ff | 2018-02-07 18:11:59 UTC | 2000000.00 |
| 0x233ef078 | 0xf37c348b | 0xc059a1ff | 2017-11-22 01:52:07 UTC | 5000000.00 |
| 0xc7b192cb | 0xf37c348b | 0xc059a1ff | 2017-10-05 02:53:44 UTC | 1000000.00 |
| 0x9c848987 | 0xf37c348b | 0xb802cac8 | 2017-09-29 22:22:24 UTC | 255805.75 |
| 0x471d62c5 | 0xf37c348b | 0x41e36efa | 2017-09-29 22:09:10 UTC | 1153773 |
In total 17,909,579 LINK has moved from their original wallets. Of the 3,500,000 LINK sent by 0xdad22a85ef8310ef582b70e4051e543f3153e11f, an estimated 50-90% went into Binance within 4 hops of the initial transactions.
As specified in the token sale terms, these were allocated to the team to support the protocol’s development so this movement was likely the company liquidating a portion of their holdings to secure future funding. This correlates with a recent post from Sergey Nazarov, CEO of Chainlink, announcing that they’re growing their team significantly.
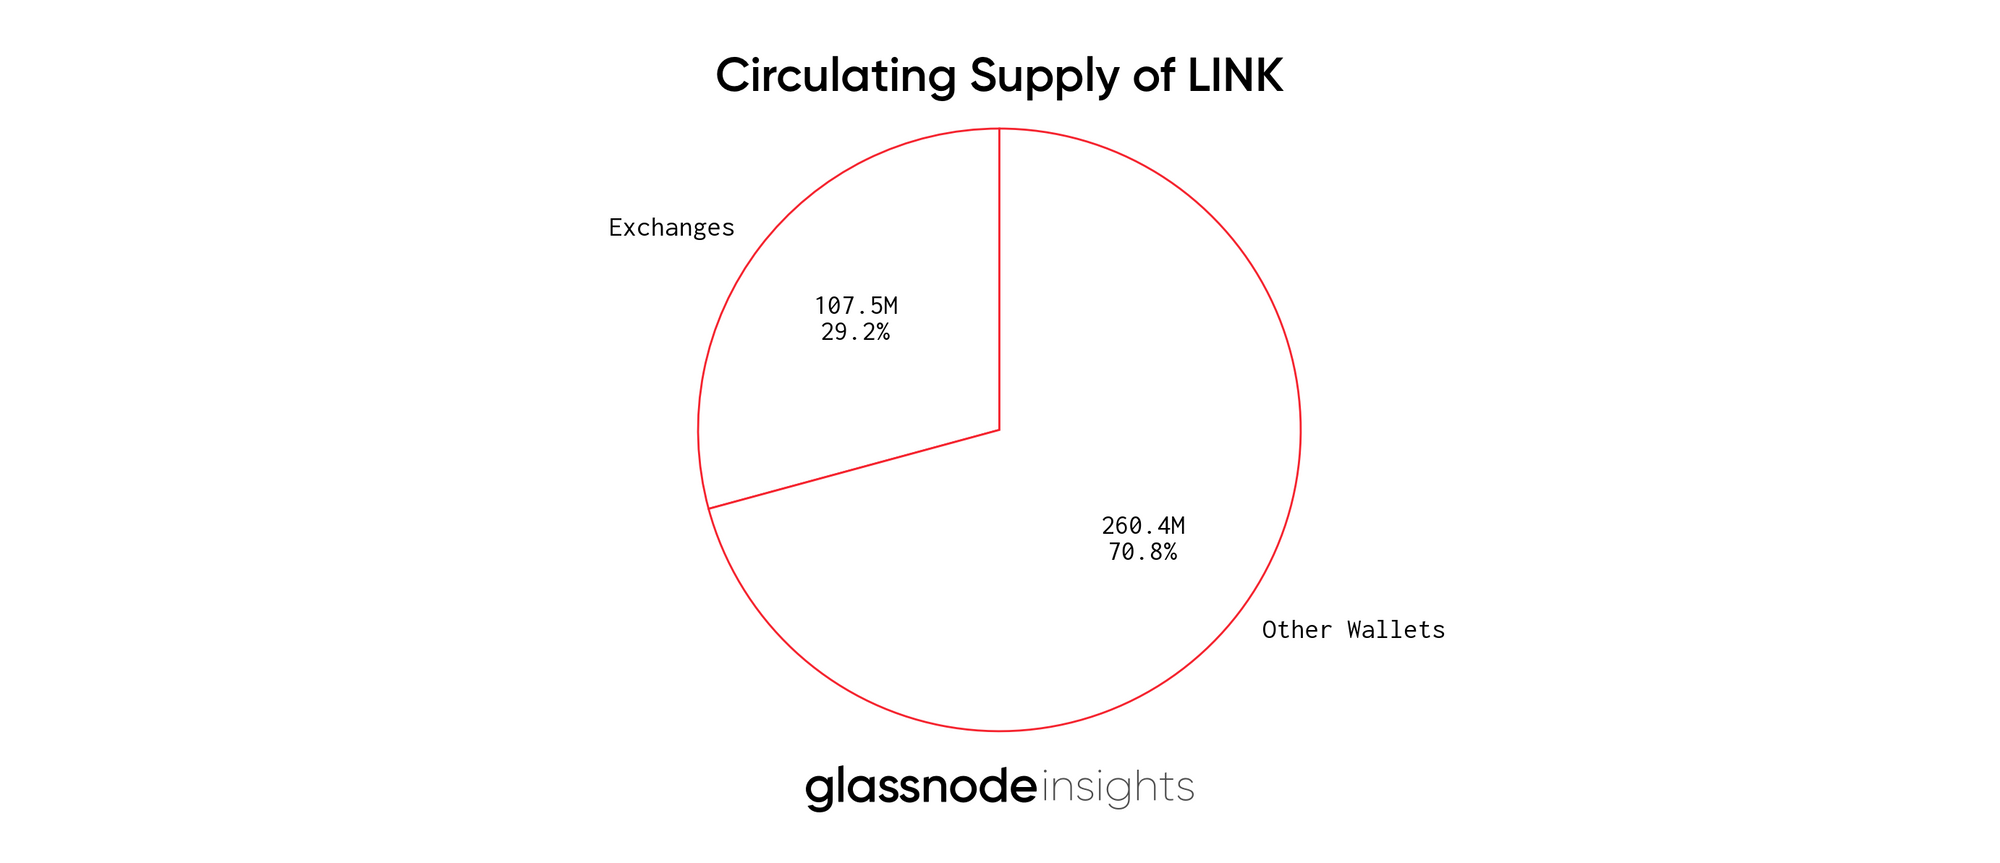
Circulating Supply
LINK’s circulating supply of 350,000,000, as reported by CoinMarketCap, only counts the tokens sold to the public in the ICO. After taking the team sell off into account, the actual circulating supply is closer to ~367,909,600.
The below graph shows the distribution of the recalculated circulating supply.
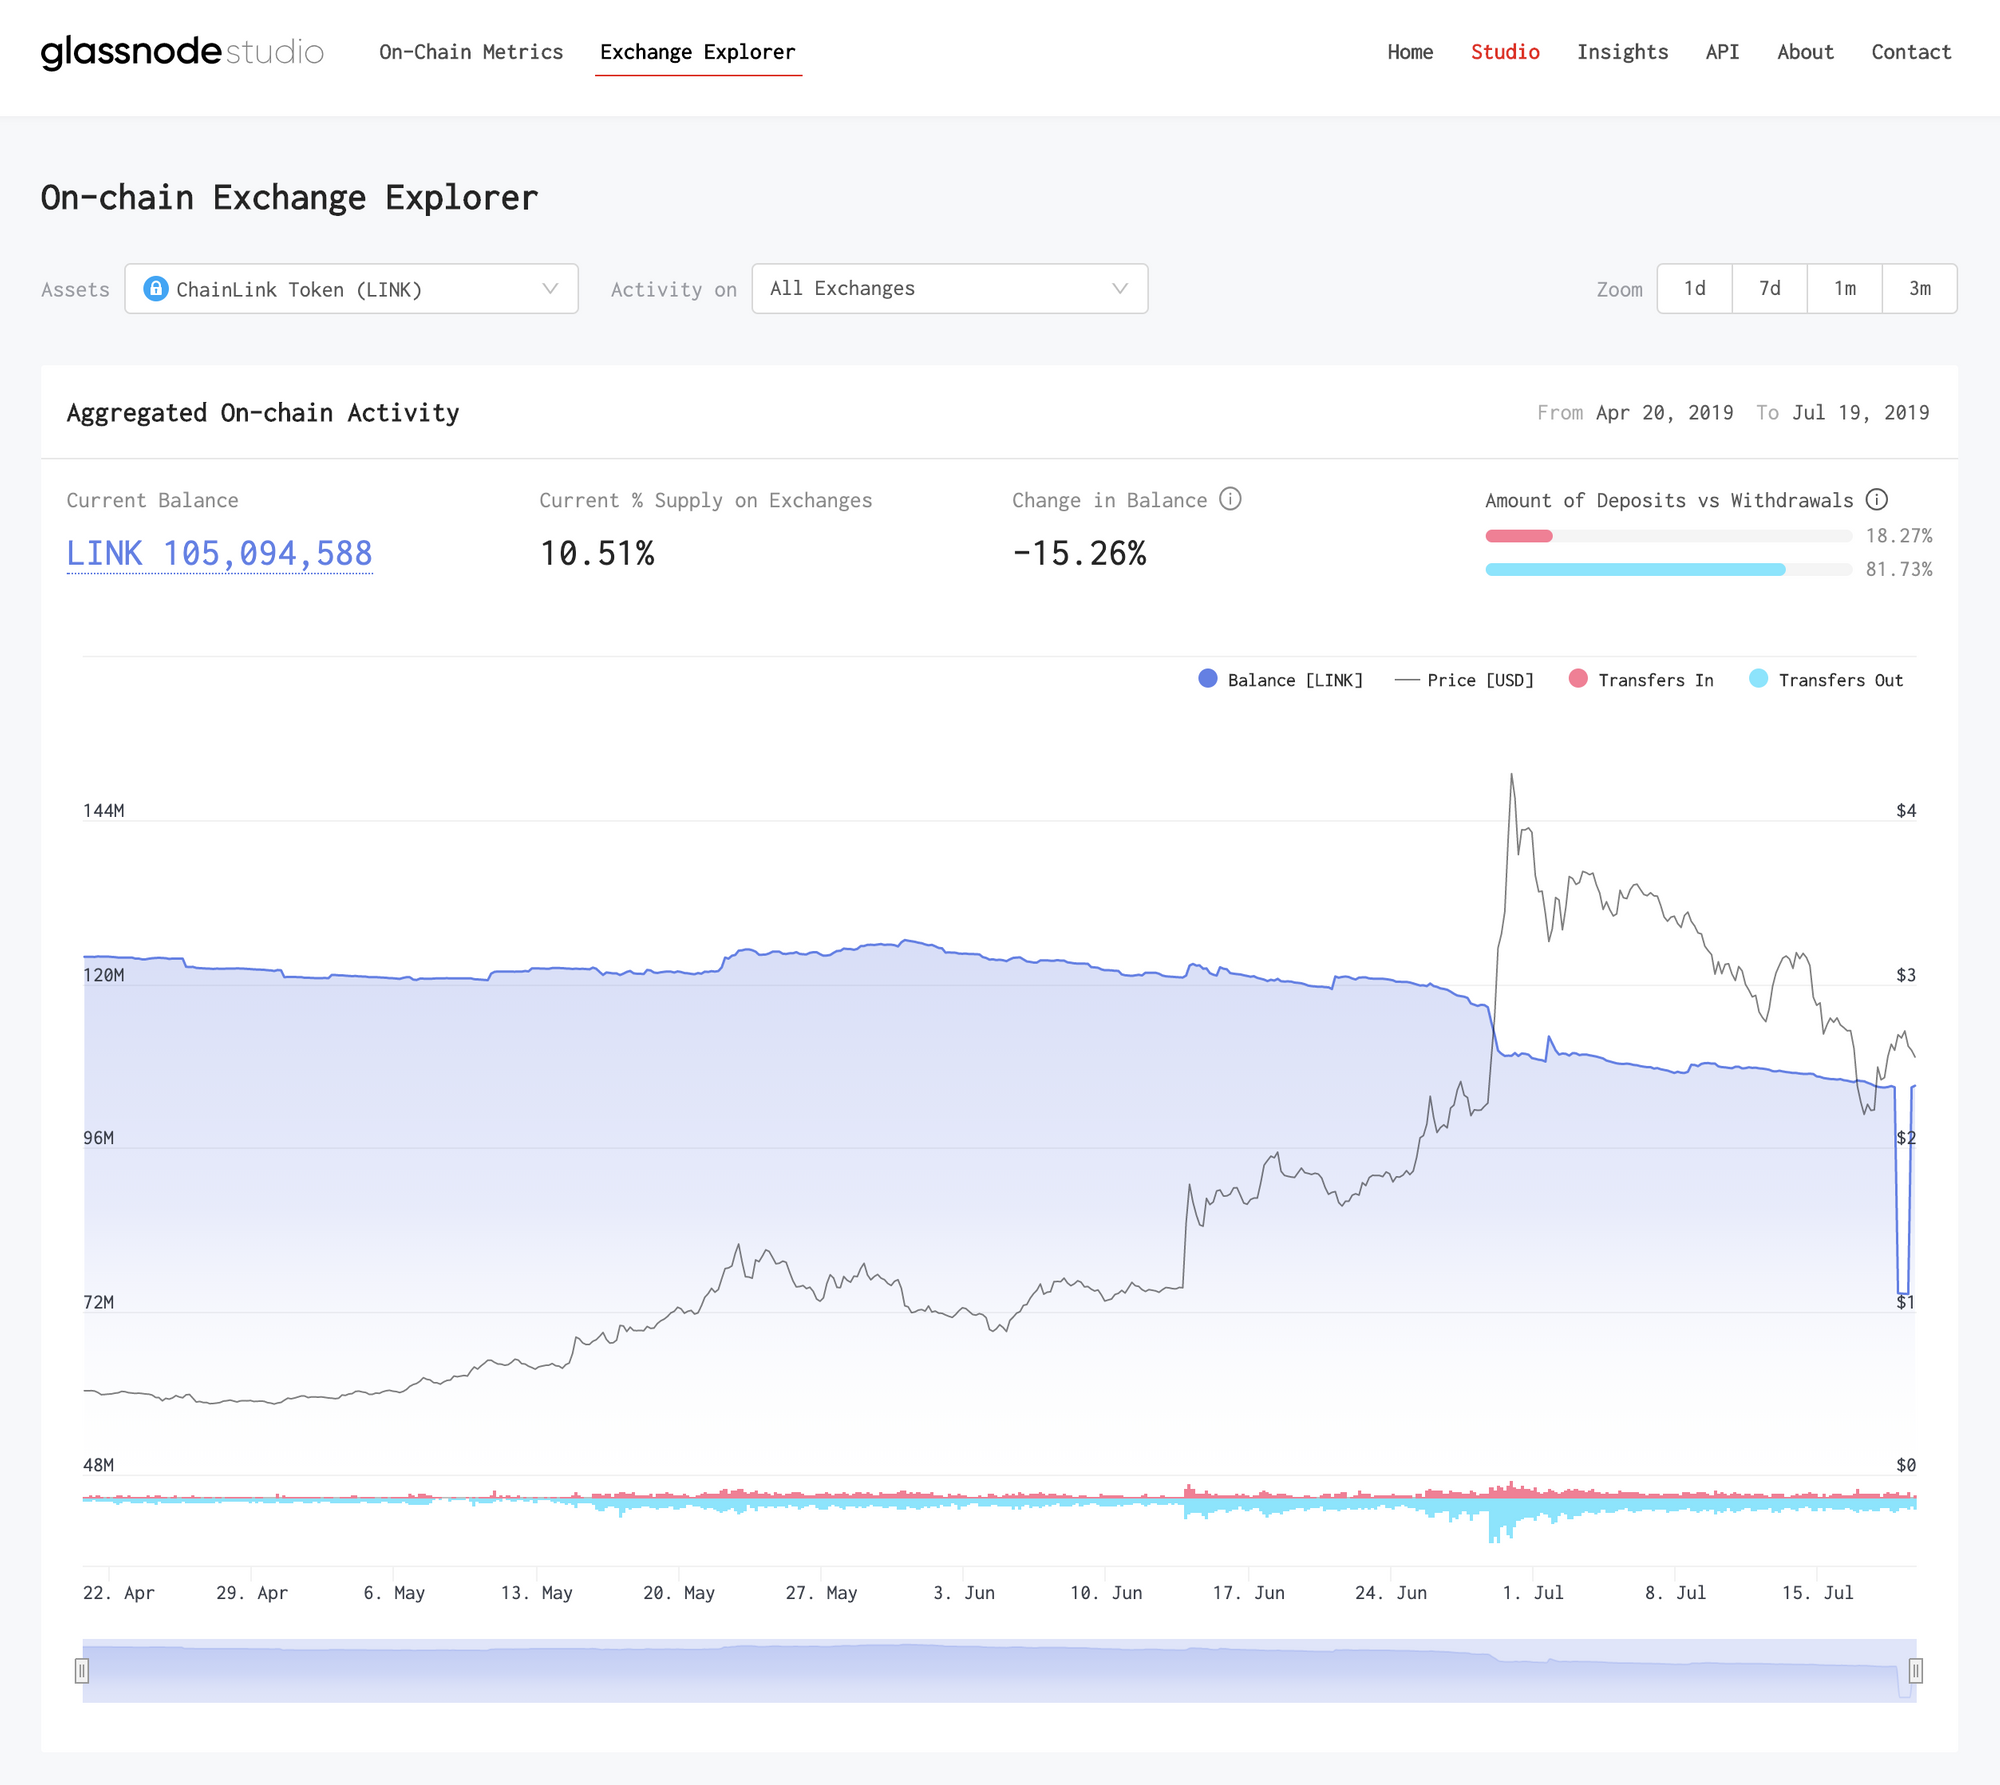
Exchanges
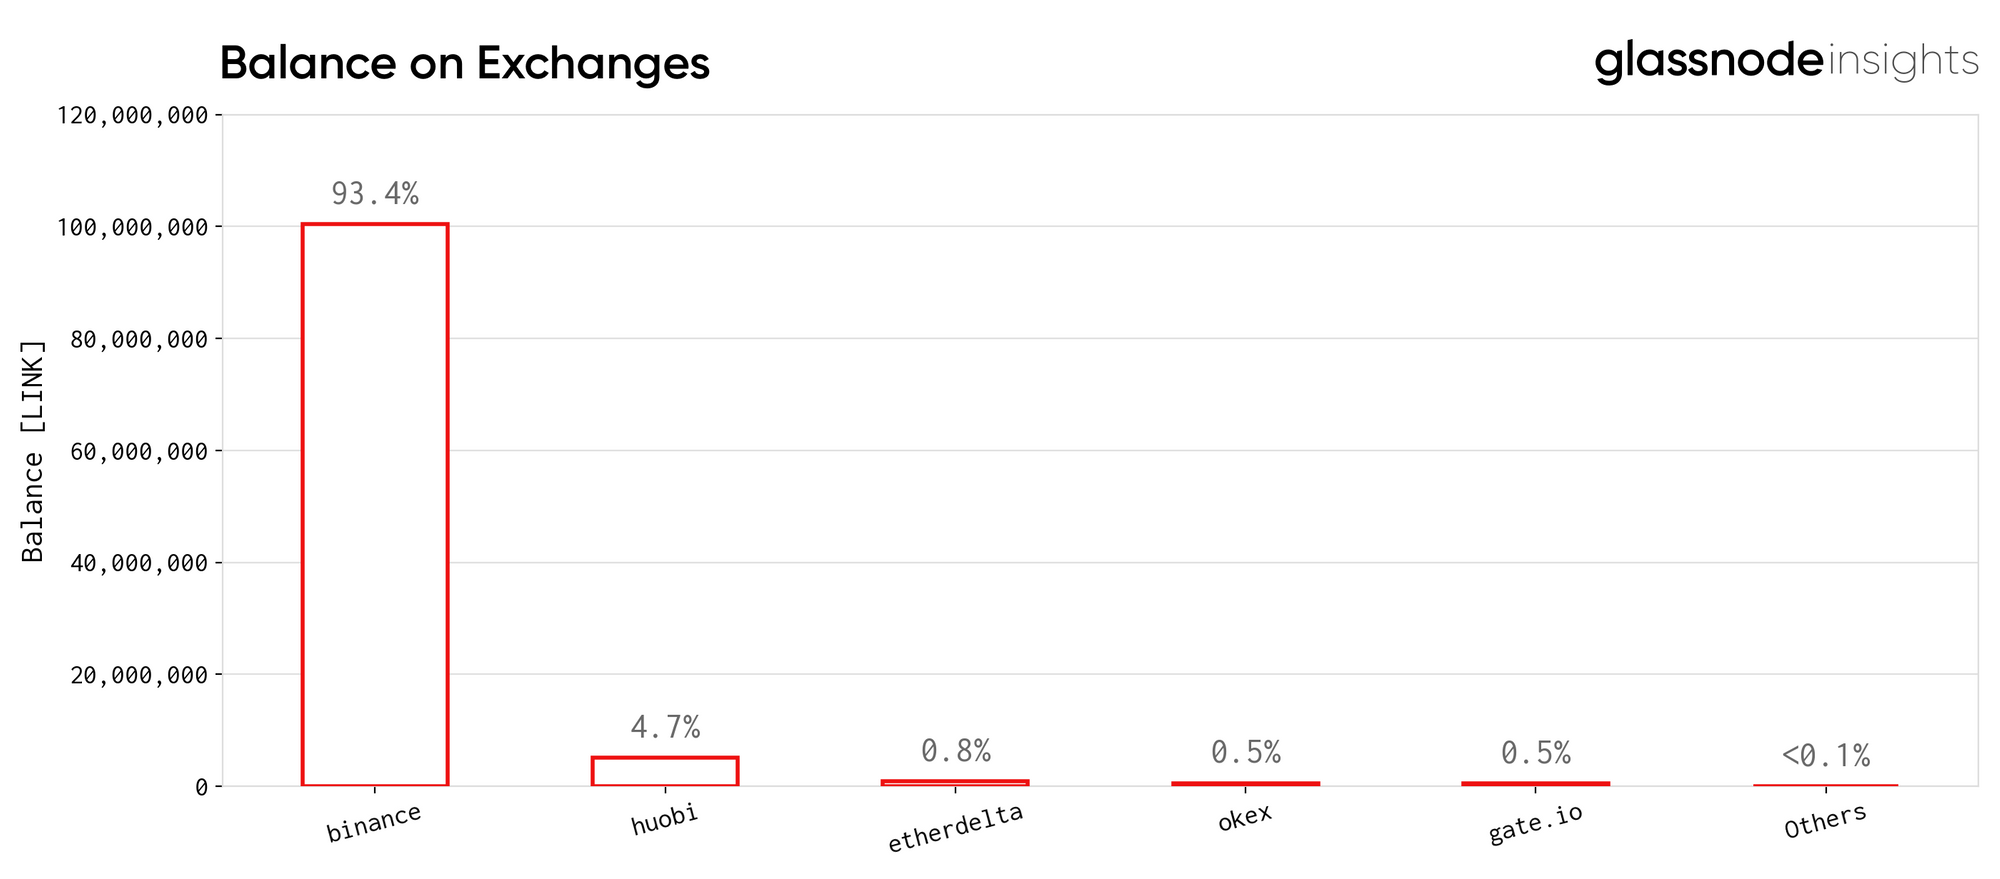
Compared to other ERC20 tokens on the market, LINK has a comparatively low number of tokens stored in exchange wallets at only 10.7% of the total supply and 29.2% of the circulating supply.
Across the different exchanges, Binance has the largest market share by a considerable margin with 93.4% of tokens being stored in their wallets. This is unsurprising given how high LINK’s daily trading volume is on the exchange.
Note: Coinbase wallet flags are currently unknown and are omitted from this analysis. Given the recent listing and increasing trading volume happening on the platform, Binance’s market share is likely less than shown.
Exchange balances are based on Glassnode’s internal address flags database. We’ve built an interactive tool that monitors on-chain activity of ETH and ERC20 on exchanges over time. Visit the Glassnode Studio to explore LINK’s exchange activity.
Token Holder Distribution
In order to get the best possible picture on how LINK funds are distributed across participants in the network, in all subsequent analyses we use the recalculated circulating supply and discard addresses belonging to the team and exchanges.
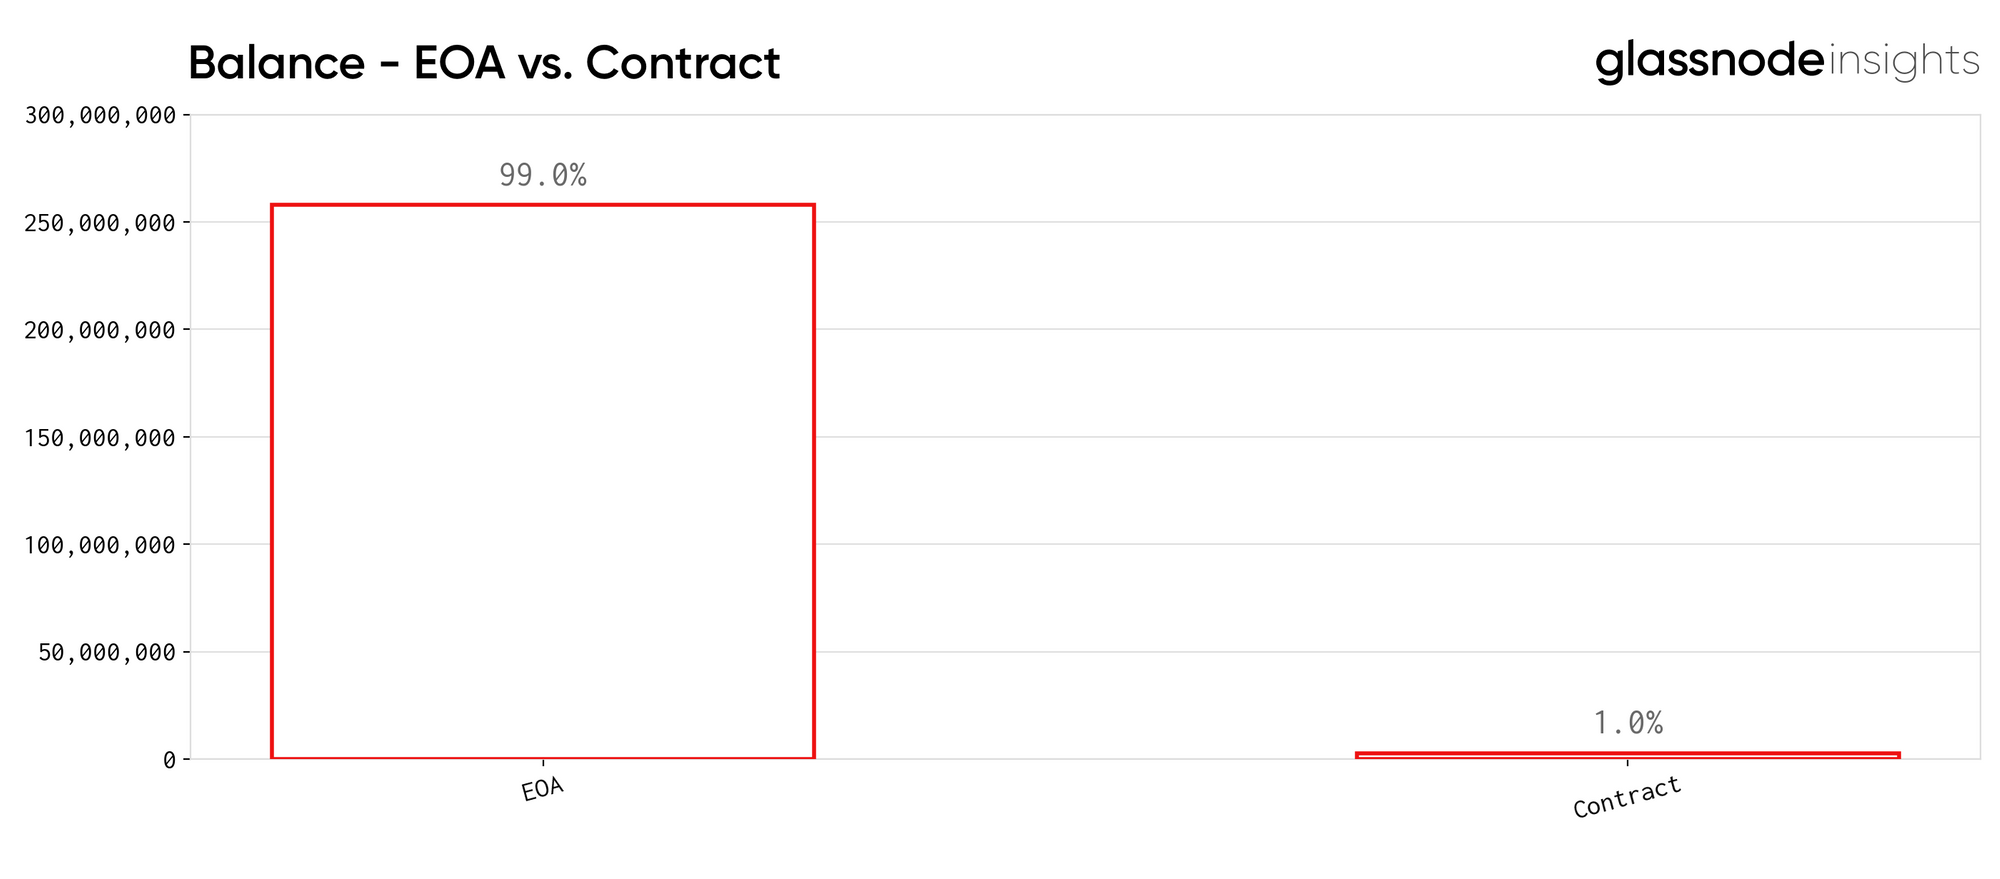
EOA vs. Contracts
As shown in the chart below, LINK is predominantly held by externally owned accounts. When the Chainlink platform becomes fully functional later this year, the utility value of the LINK token will become realisable and we should see this disparity reduce as tokens are locked in contracts as investors seek passive returns through staking.
EOA Distribution
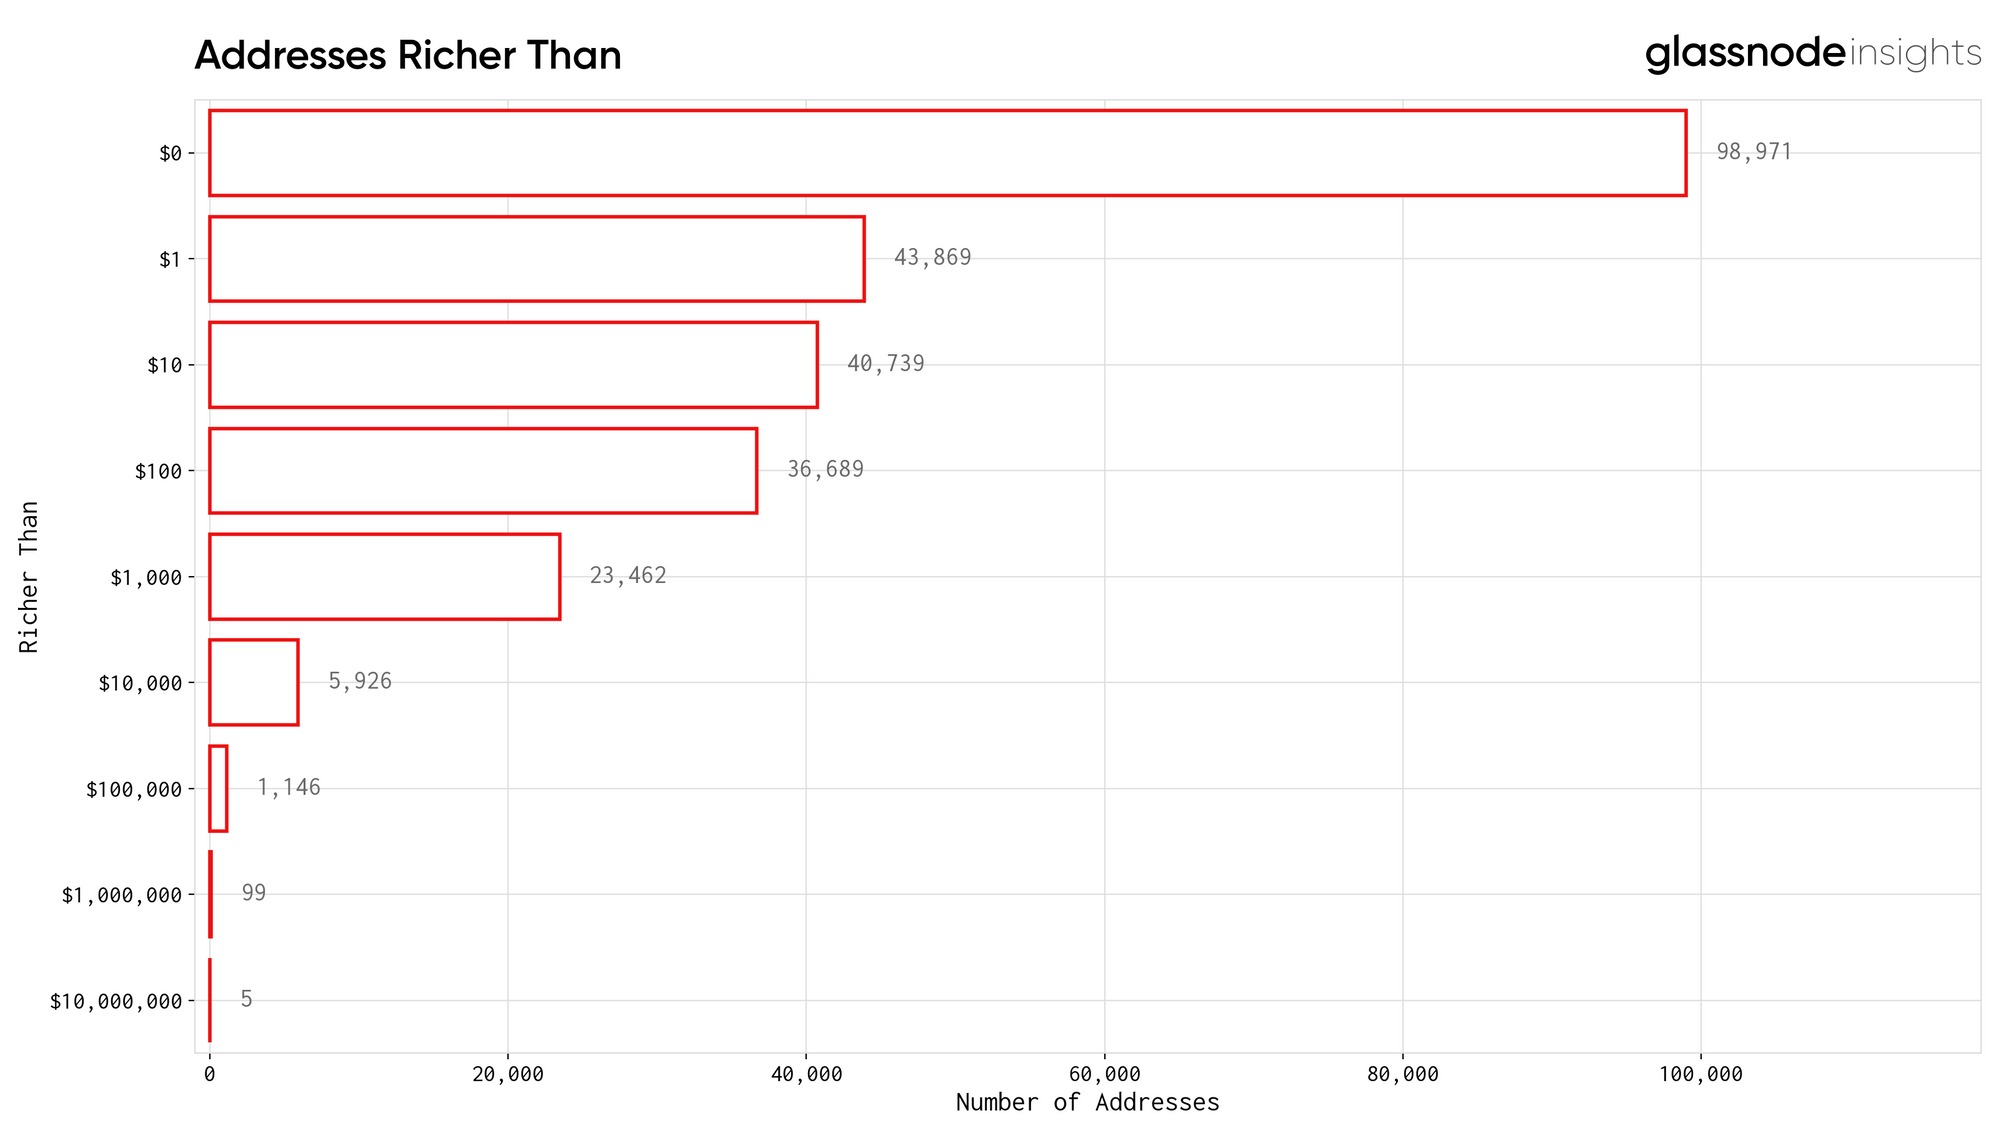
In the following analyses we only consider non-contract (externally owned) account addresses, in order to get the most accurate distribution analysis of token holders.
First, we looked at the number of addresses richer than a certain value. The thresholds are in USD and we used a price of $3.02 (approximate LINK price on July 14th according to CoinMarketCap) to compute USD balances.
Next, we analysed the number of addresses within certain balance ranges. As shown in the graph below, the vast majority of addresses holding LINK (60.24%) hold under 10 tokens.
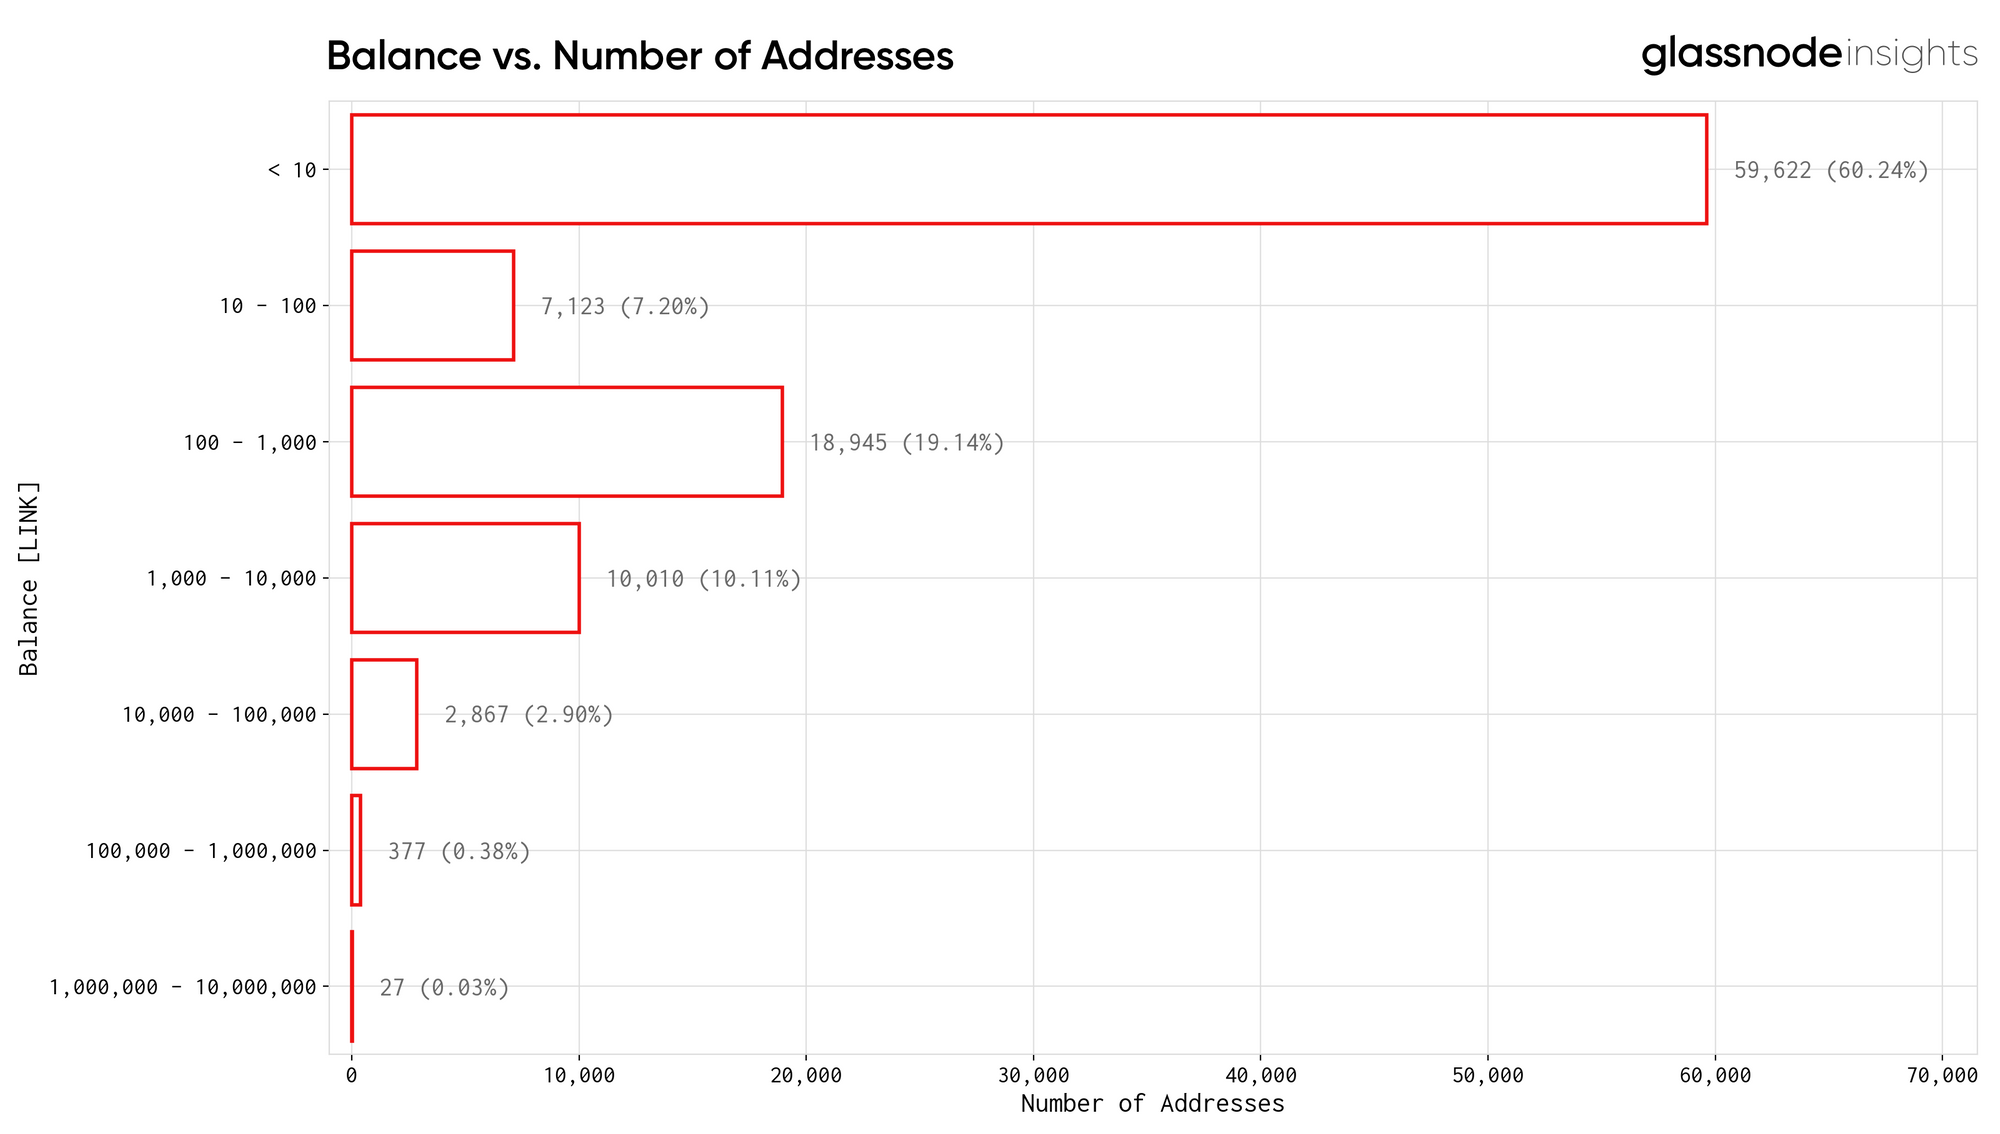
However, this band does not represent a large portion of the circulating supply. To illustrate this, we looked at the total amount of LINK held by addresses within particular balance ranges:
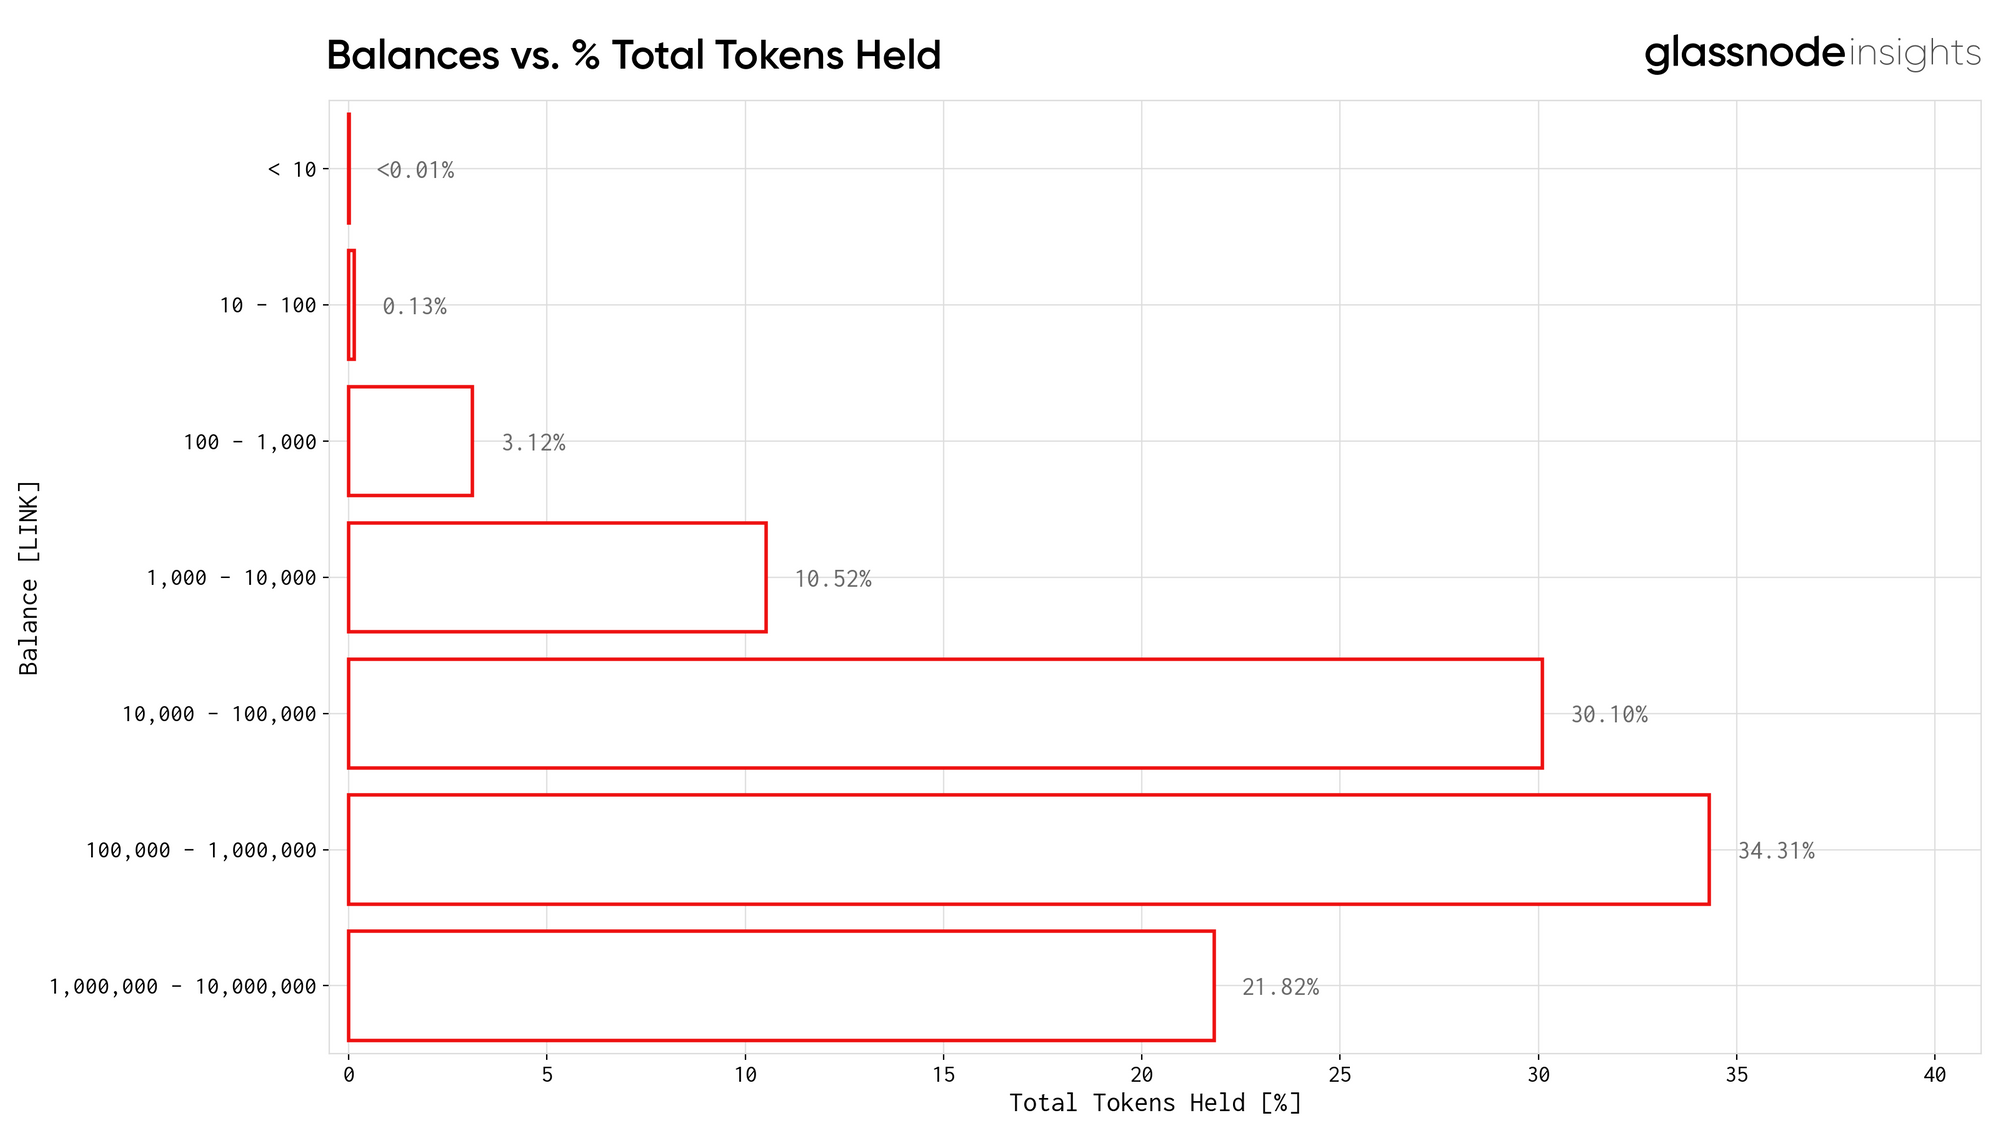
56% of LINK tokens (sum of the two largest bars in the above graph) are held only by the top 0.41% of addresses. 3.25% of the supply is controlled by market participants with an investment below $3,020 USD.
To visualise this wealth distribution, the following graph illustrates the relationship between number of addresses and the amount of tokens held:
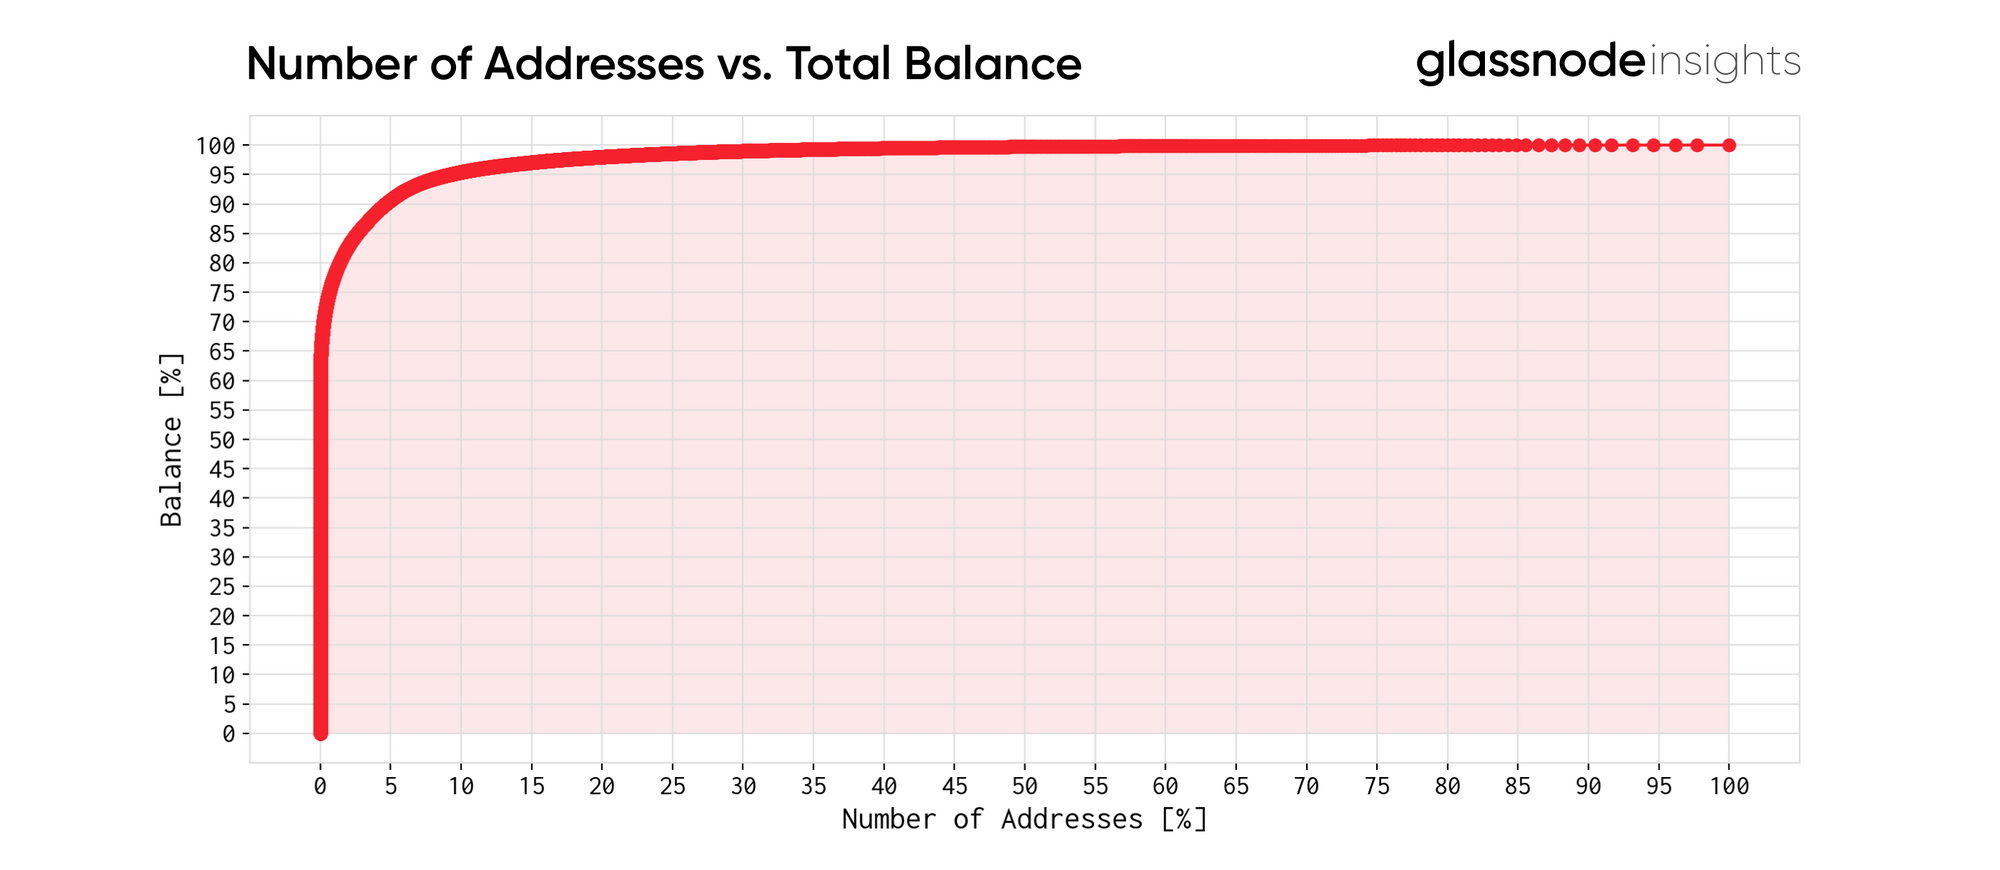
This plot reveals the wealth concentration in the LINK ecosystem, with the curve increasing rapidly to almost 70% of the supply and quickly saturating at around 25% of addresses.
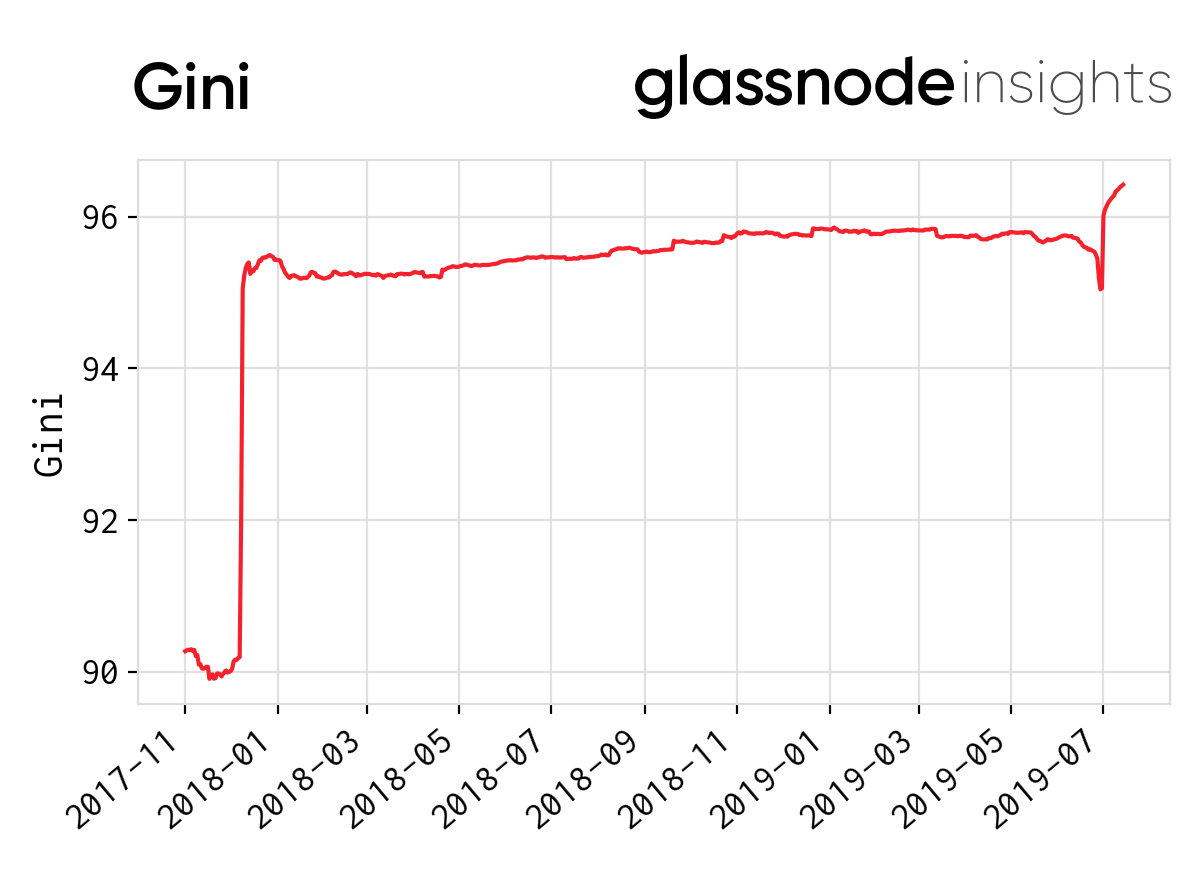
The resulting Gini coefficient of this distribution is ~0.97.
This has been fairly consistent overtime; however, with the release of Chainlink’s mainnet, subsequent major partnerships and LINK’s listing on Coinbase, this has seen a sharp spike upwards, suggesting further accumulation by large market participants.
To sum up, our EOA distribution analysis shows that:
- The top 0.01% of addresses hold 13.69% of LINK.
- The top 0.1% of addresses hold 36.93% of LINK.
- The top 1% of addresses hold 69.68% of LINK.
- The top 5% of addresses hold 90.65% of LINK.
It should be noted that this is not an uncommon distribution, we’ve observed that many ERC20 tokens are very similar when looking at network participant holdings. For example, in our previous analysis, we saw that 94% of BAT was held by the top 5% of addresses.
LINK Distribution: What is the Trend?
After taking a look at the current state of LINK’s token distribution, we set out to investigate of this distribution evolved over time and to explore if there are trends evident in the data.
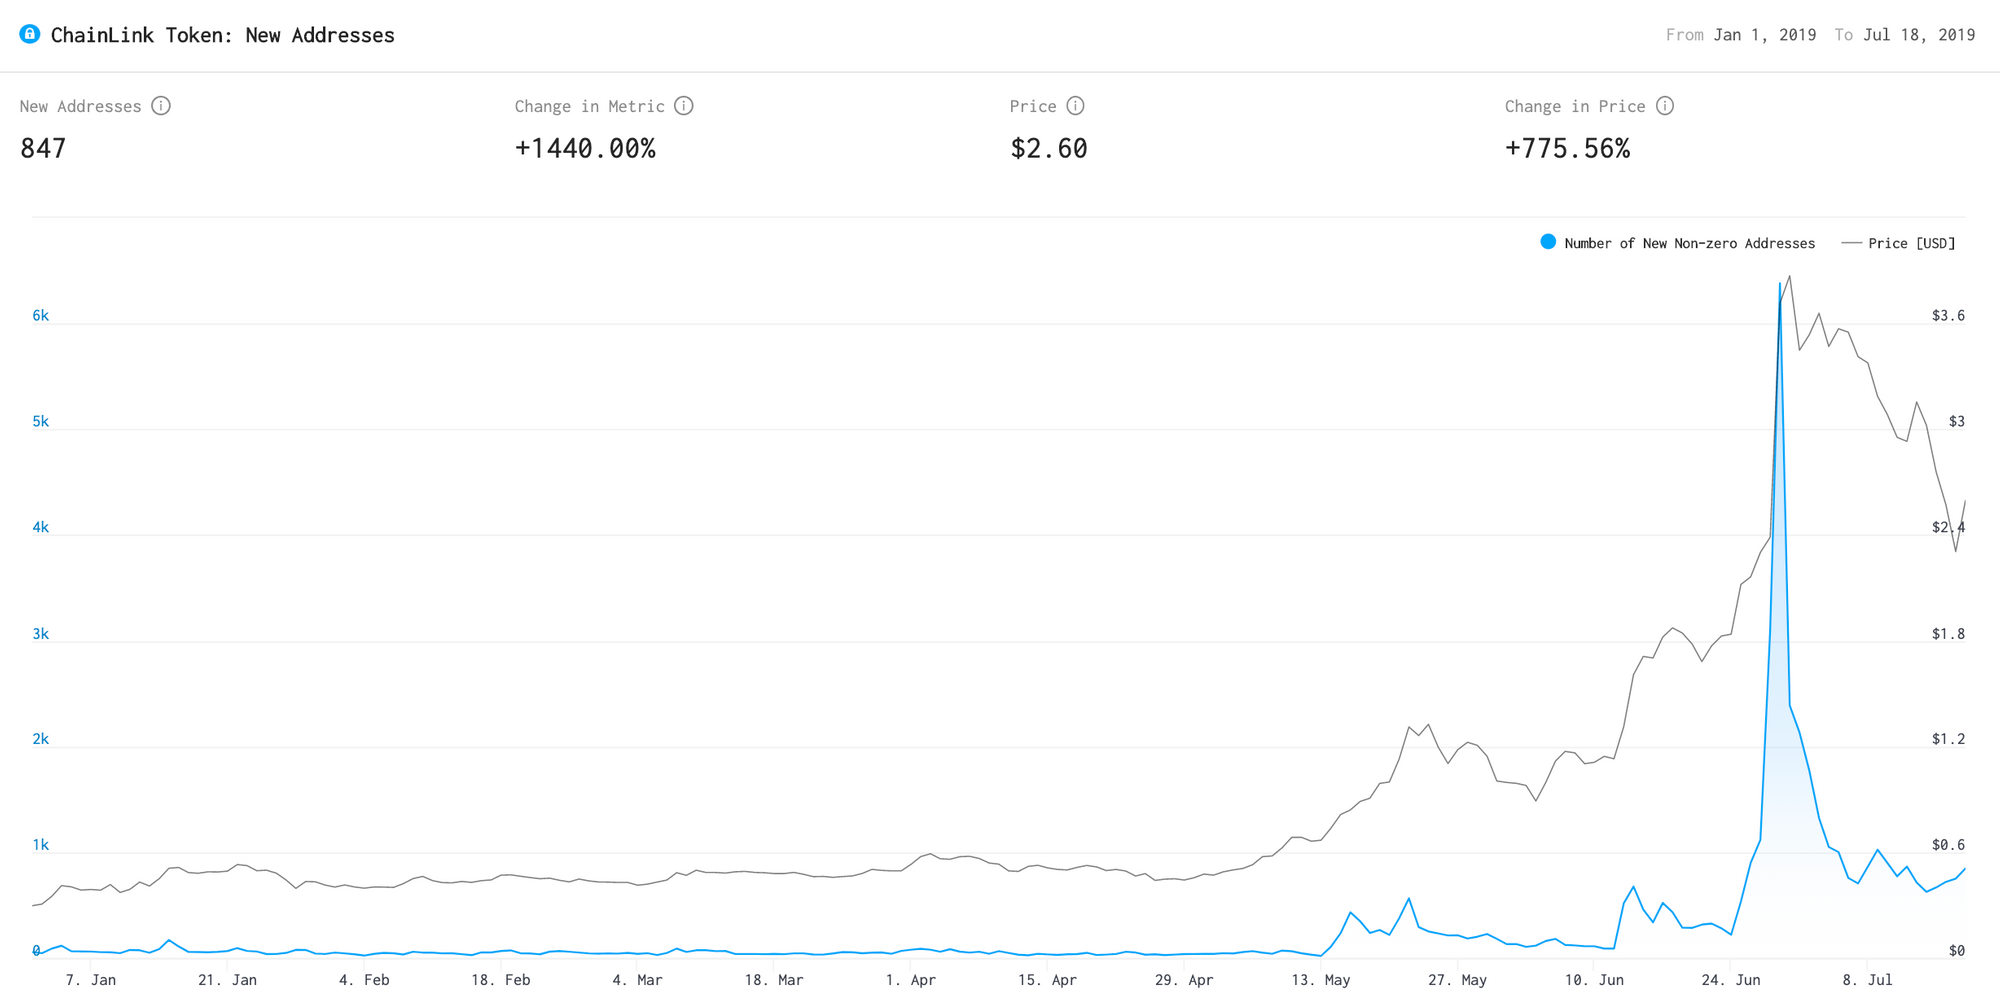
The below graph shows the number of addresses with at least 1 LINK over time.
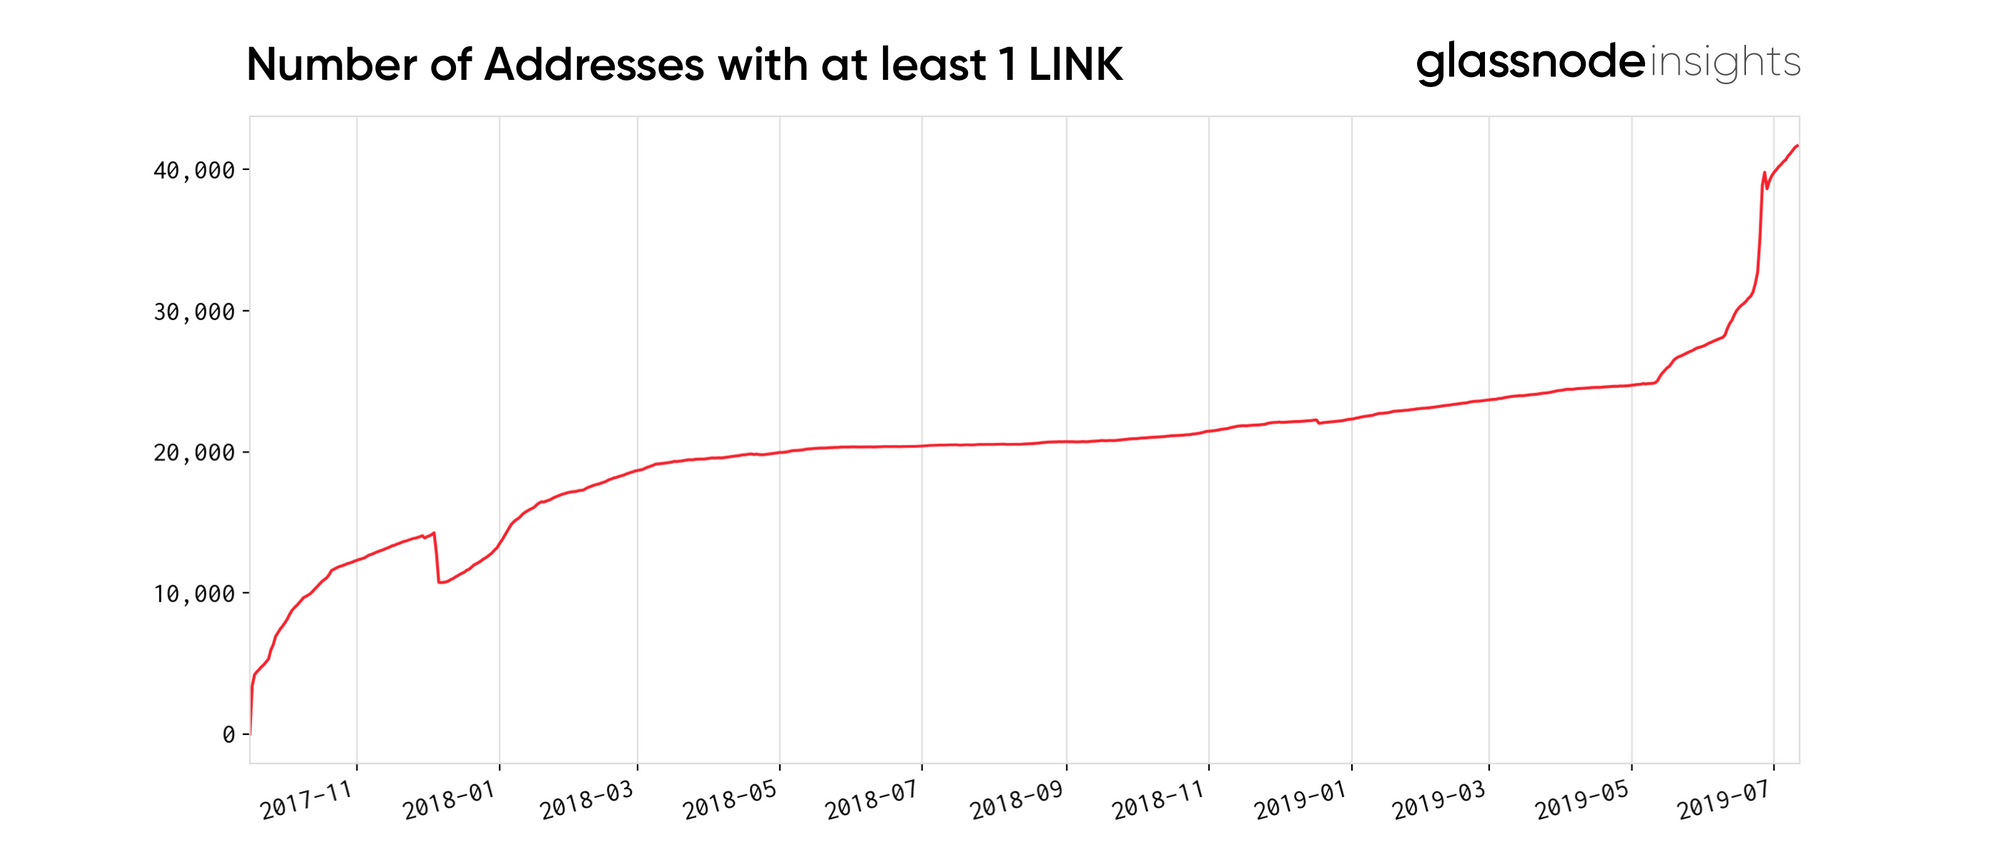
We can see clearly that the growth of holders was slow but steady until suddenly the trend breaks in the middle of May 2019. This is when Chainlink announced that their mainnet would go live on the 30th. Between the announcement on the 14th of May and our analysis snapshot, the number of addresses holding at least 1 LINK went from 24,891 to 41,681, an increase of 67.45%. During this time period, there were a number of other events that probably contributed to this increase of holders.
While not directly related to trends over time, it is interesting to note that out of the 98,971 addresses that hold LINK, only 41,681 contain at least 1.
The following chart shows the evolution of different balance buckets over time:
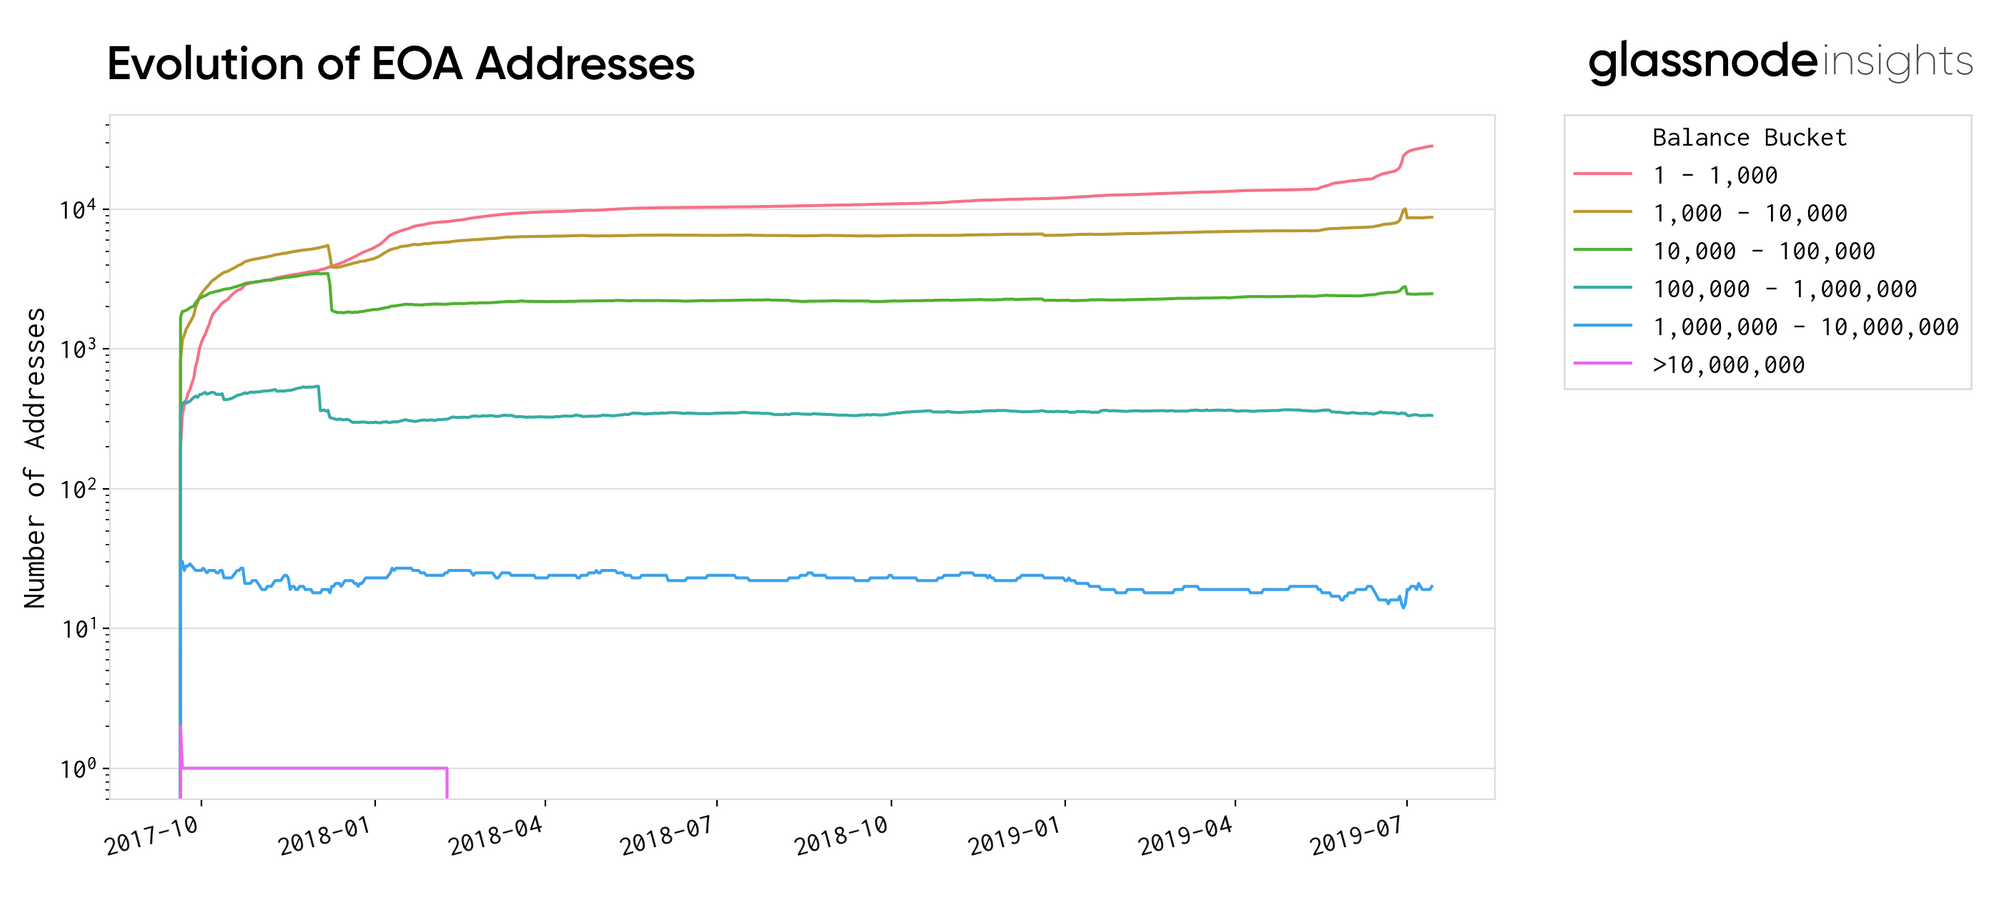
Similarly to the previous graph, the horizontal trend was broken in mid May. The lowest bucket increased considerably and kept that growth as time went on, indicating adoption of the Chainlink network by new players. This is further supported by the recent significant increase in newly created addresses. Even if we discount the large spike (likely due to Coinbase's deposit procedure), the number of daily new addresses has been increasing significantly since May,

- Follow us and reach out on Twitter
- For on–chain metrics and activity graphs, visit Glassnode Studio
- For automated alerts on core on–chain metrics and activity on exchanges, visit our Glassnode Alerts Twitter
Disclaimer: This report does not provide any investment advice. All data is provided for information purposes only. No investment decision shall be based on the information provided here and you are solely responsible for your own investment decisions.