BTC Market Pulse: Week 9
Bitcoin pulled back to $65k, bounced to $68k, and then slid to $64k, keeping price action reactive and range-bound.


Read the full report in PDF format.
Overview
Momentum has improved, with RSI lifting off recent lows, but the market remains short of a clear risk-on shift and participation still looks thin.
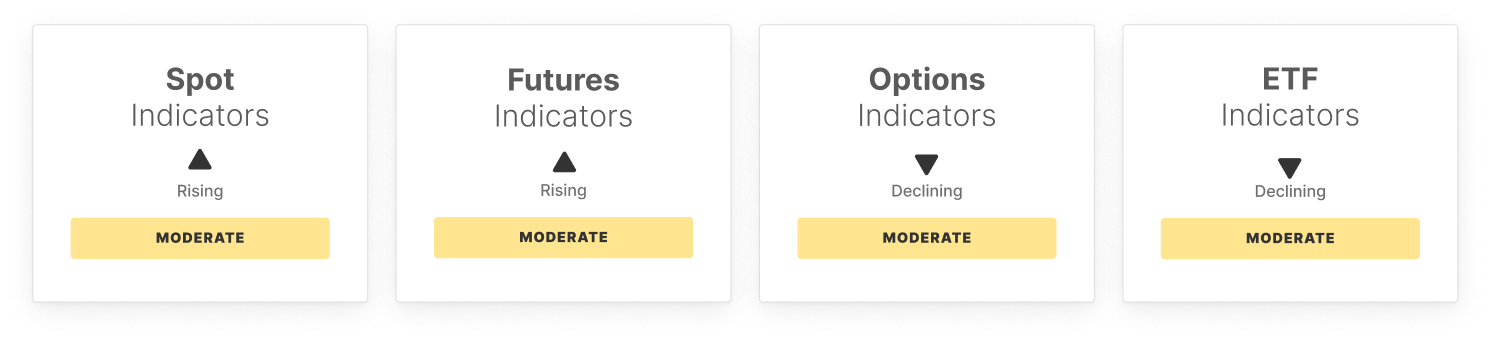
Spot conditions show early signs of stabilization, with aggressive sell pressure easing as Spot CVD improves. That said, spot trading volume has cooled materially, leaving recent moves less supported and more prone to choppy consolidation. US spot ETF outflows have moderated, but flows remain negative and ETF trading volume has fallen toward the lower end of its range, highlighting continued investor caution.
Derivatives positioning is mixed but still broadly defensive. Futures open interest has drifted lower, pointing to mild deleveraging, while long-side funding has jumped, signalling a pickup in demand for leveraged long exposure. Perpetual flows remain net negative but are improving at the margin, suggesting sell pressure is moderating rather than flipping decisively to accumulation.
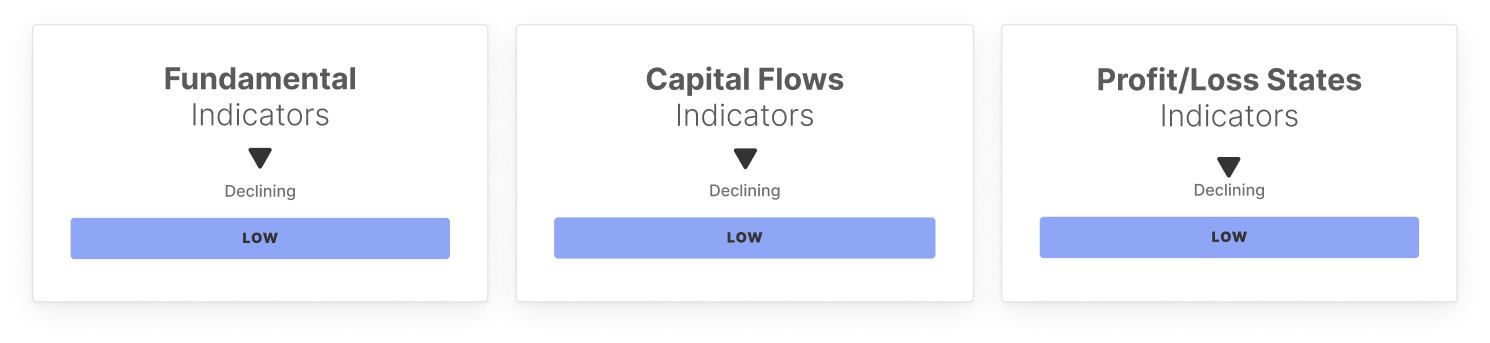
On-chain activity remains subdued. Active addresses and fee volume sit below their low bands, and transfer volume, while improving, is still constrained, consistent with a quieter market phase. Capital flows remain negative as realized cap continues to contract, while profitability is broadly stable and unrealized losses still dominate, reinforcing a cautious backdrop where conviction remains limited.
Overall, conditions remain defensive across spot, derivatives, ETFs, and on-chain indicators. Sell pressure is easing at the margin and momentum is improving, but participation and capital flows remain weak, leaving the market vulnerable to reactive swings. A more durable recovery likely requires renewed spot demand and a clearer improvement in on-chain engagement.
Off-Chain Indicators
On-Chain Indicators
🔗 Access the full report in PDF

- Follow us and reach out on X
- Join our Telegram channel
- For on-chain metrics, dashboards, and alerts, visit Glassnode Studio
Disclaimer: This report does not provide any investment advice. All data is provided for information and educational purposes only. No investment decision shall be based on the information provided here and you are solely responsible for your own investment decisions.
Exchange balances presented are derived from Glassnode’s comprehensive database of address labels, which are amassed through both officially published exchange information and proprietary clustering algorithms. While we strive to ensure the utmost accuracy in representing exchange balances, it is important to note that these figures might not always encapsulate the entirety of an exchange’s reserves, particularly when exchanges refrain from disclosing their official addresses. We urge users to exercise caution and discretion when utilizing these metrics. Glassnode shall not be held responsible for any discrepancies or potential inaccuracies.
Please read our Transparency Notice when using exchange data.