BTC Market Pulse: Week 32
Bitcoin’s rally pauses as momentum cools across spot, futures, options, and ETF markets. With liquidity thinning and risk appetite moderating, signs of seller exhaustion emerge - yet fragile market structure leaves BTC vulnerable to further downside.


Overview
With the market retesting the low-liquidity range below the $114k threshold level, the euphoria phase is on pause as Bitcoin undergoes a period of recalibration. Signals across market sectors point to cooling momentum, cautious positioning, and a moderation in risk appetite.
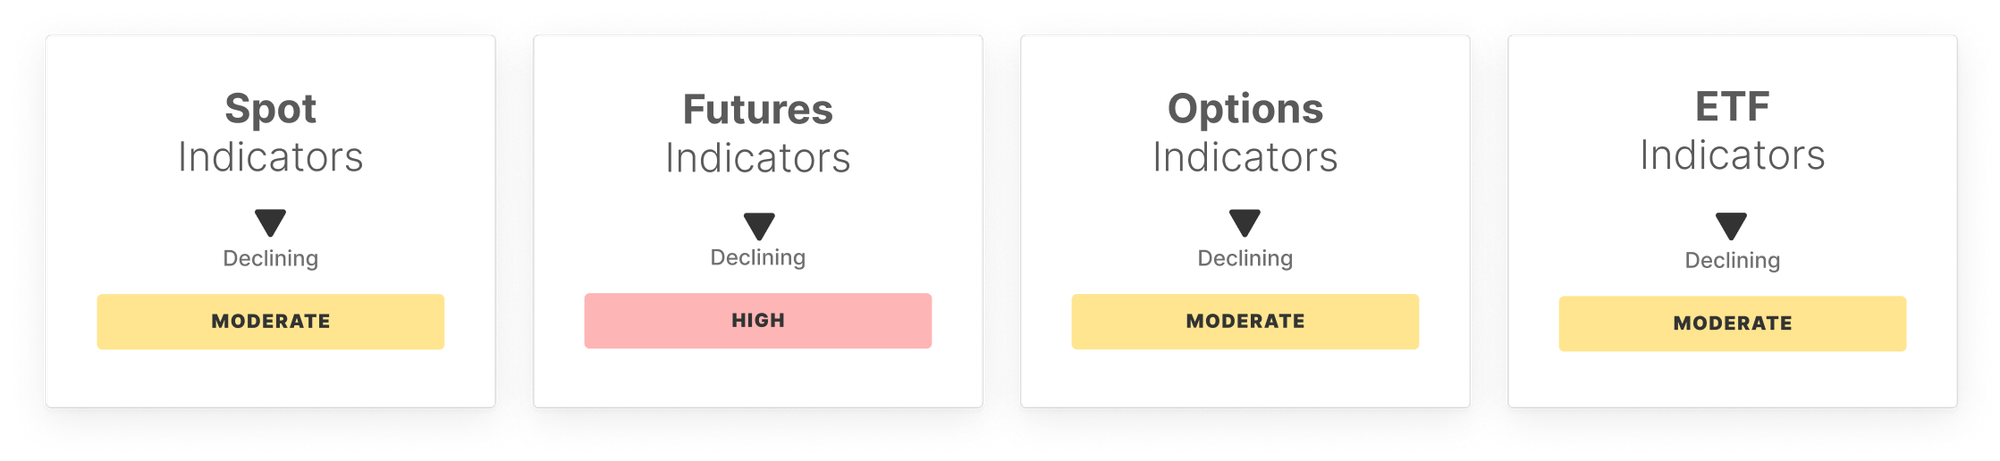
In the Spot Market, conditions weakened notably as the RSI fell from 47.4 to 35.8, dipping below its low band and signaling oversold territory. Spot CVD deteriorated sharply from -$107.1M to -$220.0M, reflecting intensifying sell-side pressure. Spot volume also declined from $8.4B to $7.5B, suggesting softer participation and liquidity during the retest of support.
The Futures Market saw Open Interest ease from $45.6B to $44.9B, hinting at mild position unwinding. Long-side funding dropped 33% to $3.1M, marking a pullback in leveraged bullish demand. Perpetual CVD fell from -$1.2B to -$1.8B, deep below its low band, underscoring aggressive distribution and forced disengagement among traders.
In the Options Market, Open Interest contracted 8.4% to $39.8B, reflecting reduced speculative activity. The volatility spread narrowed from 23.84% to 16.26%, showing less risk being priced in. However, 25 Delta Skew surged above its high band to 5.51%, signaling heightened demand for downside protection and rising hedging sentiment.
The ETF Market saw net inflows drop 24.9% to $269.4M, well below the low band, indicating weak institutional demand. Trading volume rose 9.9% to $19.8B, suggesting a responsive but cautious environment. ETF MVRV eased from 2.4 to 2.3, showing slightly lower profitability but ongoing unrealized gains.
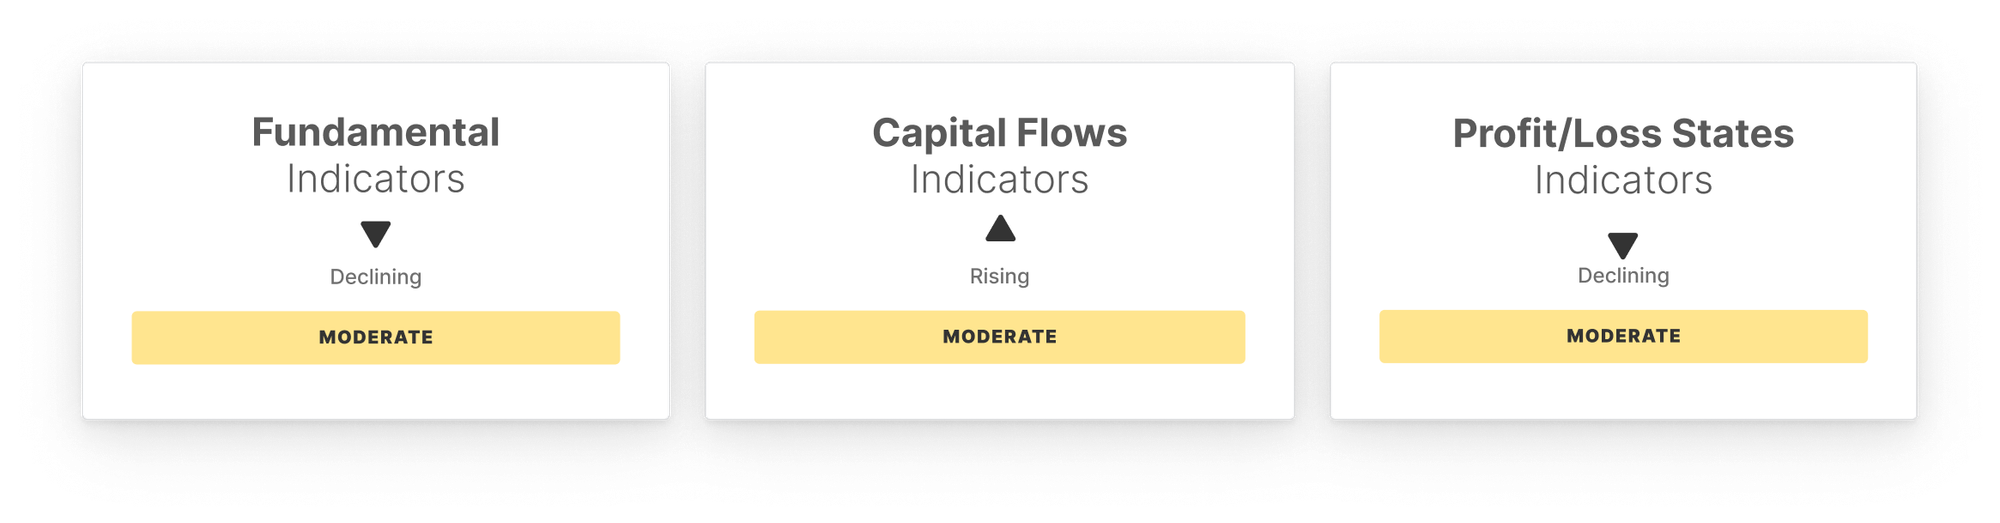
On-chain fundamentals were mixed: active addresses rose 3.6% to 729k, while transfer volume dropped 13.9% to $9.4B and fees declined 14.4% to $483.2K, signaling quieter network activity. Realized Cap Change stayed elevated at 6.3%, reflecting strong but cooling capital inflows.
Capital flows remained steady with the STH/LTH ratio at 17.3% and Hot Capital Share at 36.0%, showing balanced liquidity. Profitability metrics cooled as Percent Supply in Profit fell to 93.6%, NUPL dropped to 8.6%, and Realized P/L Ratio contracted to 1.9, reflecting more cautious sentiment.
In sum, the market has shifted from euphoria to reassessment, with oversold conditions and seller exhaustion hinting at potential for a bounce. However, fragility is growing, and the structure remains vulnerable to external negative catalysts or delayed demand revival.
Off-Chain Indicators
On-Chain Indicators

- Follow us and reach out on X
- Join our Telegram channel
- For on-chain metrics, dashboards, and alerts, visit Glassnode Studio
Disclaimer: This report does not provide any investment advice. All data is provided for information and educational purposes only. No investment decision shall be based on the information provided here and you are solely responsible for your own investment decisions.
Exchange balances presented are derived from Glassnode’s comprehensive database of address labels, which are amassed through both officially published exchange information and proprietary clustering algorithms. While we strive to ensure the utmost accuracy in representing exchange balances, it is important to note that these figures might not always encapsulate the entirety of an exchange’s reserves, particularly when exchanges refrain from disclosing their official addresses. We urge users to exercise caution and discretion when utilizing these metrics. Glassnode shall not be held responsible for any discrepancies or potential inaccuracies.
Please read our Transparency Notice when using exchange data.