BTC Market Pulse: Week 46
Bitcoin retested the key $100K level this week, a zone that has repeatedly acted as pivotal support.


Overview
After a sharp drawdown in late October, price action has begun to stabilize, forming what appears to be a potential bottoming structure. The recovery toward $106K suggests early signs of buyer re-engagement, with momentum beginning to firm up from deeply oversold conditions.
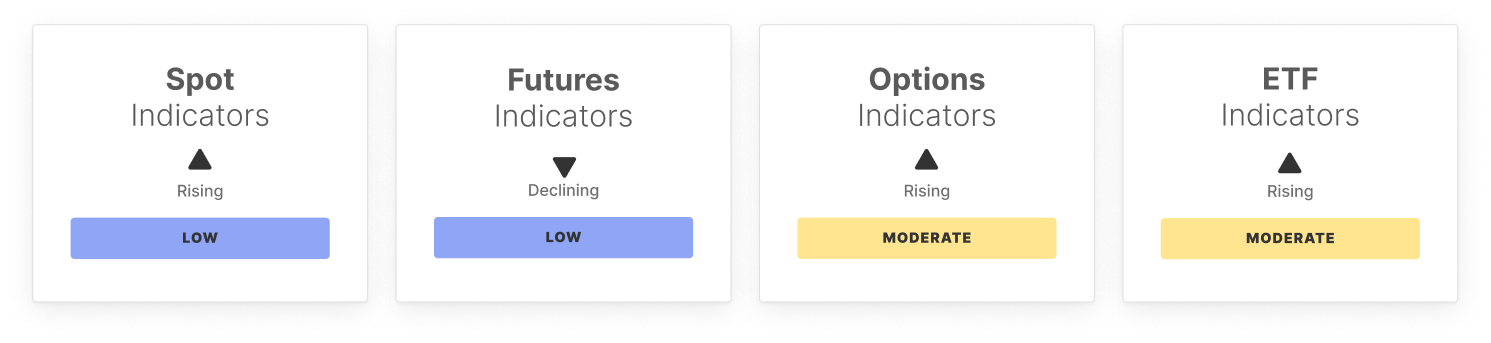
The Relative Strength Index (RSI) has rebounded from sub-30 readings, indicating that selling pressure may be waning. This aligns with a mild improvement in cumulative volume delta, showing reduced aggression from sellers and a gradual return of two-way flow. Spot trading activity remains elevated near recent highs, confirming sustained participation and the potential for volatility expansion should price break beyond short-term resistance levels around $111K–$116K.
In derivatives, open interest continues to contract modestly, reflecting deleveraging and reduced speculative exposure. Options markets remain defensive, with skew elevated as traders maintain downside hedges, though the narrowing volatility spread implies that fear is beginning to subside. These conditions point to a cautious but stabilizing derivatives environment.
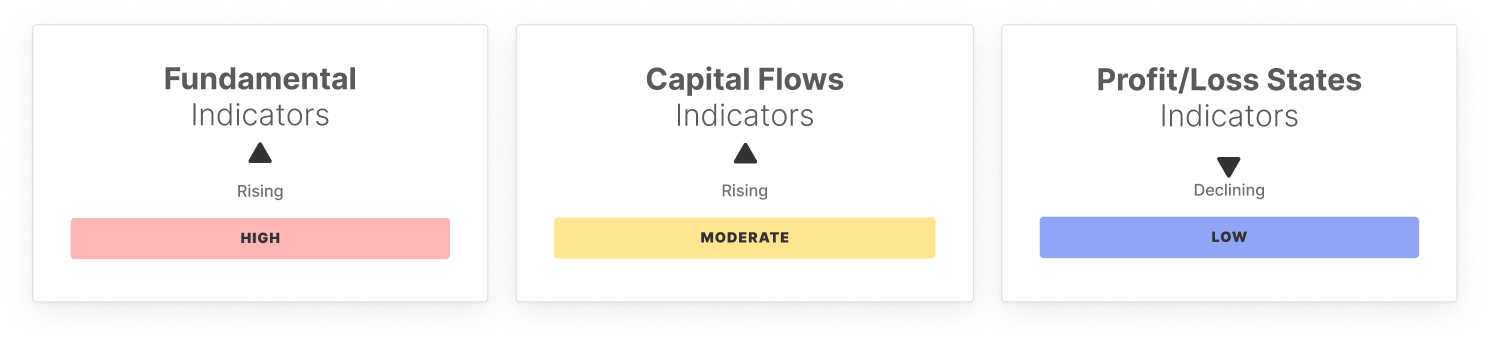
ETF flows remain negative but consistent, suggesting measured profit-taking rather than large-scale exits. Meanwhile, on-chain activity remains constructive: transfer volumes have surged above their statistical range, signaling renewed capital movement, while address activity and transaction fees indicate stable network utilization.
Profitability metrics remain weak, with a deeper drawdown in unrealized gains and losses, reflecting stress across short-term holders. However, such conditions often precede accumulation phases as stronger hands absorb supply from capitulating participants.
Bitcoin appears to be testing a critical inflection zone. Market conditions remain cautious yet constructive, with improving momentum, stabilizing flows, and signs of a potential local bottom forming around $100K. This range between $100K and $108K could mark a mid-term base of support, though the broader macro downtrend in profitability continues to anchor sentiment and limit upside conviction.
Off-Chain Indicators
On-Chain Indicators
🔗 Access the full report in PDF

- Follow us and reach out on X
- Join our Telegram channel
- For on-chain metrics, dashboards, and alerts, visit Glassnode Studio
Disclaimer: This report does not provide any investment advice. All data is provided for information and educational purposes only. No investment decision shall be based on the information provided here and you are solely responsible for your own investment decisions.
Exchange balances presented are derived from Glassnode’s comprehensive database of address labels, which are amassed through both officially published exchange information and proprietary clustering algorithms. While we strive to ensure the utmost accuracy in representing exchange balances, it is important to note that these figures might not always encapsulate the entirety of an exchange’s reserves, particularly when exchanges refrain from disclosing their official addresses. We urge users to exercise caution and discretion when utilizing these metrics. Glassnode shall not be held responsible for any discrepancies or potential inaccuracies.
Please read our Transparency Notice when using exchange data.