BTC Market Pulse: Week 48
Bitcoin extended its decline, breaking below the prior $90K support region and trading down toward $80K before staging a modest rebound.


Overview
The move last week deepened the ongoing drawdown and carried the asset further into a zone where historical demand has tended to strengthen. While the prevailing trend remains decisively to the downside, the recent defence of the mid-$80K range suggests potential stabilisation should selling pressure continue to moderate.
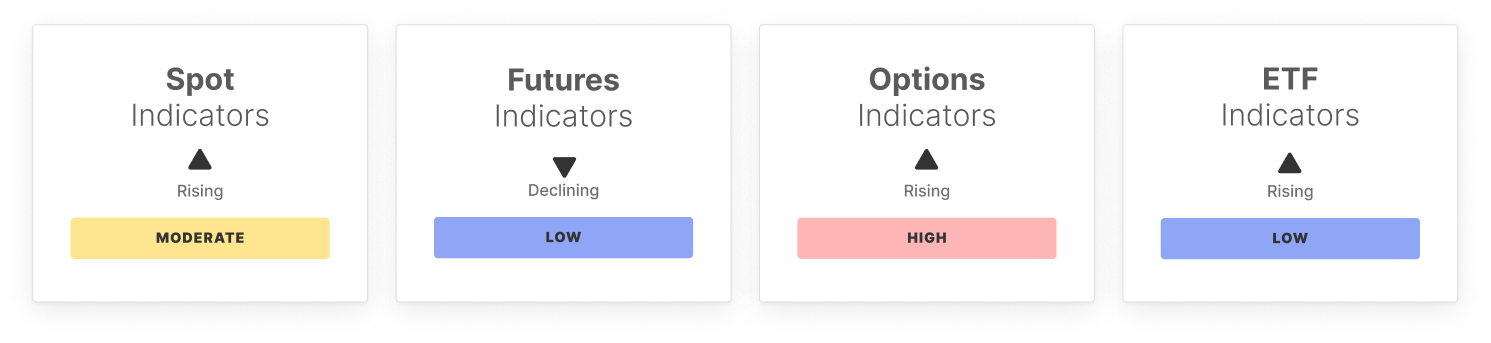
Momentum indicators remain stretched, with the 14-day RSI holding in oversold territory before turning higher, signalling sustained pressure but emerging signs of exhaustion. Derivatives data echo this: Futures and Perpetual CVD remain deeply negative, while stable Open Interest suggests the decline is being driven by position unwinds rather than new leveraged shorts.
Spot activity stayed muted as volumes softened and ETF outflows persisted, indicating a shift from aggressive selling to a more orderly de-risking phase. Options markets remained defensive, with elevated skew and a tightening volatility spread pointing to expectations of further turbulence but reduced signs of panic.
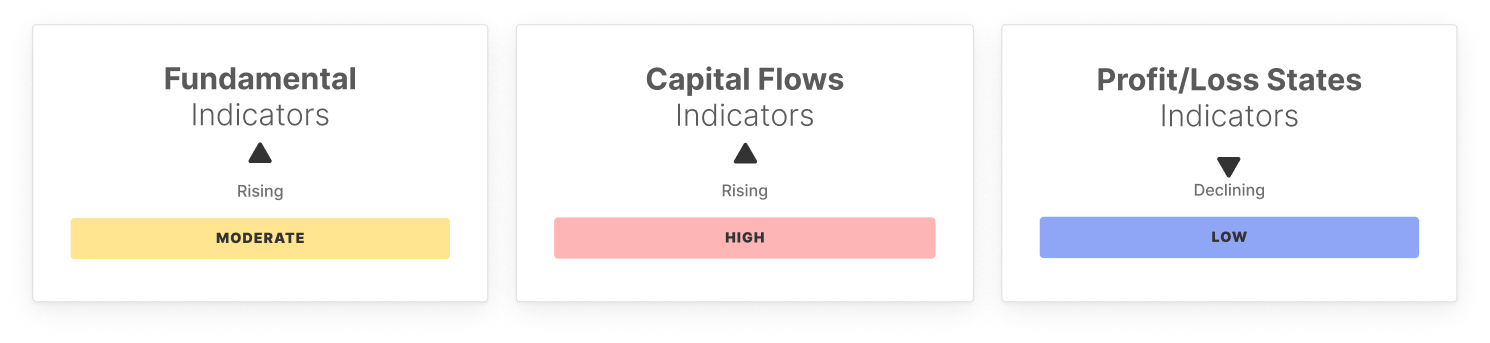
On-chain activity remained muted as well. Transfer volumes, fee revenue, and Realized Cap Change all softened, pointing to quieter network conditions. Profitability metrics deteriorated further: NUPL and Realized P/L reflect deeper unrealized losses and a rising concentration of short-term holder supply, a pattern consistent with late-stage corrections.
In sum, Bitcoin continues to navigate a controlled drawdown into deeply oversold and high-stress conditions. While profitability remains under pressure, the moderation in outflows, stabilisation in momentum, and lack of speculative leverage build-up suggest the market may be forming an early bottoming structure within the $84K–$90K range.
Off-Chain Indicators
On-Chain Indicators
🔗 Access the full report in PDF

- Follow us and reach out on X
- Join our Telegram channel
- For on-chain metrics, dashboards, and alerts, visit Glassnode Studio
Disclaimer: This report does not provide any investment advice. All data is provided for information and educational purposes only. No investment decision shall be based on the information provided here and you are solely responsible for your own investment decisions.
Exchange balances presented are derived from Glassnode’s comprehensive database of address labels, which are amassed through both officially published exchange information and proprietary clustering algorithms. While we strive to ensure the utmost accuracy in representing exchange balances, it is important to note that these figures might not always encapsulate the entirety of an exchange’s reserves, particularly when exchanges refrain from disclosing their official addresses. We urge users to exercise caution and discretion when utilizing these metrics. Glassnode shall not be held responsible for any discrepancies or potential inaccuracies.
Please read our Transparency Notice when using exchange data.