BTC Market Pulse: Week 6
Bitcoin has fallen to $74K after losing the November lows, with momentum collapsing as 14D RSI plunges into oversold territory. Spot volume has rebounded, but looks reactive, reflecting churn during downside continuation rather than confident dip buying.


Overview
Bitcoin has fallen to $74K after failing to hold the November lows,
with momentum collapsing as the 14-day RSI plunges into deeply
oversold territory. Spot volume has rebounded, but the rise looks
more reactive than constructive, reflecting churn during downside
continuation rather than confident dip buying.
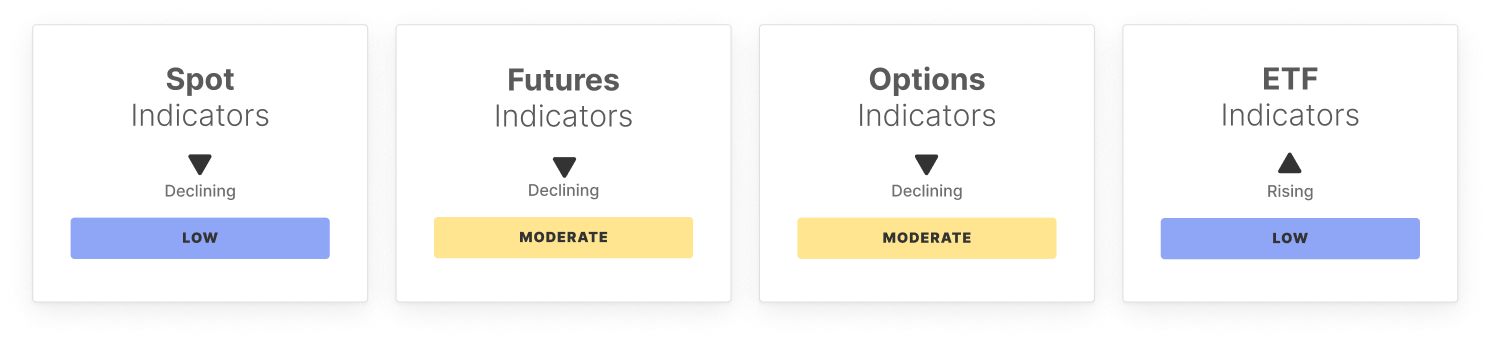
Spot conditions remain weak, with Spot CVD breaking to new lows
and confirming sustained sell-side dominance. While ETF net
outflows have eased slightly, overall positioning still points to
ongoing distribution pressure, even as trade volume spikes
suggest active risk rotation rather than decisive buying.
Derivatives markets continue to lean defensive. Futures open
interest has eased, signalling a modest reduction in leverage, while
funding rates have cooled as long appetite fades. Perpetual CVD
has deteriorated further, highlighting aggressive sell pressure from
leveraged traders and reinforcing downside conviction.
Options markets are de-risking. Open interest has contracted
below its lower band, reflecting position closures and reduced
engagement, while the volatility spread has compressed,
indicating a fading fear premium. 25-delta skew has softened
marginally, suggesting hedging demand remains elevated but no
longer accelerating
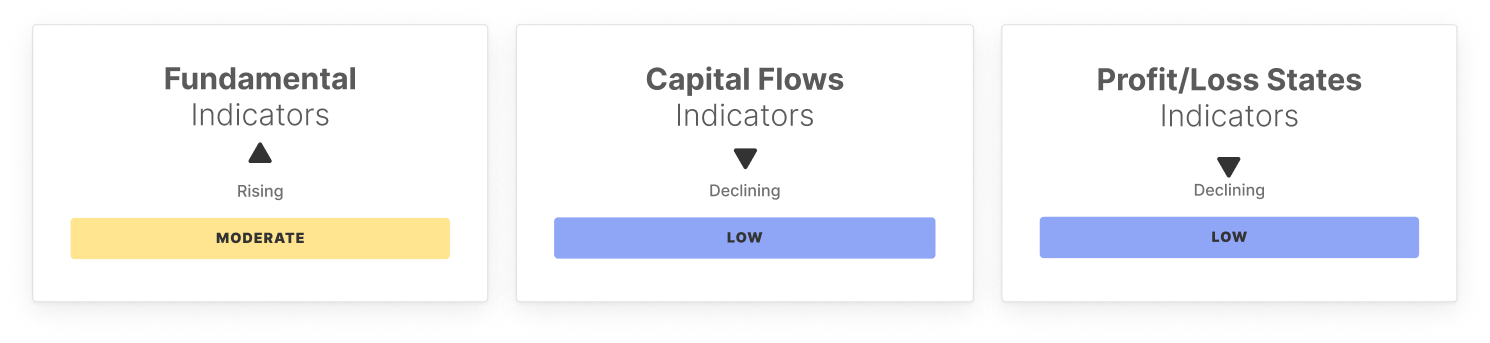
On-chain activity remains subdued. Active addresses and fee
volumes have improved modestly, however transfer volume
remains low and realised cap continues to contract, signalling weak
net capital inflows. Profitability has deteriorated further, with
supply in profit falling and unrealised losses deepening, while
realised losses continue to dominate, consistent with a market
under stress.
Overall, conditions have shifted into a clear risk-off regime
across spot, derivatives, ETFs, and on-chain indicators. With
price now below key cost bases and profitability compressed,
near-term stabilisation likely depends on sell pressure
exhausting and demand returning to defend the $74K region.
Off-Chain Indicators
On-Chain Indicators
🔗 Access the full report in PDF

- Follow us and reach out on X
- Join our Telegram channel
- For on-chain metrics, dashboards, and alerts, visit Glassnode Studio
Disclaimer: This report does not provide any investment advice. All data is provided for information and educational purposes only. No investment decision shall be based on the information provided here and you are solely responsible for your own investment decisions.
Exchange balances presented are derived from Glassnode’s comprehensive database of address labels, which are amassed through both officially published exchange information and proprietary clustering algorithms. While we strive to ensure the utmost accuracy in representing exchange balances, it is important to note that these figures might not always encapsulate the entirety of an exchange’s reserves, particularly when exchanges refrain from disclosing their official addresses. We urge users to exercise caution and discretion when utilizing these metrics. Glassnode shall not be held responsible for any discrepancies or potential inaccuracies.
Please read our Transparency Notice when using exchange data.