Coinbase + Glassnode: Charting Crypto Q2 2026
The Q2 Charting Crypto report distills the key market and on-chain trends impacting institutional crypto strategy this quarter.


Geopolitical events in recent months have introduced persistent uncertainty for investors, making it challenging to take short-term positions with conviction. Macro developments now overshadow crypto-native drivers in shaping near-term price action.
Produced in collaboration with Coinbase Institutional, the latest Charting Crypto report distills the key market and on-chain trends impacting institutional crypto strategy this quarter. From investor sentiment and stablecoin liquidity to Bitcoin accumulation signals and Ethereum’s evolving market structure, the report offers a data-driven view of a market waiting for clearer direction.
Read the full Charting Crypto Q2 2026 report in PDF.
Some of the many highlights in this edition:
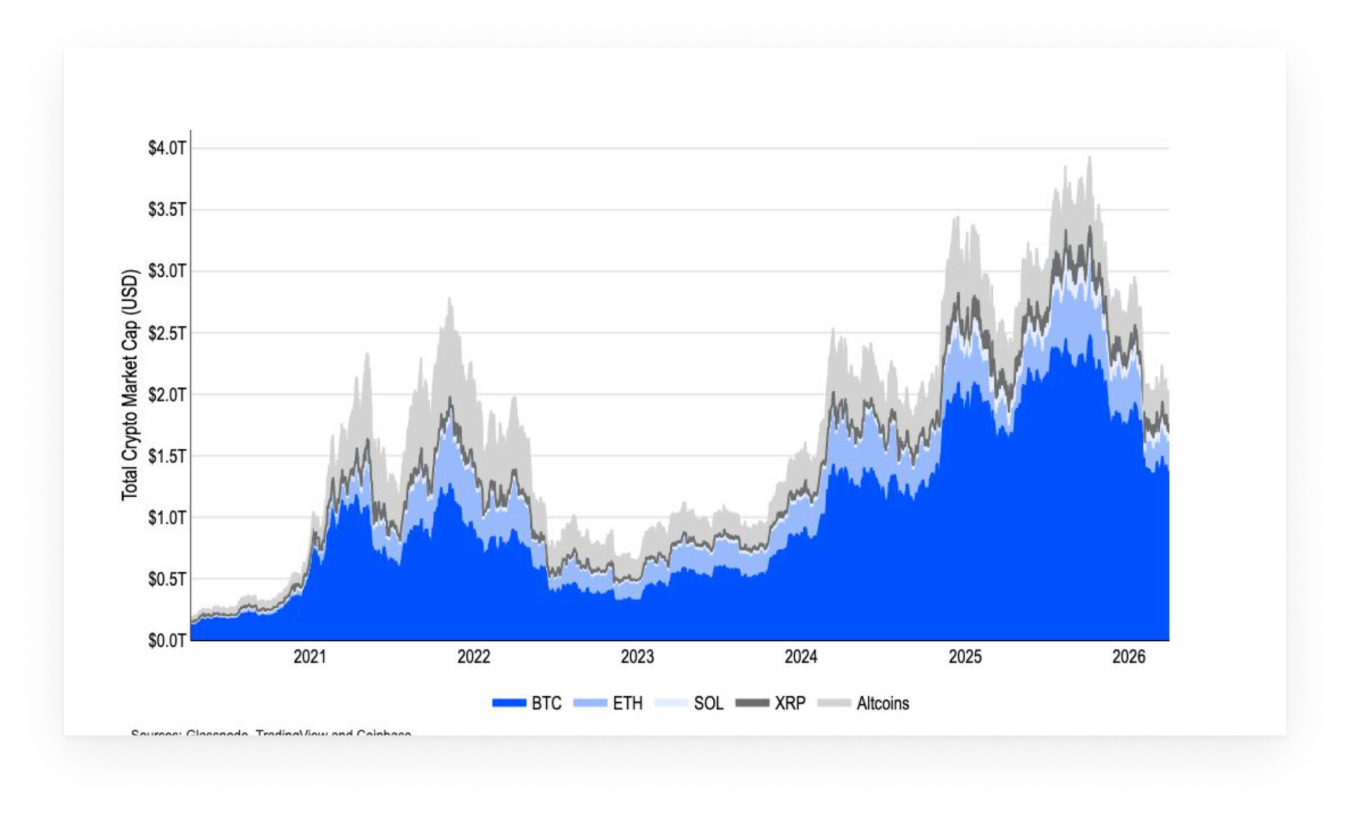
- Liquidity is rotating into stablecoins rather than exiting the asset class, as total crypto market cap (excluding stablecoins) fell by ~18% in Q1, while stablecoin supply increased from $308B to $318B
- Past cycle analogues are becoming less useful for timing market inflection points as both Bitcoin and Ethereum cycles continue to diverge from historical patterns
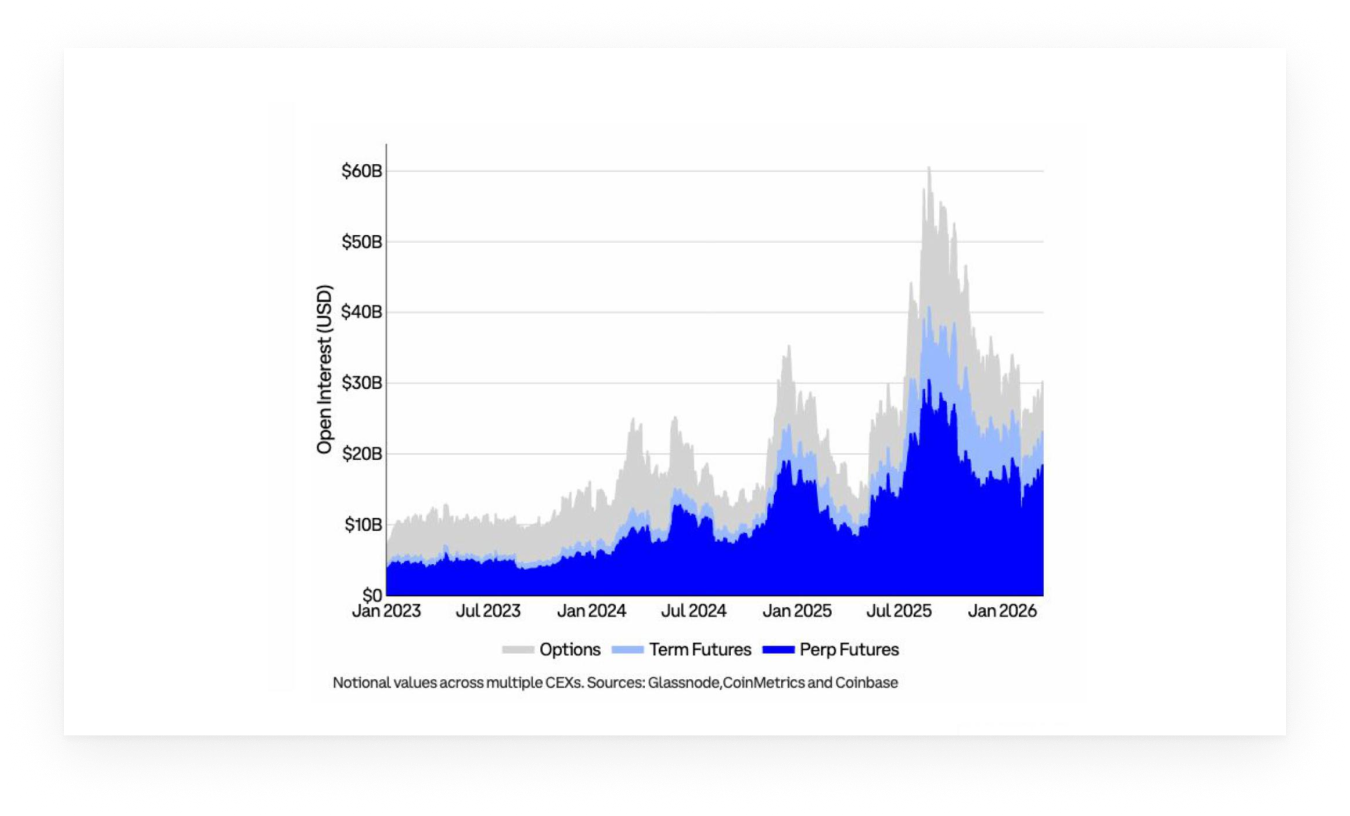
- Market structure shows signs of normalization, with BTC derivatives open interest recovering (particularly in perpetuals), indicating a rebuilding of risk appetite in leveraged markets
- 82% of surveyed institutions now place the market in a bear or late-bear phase (up from 31% in December)
- Ethereum’s ecosystem is becoming more differentiated: Capital concentrates in base-layer use cases as broader activity softens, highlighting a shift toward utility-driven demand over speculative flows.

Liquidity Remains Inside the System
Despite the broad risk-off move in Q1, liquidity dynamics tell a more nuanced story. Total crypto market capitalization (excluding stablecoins) declined by roughly 18%, yet stablecoin supply increased over the same period.
This divergence suggests that capital is not fully leaving crypto markets, but rather rotating into cash-like instruments while awaiting clearer signals. In effect, investors are de-risking without disengaging, preserving optionality for re-entry.
Bitcoin: Sentiment Reset, Supply Tightens
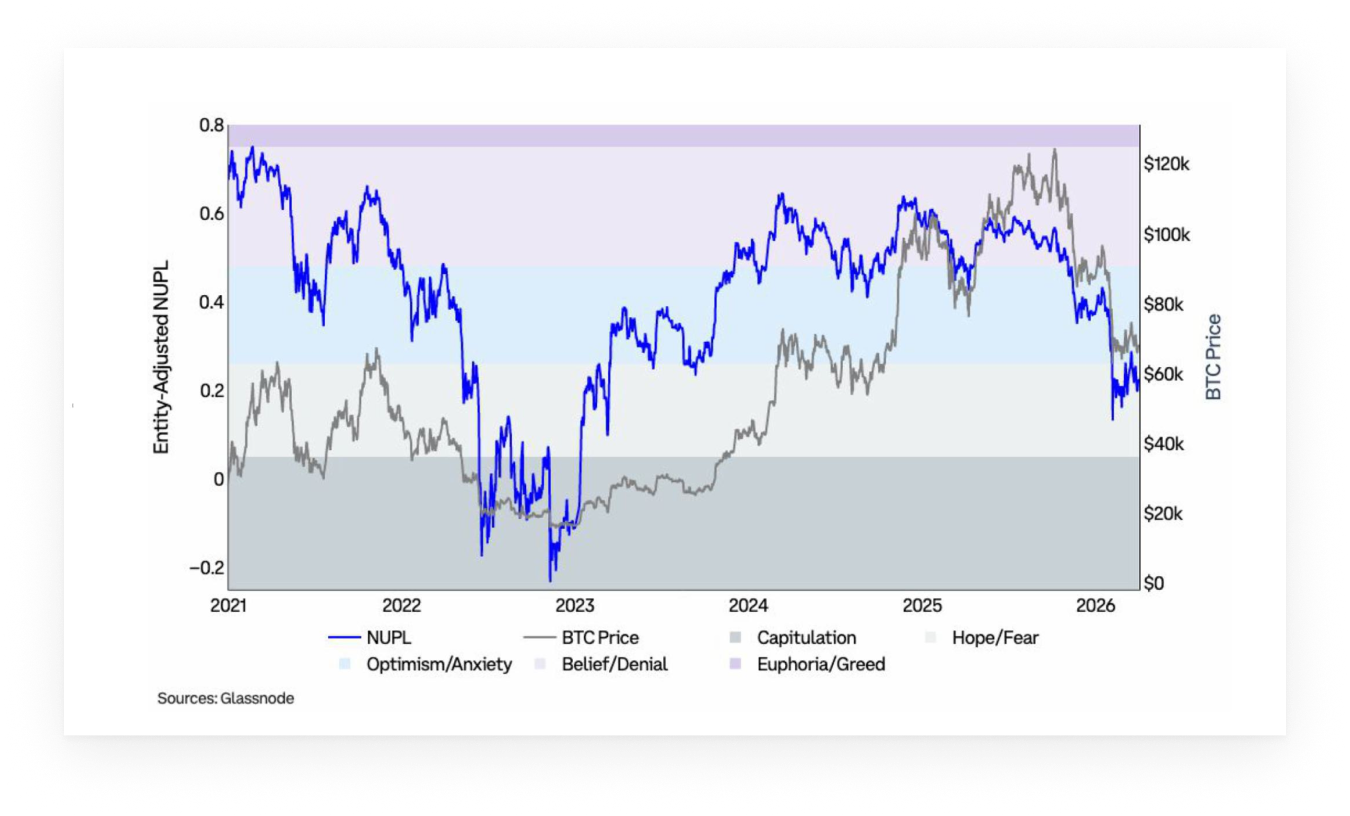
Bitcoin’s February drawdown was reflected in a deterioration in investor sentiment, with Net Unrealized Profit/Loss (NUPL) moving from Anxiety into Fear for the rest of Q1. While sentiment has started to show early signs of improvement in April, it remains closely tied to external developments, suggesting conviction is still fragile.
At the same time, onchain supply dynamics indicate a transfer of coins away from more reactive participants. The contraction in recently active supply, alongside a modest increase in long-term held coins, implies that shorter-term, speculative capital has been reduced.
Ethereum: Capital Concentration at the Base Layer
Ethereum data points to a divergence between activity and capital allocation. Short-term participation declined throughout the first quarter, as reflected in a sharp drop in recently active supply and a prolonged period of depressed sentiment. However, capital flows have remained concentrated on the base layer.
Stablecoin supply on Ethereum continues to expand with positive momentum, and tokenized real-world assets have reached new highs, indicating sustained demand for settlement and collateral use cases. At the same time, ETH has outperformed major L2 tokens since late 2025, suggesting that capital is consolidating at the base layer rather than rotating further out on the risk curve.
To help you navigate the current challenging crypto environment, check out the full insights and data in the Glassnode x Coinbase report: download the report here.