The Question of Bitcoin Volatility
Delve into the fluctuations of Bitcoin's market, examining key metrics and significant events that have impacted its financial landscape. Discover what these trends could mean for Bitcoin's future prospects.

Disclaimer: The analysis provided here offers a window into the world of Bitcoin volatility. Please remember that this represents just one element in the multifaceted realm of cryptocurrency. While data from Glassnode can provide valuable insights, it's essential to approach this information holistically, as the beginning of your personal research journey.
Since its inception, Bitcoin has been a focal point for discussions around market volatility. Defined by both frequency and magnitude of price changes, volatility provides insights into an asset's risk and opportunity profiles. This article delves into Bitcoin's history of volatility, evaluates recent trends of stability, and assesses the implications for future market behavior.
Historical Notoriety of Bitcoin's Volatility
Since its inception, Bitcoin has exhibited market volatility, with notable price changes linked to key events. Price swings have correlated with events such as the 2014 Mt. Gox hack and regulatory changes in China.
From Historical Trends to Contemporary Developments
Transitioning from historical volatility, it's essential to examine the evolution of Bitcoin's market dynamics. This leads to a broader analysis of Bitcoin's financial milestones, providing insights into its market behavior.
Bitcoin Market Cycle Table
| Period | Price Range | Highlights |
|---|---|---|
| Mt. Gox Collapse | $300-$1100 | The 2014 collapse led to a prolonged bear market and changed the landscape of crypto exchanges. |
| 2015 Transition | $200-$500 | Shifted from bear market to 2016 re-accumulation. |
| Late 2018-Mid 2019 Rebound | $3,000-$14,000 | After a 50% sell-off in 2018, prices rebounded in April 2019. |
| COVID-19 Impact | $5,000-$69,000 | The pandemic had a significant influence on Bitcoin's market. |
| FTX Setback and Aftermath | $17,000-$30,000 | Late 2022 saw the FTX setback which has shaped the market into 2023. |
Despite a trend toward lower volatility in 2023, the events of August 17th highlighted the asset's potential for sudden change. On this day, the Bitcoin futures market experienced liquidation of over 68,000 Bitcoin within just an hour. This led to long liquidations exceeding $220 million and an Options Implied Volatility spike from 24% to 55%.
This disruption caused Bitcoin's price to dip below the $25,000 mark, leading to the largest single-day loss of the year and erasing $2.5 billion in open interest from the derivatives market. Interestingly, the volatility was similar to that seen after the FTX setback, underlining the market's inherent risk.
The Recent Contraction
While the August 17th event was a stark reminder of Bitcoin's volatility, a different trend has been emerging in recent months. Daily price fluctuations, which once varied by 3-4%, have constricted to a mere 1% range in the last quarter. This narrowing of volatility is not new; a similar trend was observed following the 2018 bear market, which was then succeeded by a rapid rally from $4,000 to $14,000 in Q2 2019.
The current 1-year realized volatility aligns with levels recorded in December 2016. While this suggests recent stability, history shows that low volatility often precedes market shifts.
The At-The-Money (ATM) Implied Volatility metric below offers further context. It estimates expected volatility based on option pricing, indicating the asset's likely price movement range over a year. Analyzing ATM IV across varying timeframes reveals evolving market expectations.
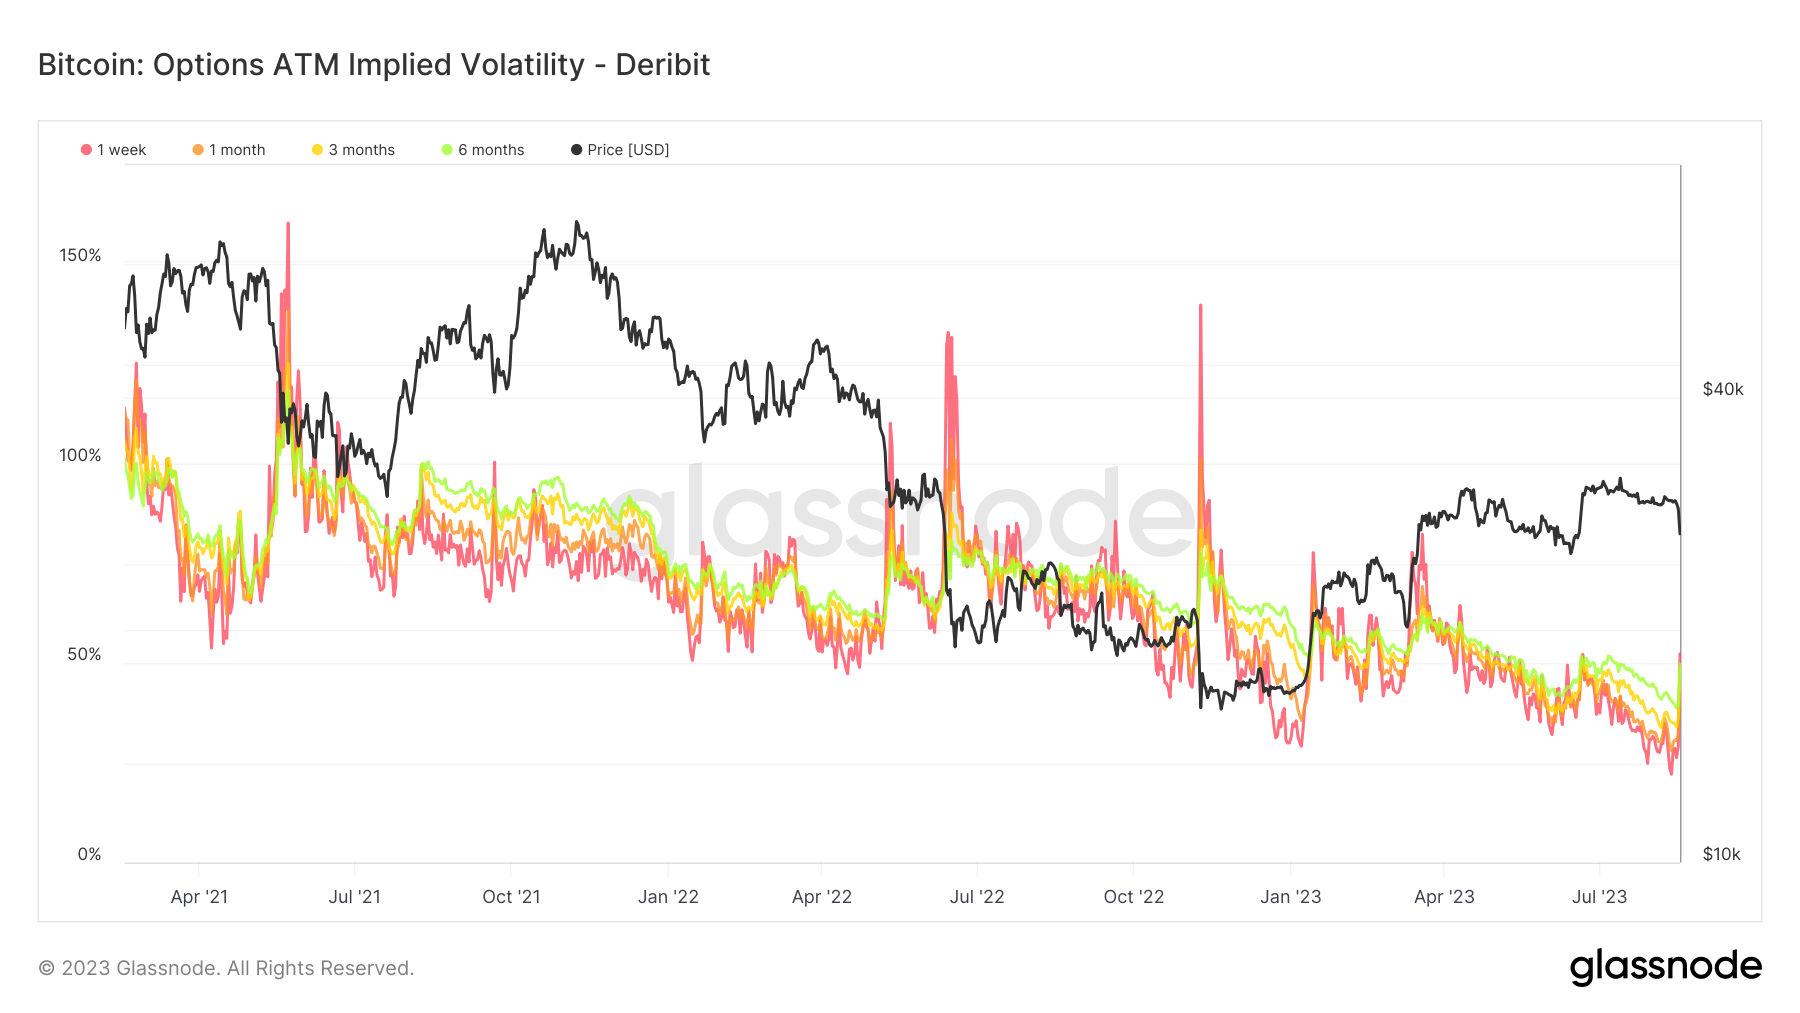
Historically, Bitcoin's implied volatility has ranged between 60% and exceeded 100% in 2021-22, far surpassing traditional markets like the S&P 500, where the VIX seldom reaches 80% even in downturns.
Currently, however, ATM IV figures are fluctuating between 24% and 52%, signaling a notable departure from past norms and reflecting some of the least volatile projections in Bitcoin's history.
A Break in Pattern: From Stability to Sudden Volatility
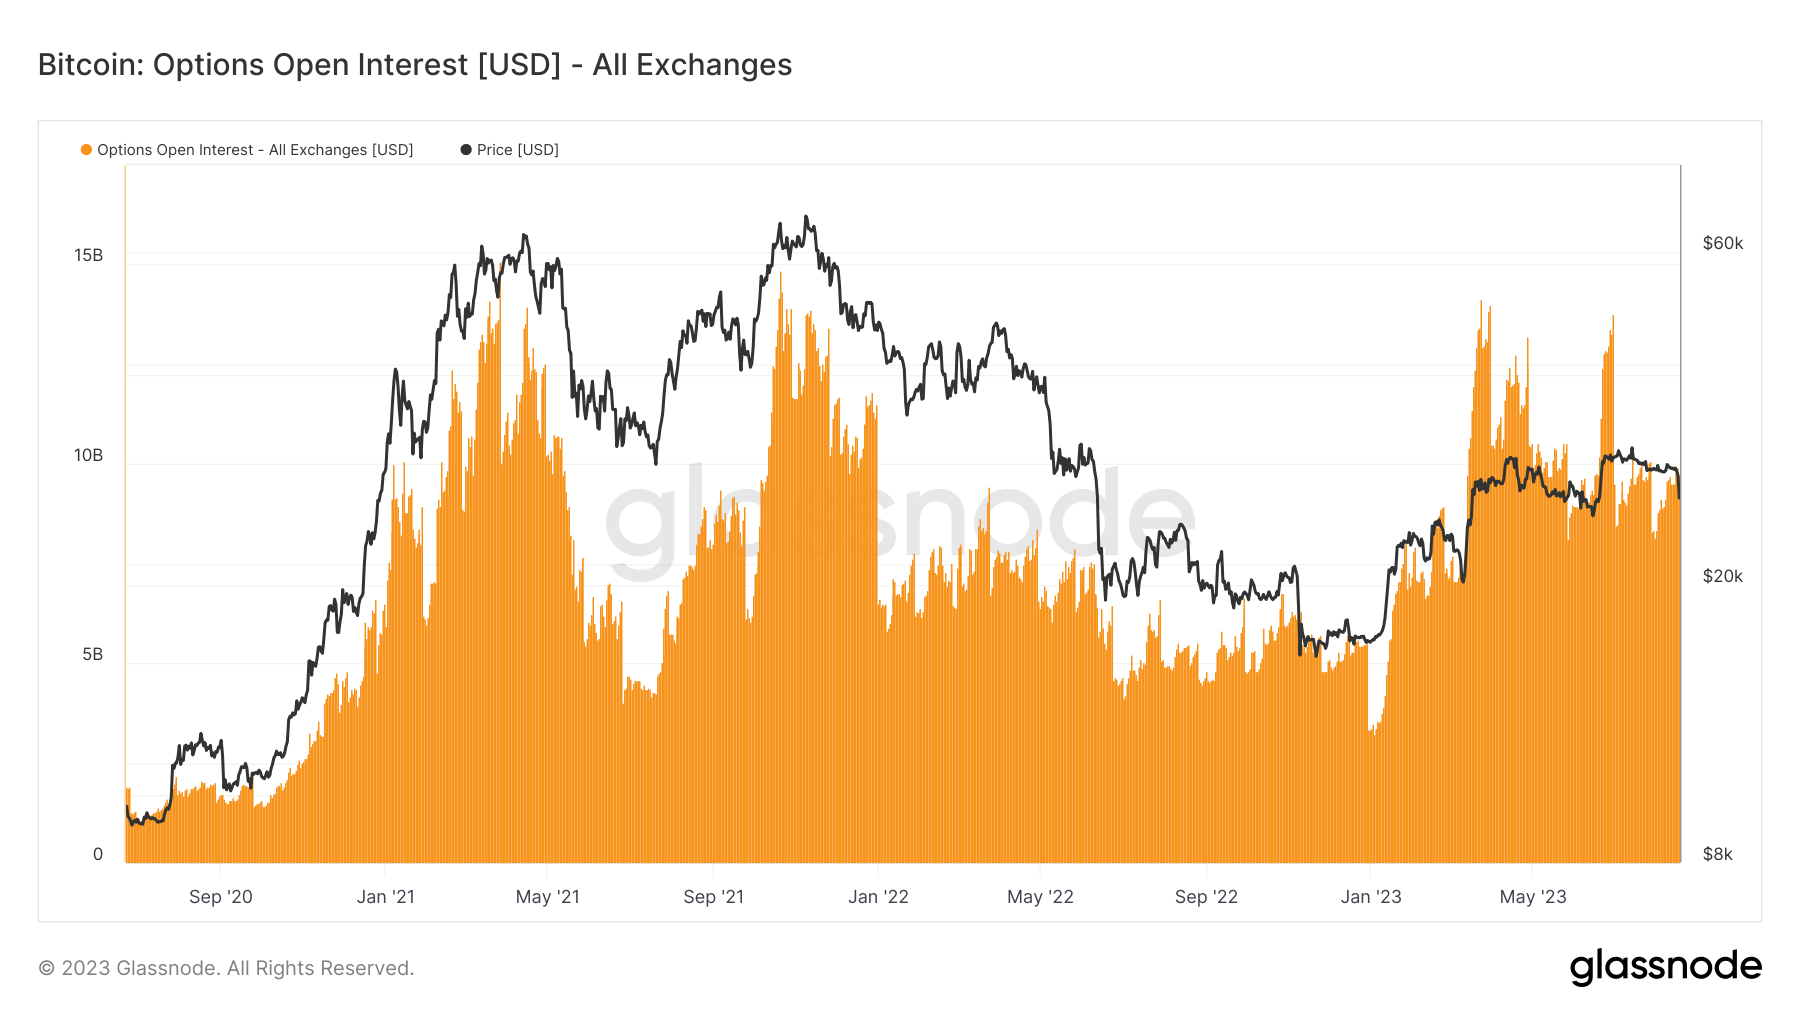
Up until August 17th, 2023, Bitcoin's market seemed to be moving toward a new standard of reduced volatility. This condition was also reflected in the Options Open Interest metric below, which showed a 133% increase in 2023, likely pointing to increased institutional involvement. This rise in interest contrasted with Bitcoin's flat price action during the same period.
However, the events of August 17th signaled a sudden and dramatic shift. Spot markets saw significant turnover, with daily trading volumes exceeding $20 billion for the first time since January. The Put-to-Call ratio experienced a surge, crossing the 0.7 mark—a level not seen since the high-volatility periods of late 2021. This disruption prompts us to reevaluate whether the preceding stability was a new norm or simply a phase. History suggests that low-volatility periods can precede significant market shifts, adding another layer of complexity to the current market conditions.
Thus, while the drop in volatility earlier in the year might have suggested Bitcoin's maturation and greater integration into mainstream finance, the dramatic events of August 17th underline the asset's inherent susceptibility to rapid changes.
Conclusion
Though Bitcoin showed reduced volatility for most of 2023, the events of August 17 highlight its capacity for quick price changes. This volatility affects both investment strategy and risk evaluation. Some see the quieter periods as signs of market maturity, but history suggests they can come before major market shifts. Therefore, ongoing vigilance is essential in this volatile market.
Disclaimer: Past performance is not indicative of future results. This article is intended for informational purposes only, and it does not constitute investment advice. Always conduct thorough research.