DeFi Uncovered: Hunting for Value
A framework for finding value in DeFi governance tokens.


Title image made using a planet from NFT collection Procedural Space.
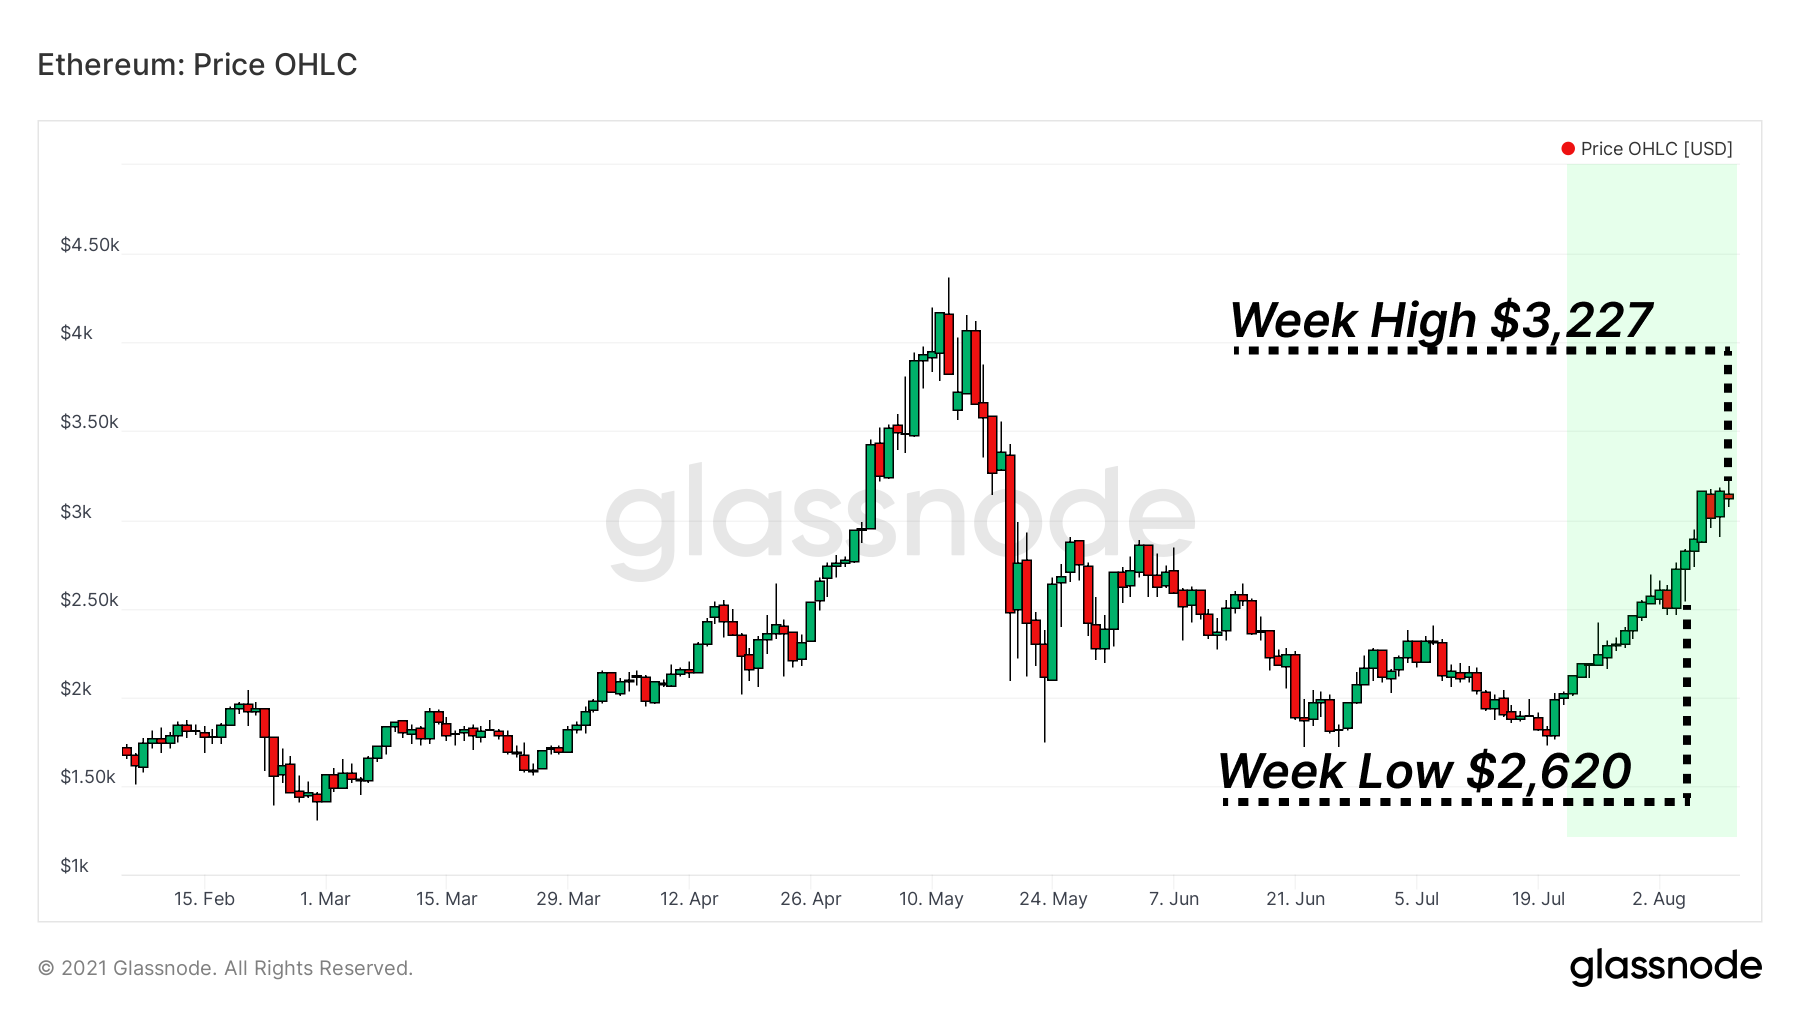
The ETH rally has continued, with prices breaching the $3,000 level. The rally accompanies continued enthusiasm surrounding NFTs and the successful implementation of EIP-1559 in the London hard-fork activated last week. On-chain activity has also seen an upswing, largely driven by the launch and excitement around a constant stream of new NFT collections.
In this piece we will explore:
- The initial effects of EIP-1559 following launch.
- Explore relative valuation models for governance tokens.
- Assess token valuations across the space using on-chain data.
EIP-1559 Goes Live
EIP-1559 has come into effect as of August 5th, implementing key changes to the Ethereum network transaction fee design. A portion of ETH network fees, called BASEFEE, are now burnt instead of awarded to miners.
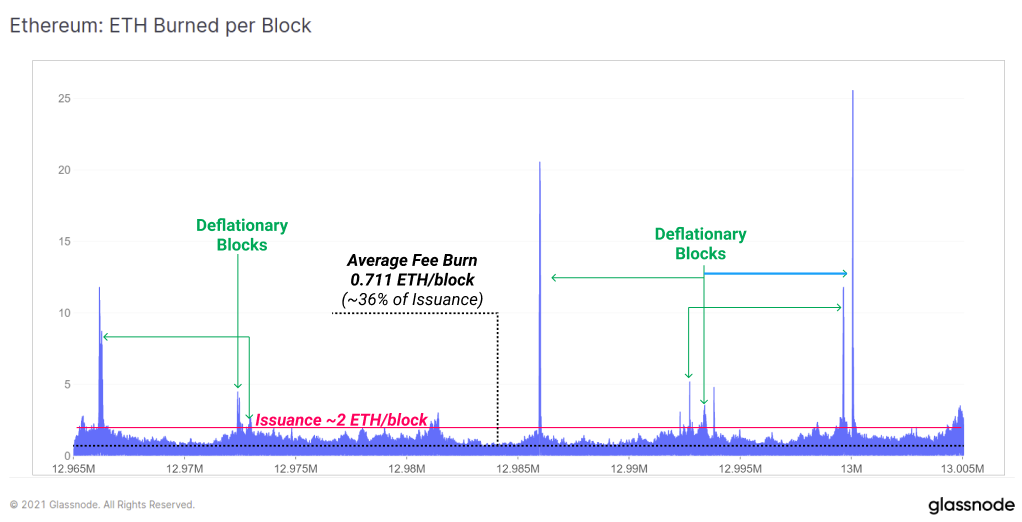
This mechanism effectively offsets the issuance of new ETH to the network via the block subsidy. The current ETH issuance rate to miners is 2 ETH/block, with an additional provision of 0.0625 ETH for uncle blocks.
As on-chain activity increases, more transaction fees are paid by users, and thus more ETH is burned. This mechanism therefore acts to translate economic activity on the Ethereum blockchain into scarcity for the ETH token. Since the launch of EIP-1559, the average burn/block has been about 0.71 ETH/block. This means the effective issuance rate of ETH supply has slowed by 36%.
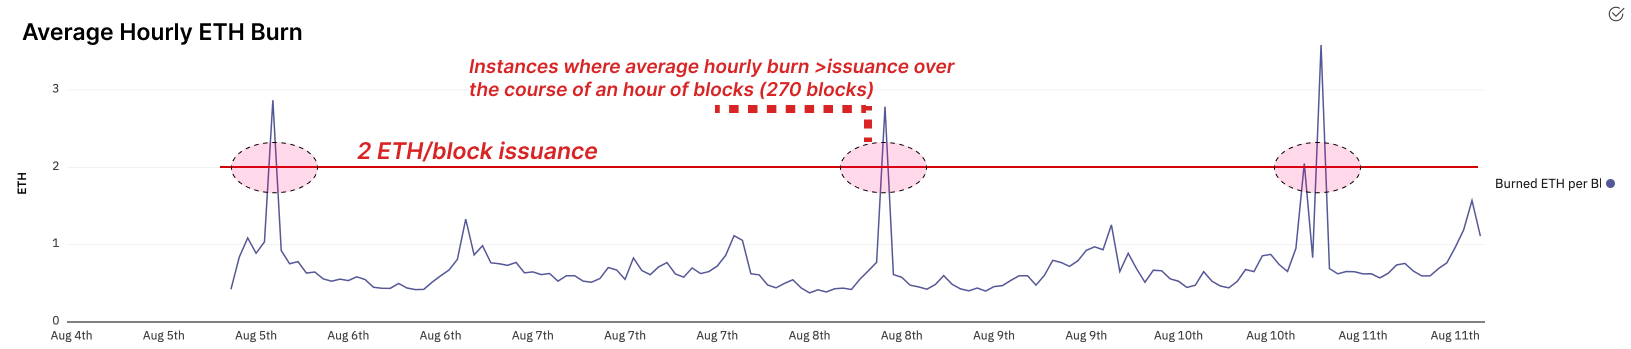
In the extreme cases of high demand for block-space, net ETH issuance can indeed become net deflationary, where more ETH is burned than is issued. It is noted that under the current Proof-of-Work issuance schedule, such a level of deflation would require network usage significantly higher than that expressed today.
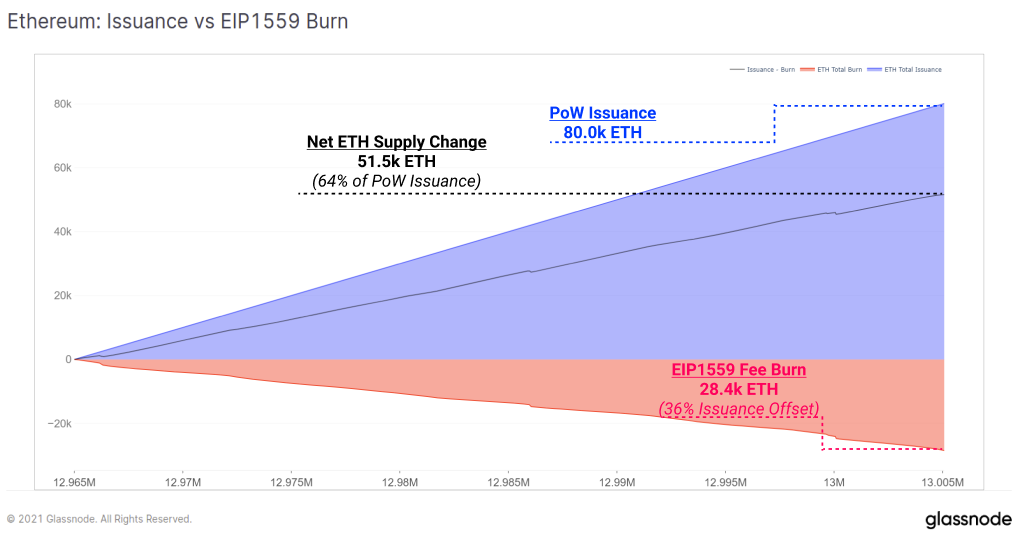
For the 80.0k ETH issued from the 5th to the 10th of August, 28.4k of previous supply have been burned through the EIP-1559 fee burn mechanism.
There have been a number of instances already where net deflationary blocks have been mined. In high usage environments, and particularly after the transition to the lower issuance environment of Proof-of-Stake, it's entirely possible that deflation via the burn mechanism will be structurally higher than issuance.
There is also an argument to be made that EIP-1559 creates a net reduction in sell pressure, as supply inflates at a lower rate, existing tokens are less diluted, and demand to hold the ETH token increases in response. Miners are additionally given more incentive to hold a percentage of ETH mined as the transition to Proof-of-Stake creeps closer and ETH holdings translate into validator counts.
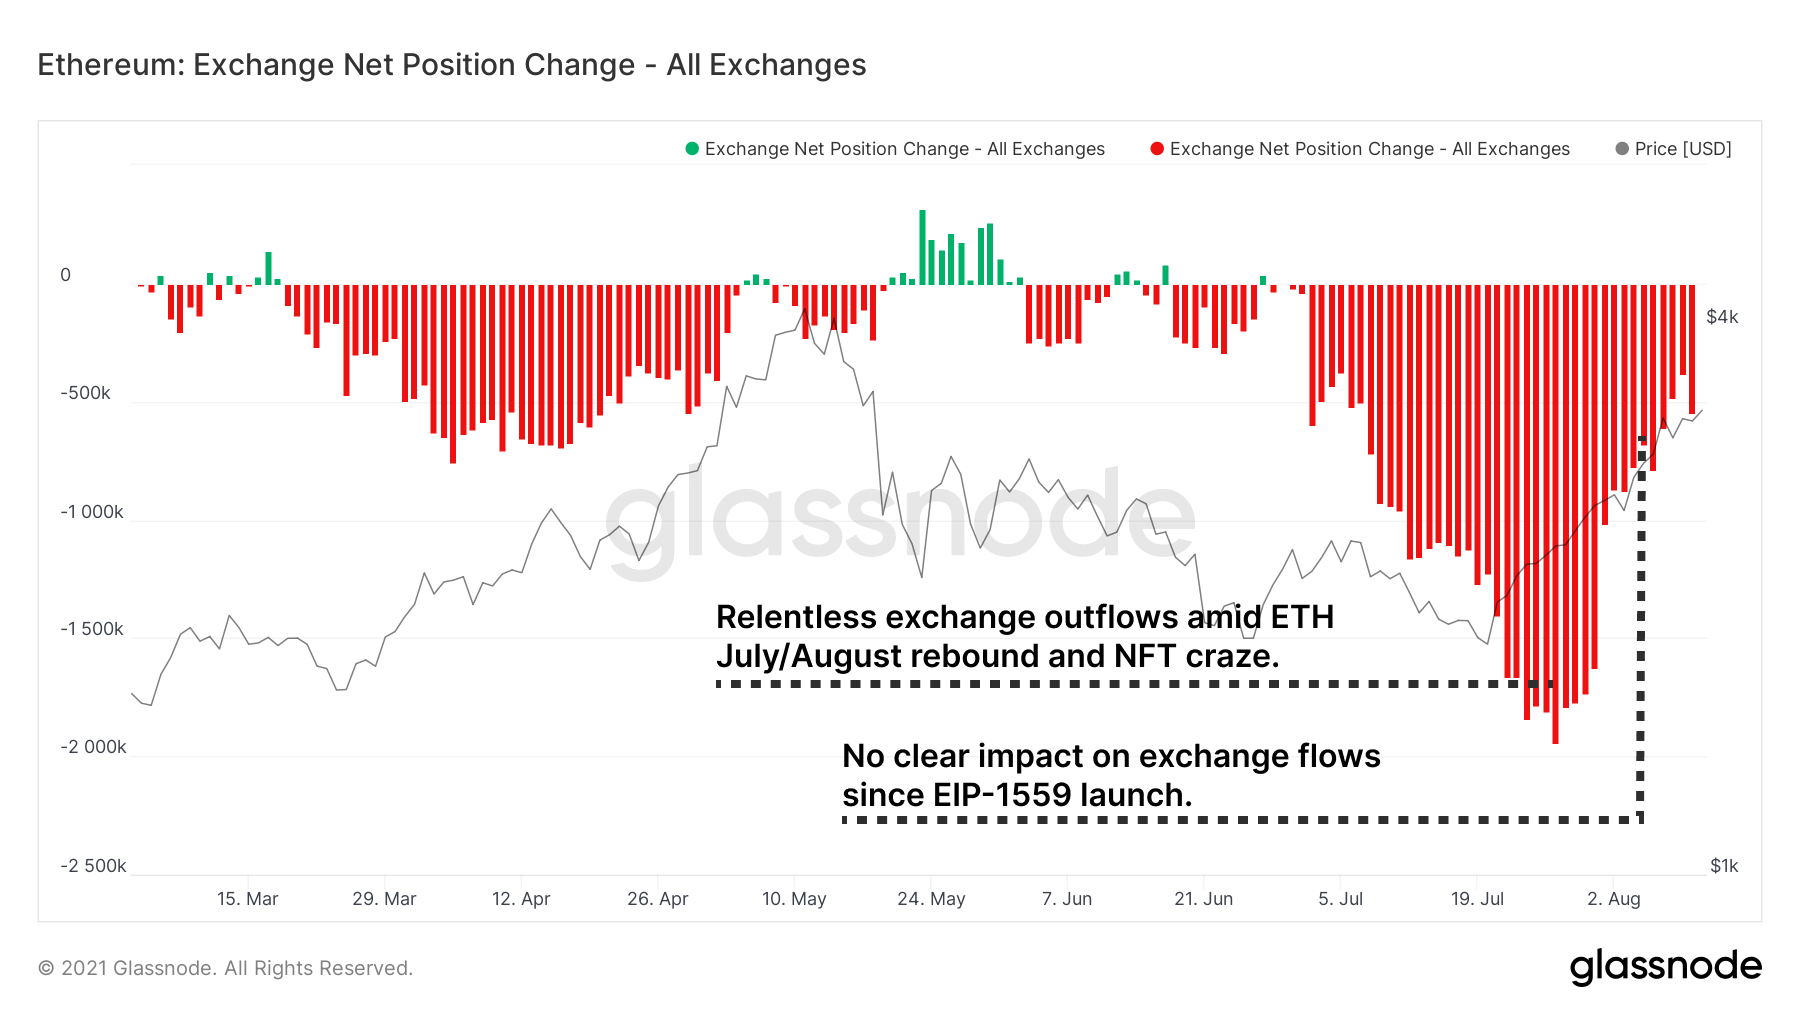
An interesting note is the net position change metric for exchanges. It shows fairly dramatic outflows occurring throughout July as ETH prices traded around $2,000. Outflows have slowed on a relative scale, however remain elevated compared to historical norms. There has not yet been a notable impact on exchange flows following EIP1559, however this is a metric to keep an eye on.
Exploring Token Valuation Metrics
Token prices throughout the Ethereum ecosystem have also caught a bid in the last few weeks. It is useful in these market conditions to step back and think about how one might identify asymmetric value in governance tokens. The aim is to identify tokens that may be undervalued compared to their core fundamental metrics and on-chain utilization.
Value Locked vs. Valuation
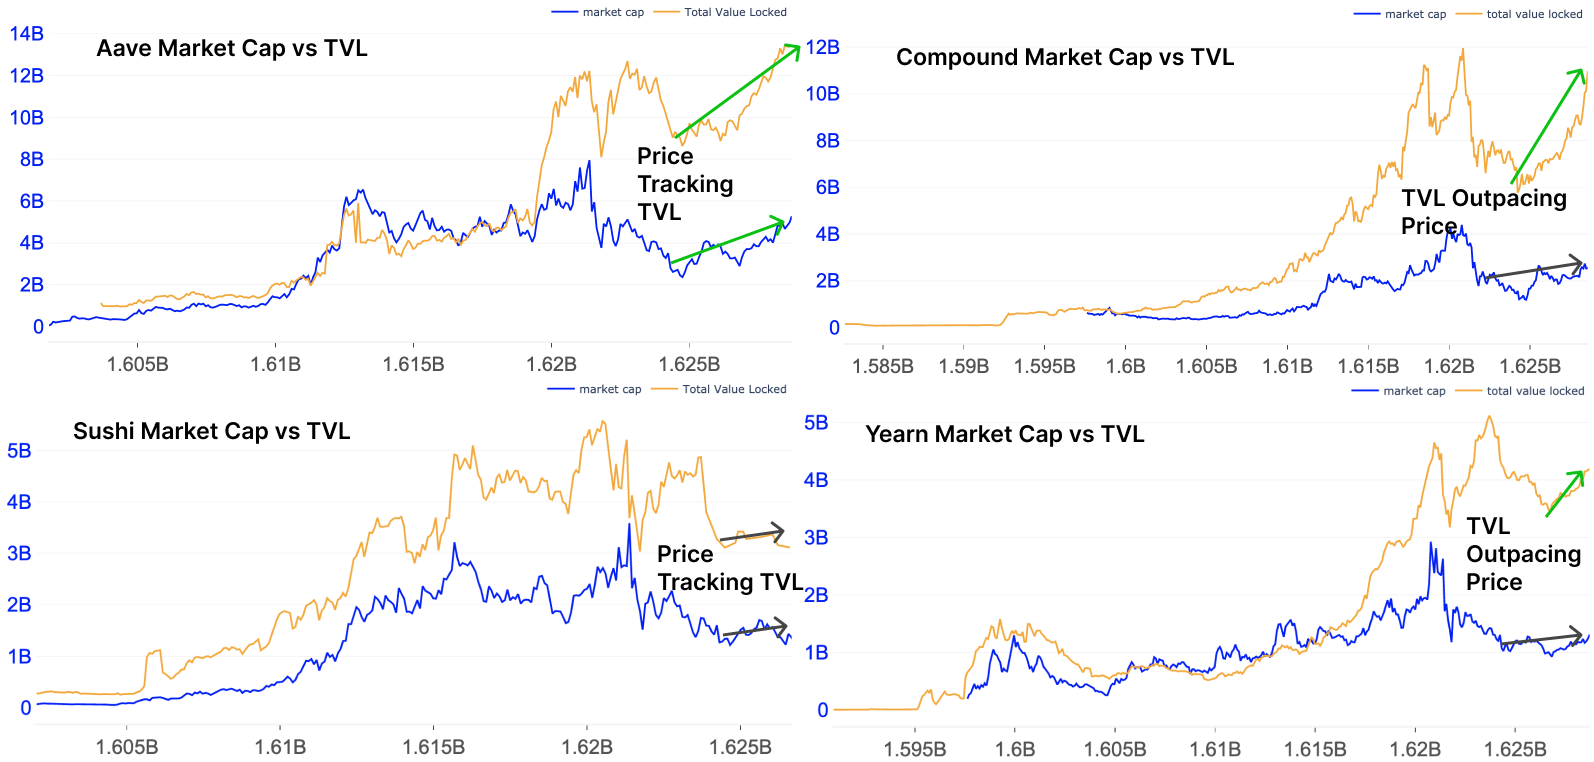
Starting at the simplest possible analysis, we might compare the ratio of total value locked (TVL) in a protocol vs the token's market cap. Whilst TVL alone is an insufficient measure of a protocol's adoption, efficiency, and future value, it can be a useful metric for understanding short to mid-term price action. Many people track TVL so it has a sort of reflexive impact on price and attention. It also gives us a high level indicator of liquidity added to a protocol and of product market fit (accounting for liquidity mining that can skew interpretation).
In a hunt for value, we can see that Compound or Yearn for example, have seen a recent outpacing of protocol TVL, relative to the token's price performance. Sushi on the other hand is an example of the opposite observation, whereby TVL growth has remained relatively flat, and sluggish price performance is reflecting that.
Protocol Revenue vs Valuation
Protocol revenue can create a strong narrative for token holders interested in existing or potential cash flows. These are cumulative revenues for a number of core DeFi protocols that are directed to treasury or rewarded to token holders. The higher the fees/market cap ratio, the more value a token holder is (theoretically) receiving for every dollar invested.
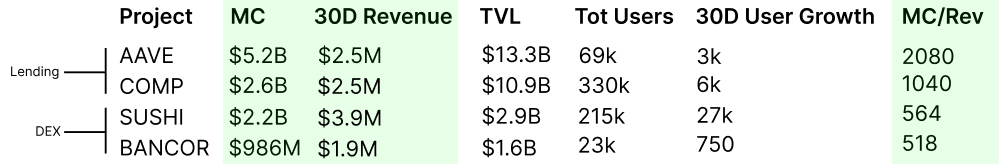
In theory, COMP is again presenting itself as a value play against AAVE, with equivalent 30 day revenue, but 50% of the market cap.
Note how we show 2 lending protocols (Compound, Aave) next to two decentralized exchanges (Sushiswap, Bancor). When doing these analyses, it is useful to compare projects by sector to reflect similar fee generation mechanics, and competition for the same set of users. Comparing directly across sectors is often not appropriate and can be misleading.
Measuring Protocol Cash/Liquidity
We compared TVL against market cap in the last section in an attempt to find under/over valuation relative to user capital allocated. We can also compare important usage metrics like fees generated against TVL to measure the efficiency of a protocol relative to the protocol's liquidity.
TVL doesn't tell the entire story as a protocol may be far less efficient with the value allocated to its pools by users. It might generate fewer fees per dollar deposited. Thus a comparison of fees generated vs TVL can be deployed to measure this directly.
- Higher TVL/Revenue values indicate lower fee generation per dollar locked
- Lower TVL/Revenue values indicate higher fee generation per dollar locked
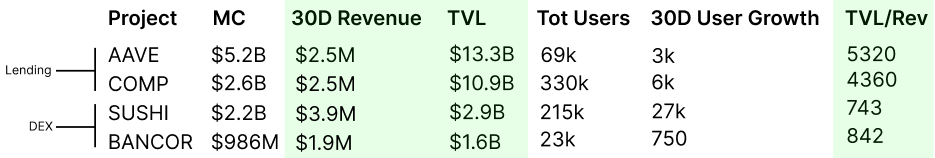
Note how vastly more capital is allocated to the two lending protocols ($10B+) to create every marginal dollar of revenue. Compound continues to make a compelling argument for being undervalued on a relative basis to Aave, with its TVL/Revenue being 18% more fee generating.
Regarding the two DEX protocols Sushi and Bancor, the difference in fee generation is less dramatic with a 11.7% difference in this metric, although that compares to Bancor having a market cap only 44% of Sushi. Next we will compare the user-base of these protocols to compete the picture.
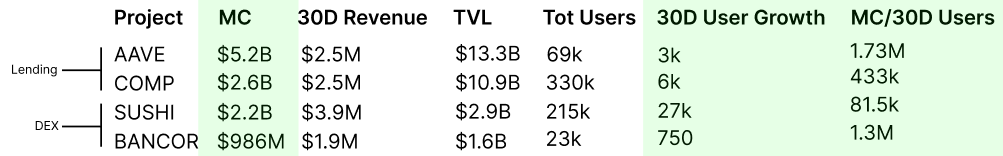
Users vs Market Cap
Total addresses interacting with a protocol are often considered analogous to users. Considering a similar analysis framework based on this metric also tells an interesting story. First we assess cumulative all time user counts for each protocol where:
- High Market Cap/User ratios indicate a small number of all-time users relative to market value and potential overvaluation
- Low Market Cap/User ratios indicate a large number of all-time users relative to market value and potential undervaluation
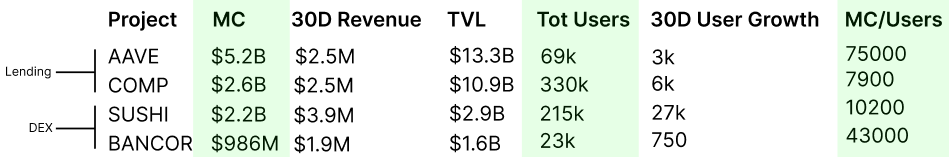
We again see Compound and Sushi appear on-top in their respective categories.
However, we must be careful when studying cumulative user metrics. User numbers can be skewed depending on the time-frame observed. While it appears Compound users dwarf that of Aave, reviewing 30 day user growth tells a slightly different story. Compound is still growing users faster than Aave but not quite at the extreme it would appear from the table above. Note also the relatively healthy growth of Sushi vs the stalling growth of Bancor.
Suggestions for Further Exploration
Consider exploring each metric by replacing market cap with fully diluted value (FDV). FDV represents the total value of the project after taking the fully issued total supply into account, which in itself can be useful to compare to market cap as a guide for future issuance sell-pressure.
While Compound shows a compelling argument for value in the above analysis, it's worth considering that its token inflation outpaces Aave. Even then, Aave FDV sits at $6.5B vs Compound FDV of $4.9B.
Exploring FDV presents an interesting reality. Many tokens are being priced at their market cap because that's the value investors are accustomed to viewing on price explorers. Exploring FDV we see some interesting anomalies among tokens with a large total supply. Many of these projects outside the top 100 by market cap that you might ignore are actually top 100 by FDV. Curve is one such example, with a ~$7B FDV, putting it well within the top 100, but by market cap it consistently sits outside of the top 100. As always, a full understanding of valuation metrics and frameworks can uncover alpha.
Uncovering Alpha
This is our weekly segment that briefly discusses some of the most important developments of the prior and upcoming week.
Builder momentum continues as products launch and new versions get released across all major chains.
- Wormhole launches on Solana for cross-chain token bridging. The bi-directional bridge supports Solana, Ethereum, Binance Smart Chain, and Terra. Another step towards a multichain future.
- Hegic launches a complete revamp of its product. Now offering auto-exercising American-style options for ETH and wBTC with gasless trades at size and competitive premiums.
- Tokemak launches its genesis pools. These pools, reserved for participants in the degensis event boast high single-sided APR for ETH and USDC, 216% and 237% respectively. The protocol boasts IL protection and sticky liquidity for its users and protocols it allocates to. Governance is currently voting on which pools/assets it will provide liquidity to next. $OHM is currently leading the vote.
- NFTs continue their historic rally. After 10 days monthly volume has hit $600M, projections sending its monthly volume expectation to $1.8B. This is about 6x growth from last month. In our NFT post from last week we projected 5x growth, off from the now even more inflated 6x expectation.
- Crypto and DeFi continue to watch the actions of the US government with weighted breath. A rider addressing crypto to a major infrastructure bill has passed the senate. Much of the industry has paid attention to the bill as it describes many actors in crypto and DeFi as brokers, entities with increased tax and legal liabilities. Having passed the senate, the bill now heads to the house of reps, the other major body in the United States congress for discussion and voting.
- Handful of hacks, one of which is the largest in DeFi's history. Polynetwork is one of many builders of chain interoperability. The $600M hack represents the largest in DeFi history. Additionally, Popsicle Finance was hacked, draining $25M from one of their Uniswap V3 strategies.
- Convex launches votium. Governance is already difficult to incentivize in crypto, and it also enables more voting power across Curve for CVX holders. Convex's votium seeks to attack some of this problem, allowing token holders to delegate votes.
- L2 options protocol Dopex launches testnet. Options have historically seen very little adoption in DeFi. Dopex has renewed interest in options across DeFi as of late.
- Curve adds permissionless pools. This means any user can add a pool without needing permission from a centralized protocol keyholder or a decentralized governance vote.
- Alchemist partners with Ampleforth. The alchemists are builders of Mistx, an exchange to protect against MEV and other products. Their integration with algo stable Ampleforth adds more strategies for alchemists in their so-called "reward programs."

- Follow us and reach out on Twitter
- Join our Telegram channel
- For on–chain metrics and activity graphs, visit Glassnode Studio
- For automated alerts on core on–chain metrics and activity on exchanges, visit our Glassnode Alerts Twitter
Disclaimer: This report does not provide any investment advice. All data is provided for information purposes only. No investment decision shall be based on the information provided here and you are solely responsible for your own investment decisions.