Following the Smart Money: A Study of Long-Term Holders
A deep dive analysis into the market psychology and fractals associated with Bitcoin Long-Term Holders.


Tracking supply and demand with newfound vision
One of the exciting prospects in on-chain analysis is the ability to visualize the tectonic forces of underlying supply and demand governing the Bitcoin market. For the first time in finance, we can observe the near real-time transfer of an asset from stronger to weaker hands in a bull run, the accumulation by long-term investors in a bear market, and the fluctuating profit-and-loss of entities day to day.
The data is public, but the interpretation is nuanced.
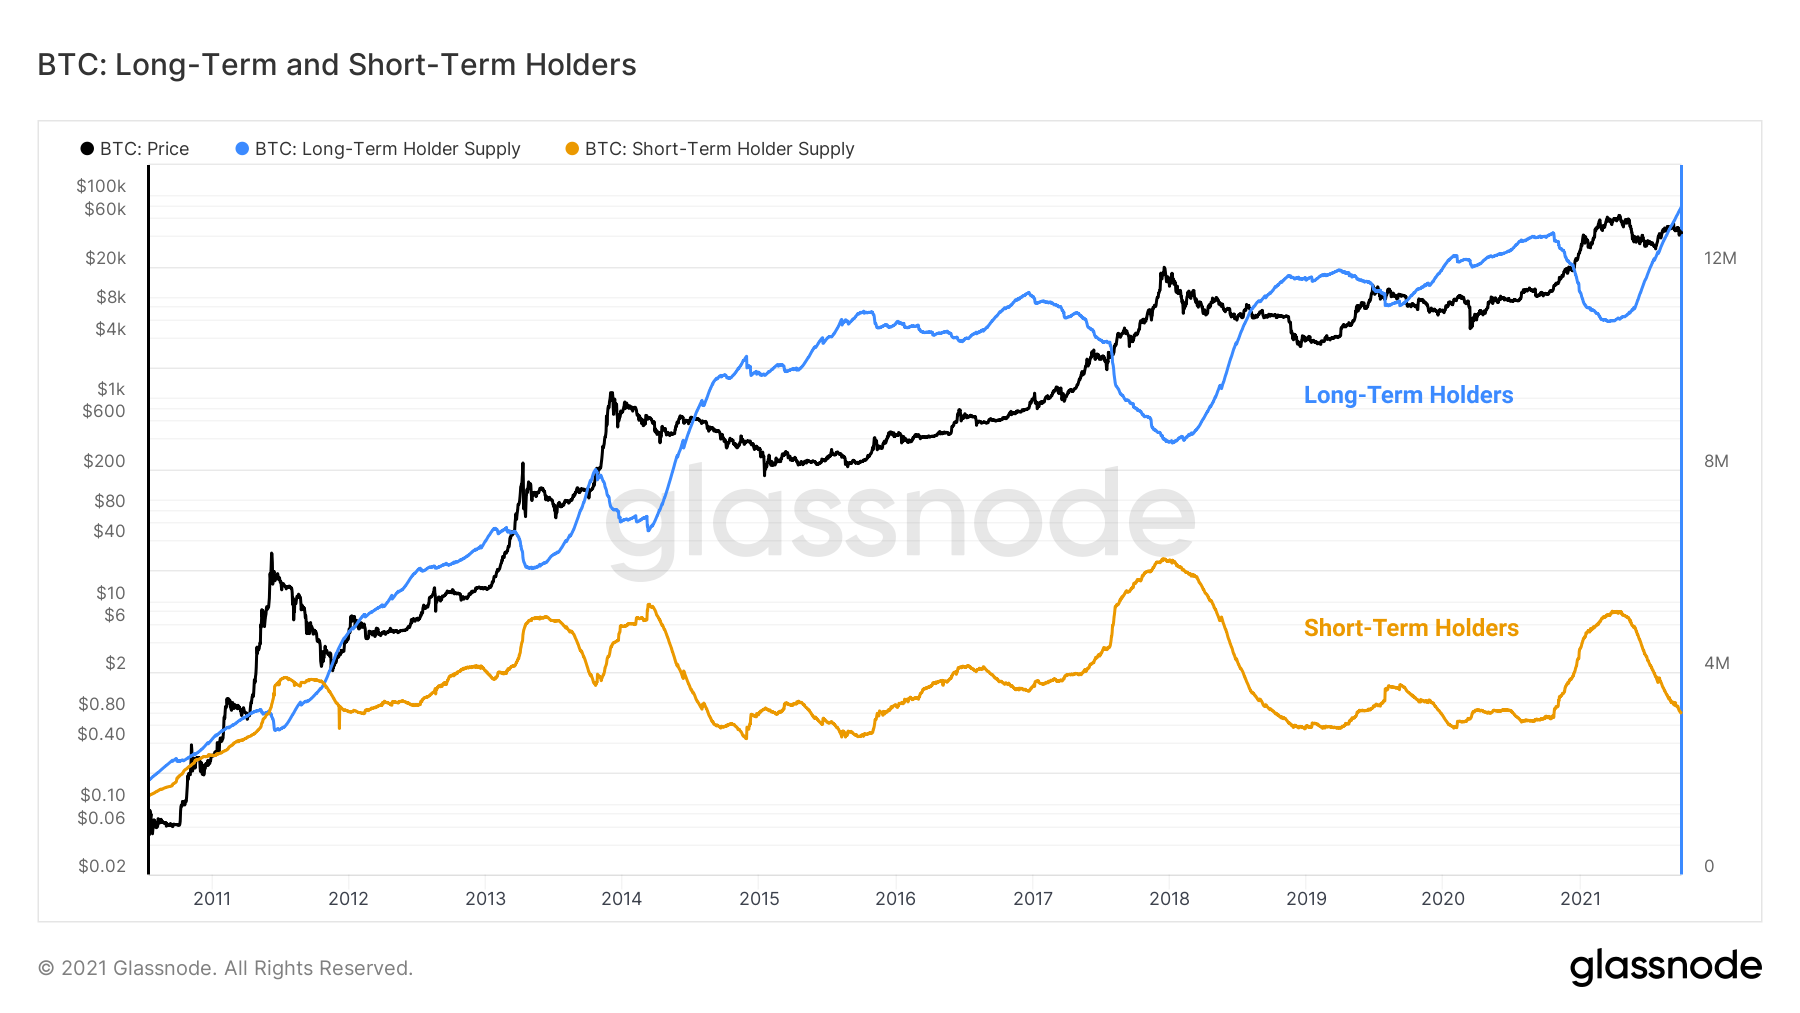
Within this newfound transparency is the symbiotic relationship between long- and short-term investors— a perpetual tug-of-war between high and low time preferences that characterizes unique phases of market cycles. By tracking the movement of supply between these two groups, we gain measurable insights that show us when macro trend shifts are underway.
We can visually track the cyclical nature of long- and short-term holder supply.
Life Cycle of Coins
First, let's define Long-Term (LTH) and Short-Term Holders (STH). Based on prior analysis, we determined that a coin becomes statistically unlikely to be spent once it crosses the 155-day mark, or approximately five months. Using this data point as a threshold, we delineate the two cohorts of Short-Term and Long-Term Holders.
To improve visualization, we utilize a smoothing curve, with a midpoint of 155 days and a transition width of 10 days, to model the LTH-STH threshold (details here). See Figure 2 below.
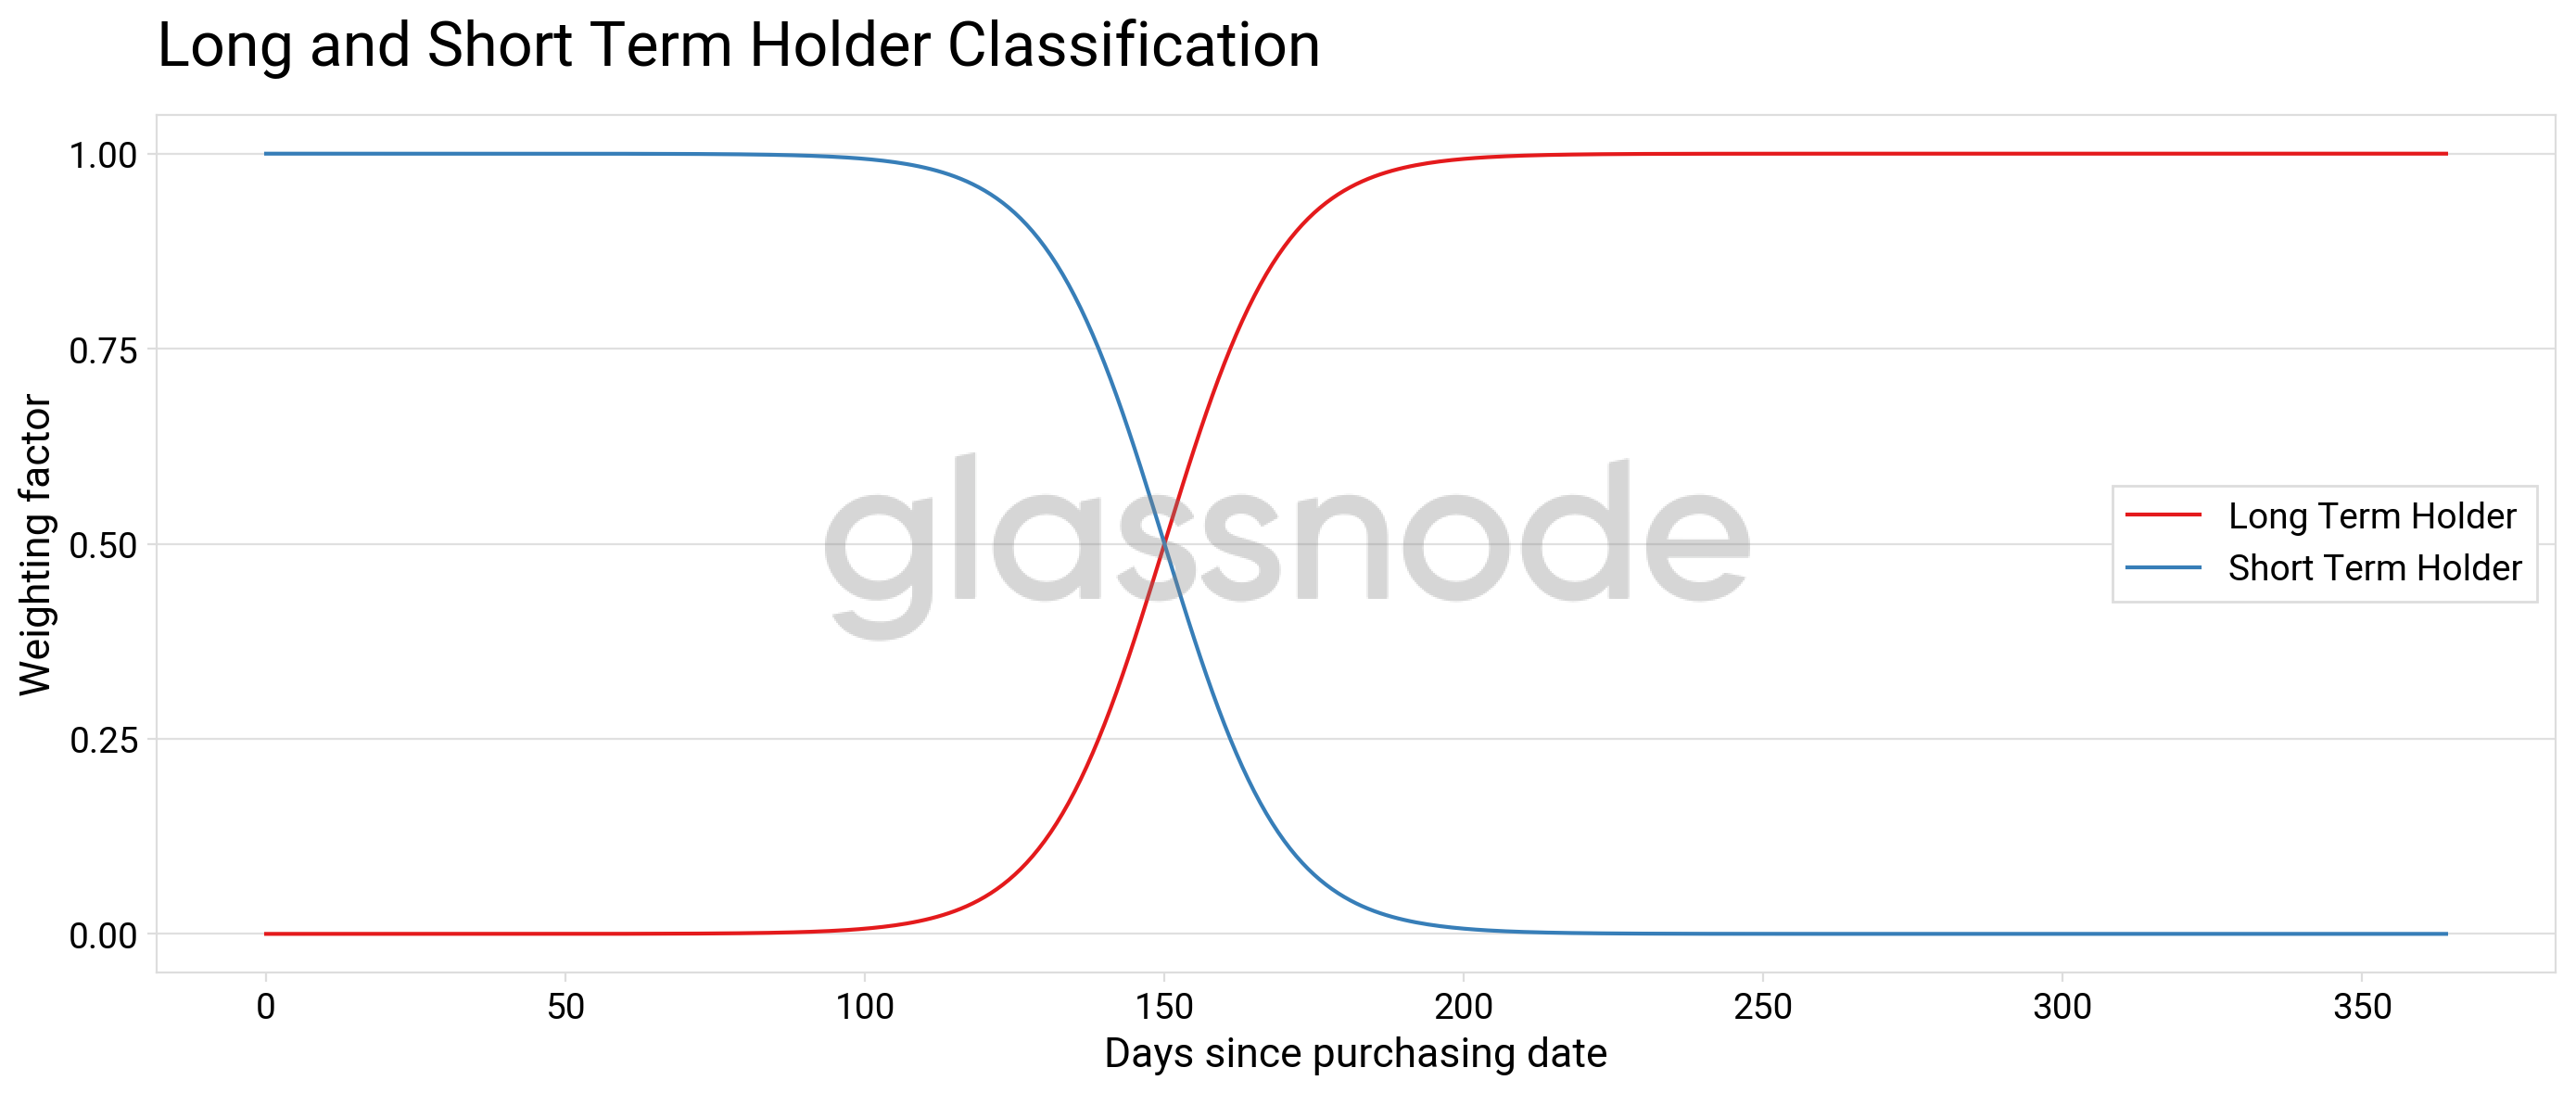
When a user purchases a coin, it is immediately added to Short-Term Holder Supply, where it begins aging. If the coin remains dormant for ~155 days, it matures out of Short-Term Holder Supply and into Long-Term Holder Supply. Likewise, when a long-term held coin is sold, it leaves Long-Term Holder Supply and immediately enters Short-Term Holder Supply as its lifespan begins anew at zero.
By the nature of this maturity condition:
- LTH Supply metrics acquire new coins slowly, as they must age and remain dormant long enough to cross the ~155-day threshold. Thus, interpretation of coin maturation requires deeper analysis (with HODL waves providing a useful intermediate tool).
- Conversely, LTH Supply metrics lose coins quickly, as their lifespan resets to zero immediately upon sale. They change to Short-Term Holder hands and start aging again.
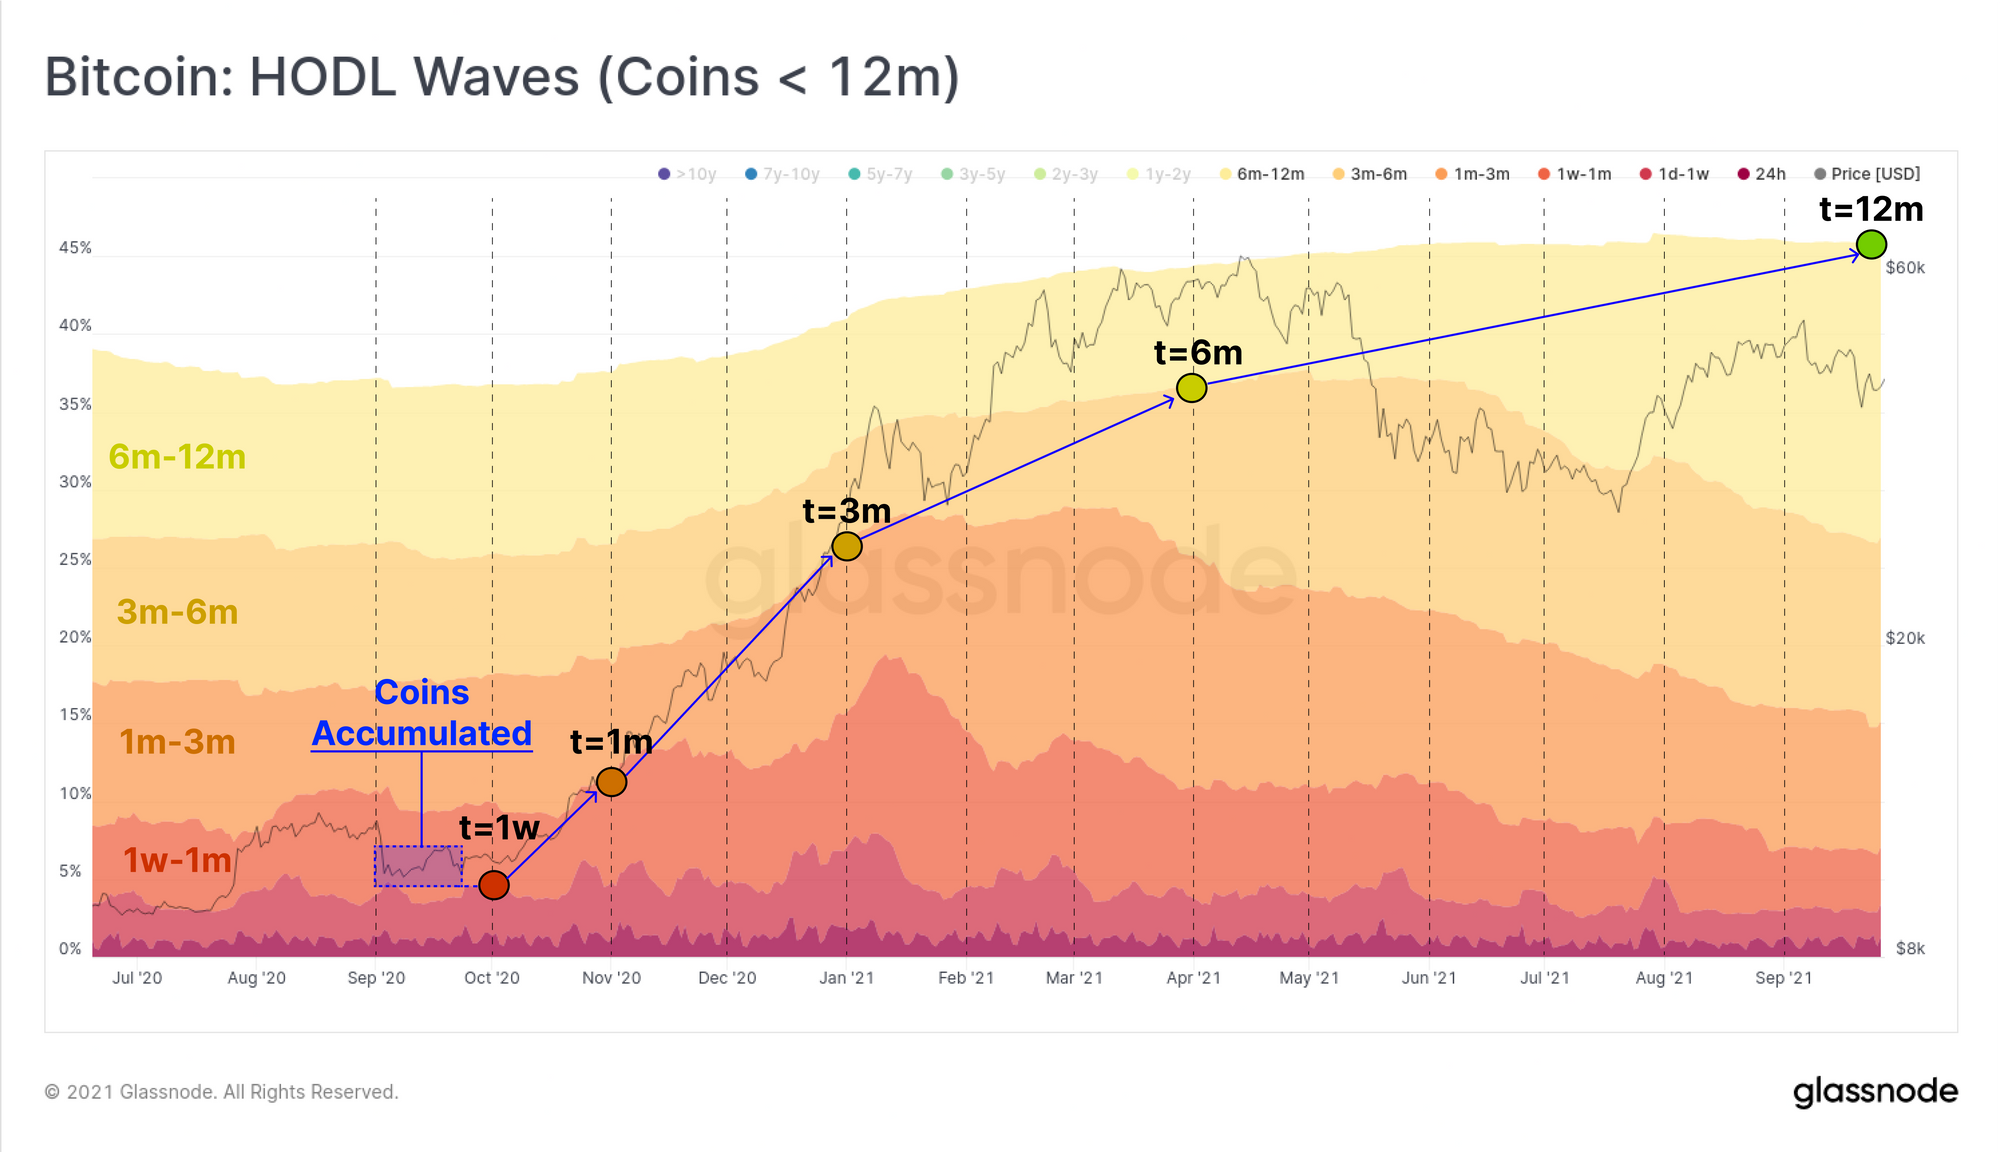
The HODL Waves can be used to visualize and demonstrate this aging process for a set of coins accumulated in September 2020. We can see the coin volume progressively aging, visualized by swelling of more senior age bands over time t (see Figure 3).
It is a market dynamic that plays out reliably across all historical Bitcoin bull/bear cycles:
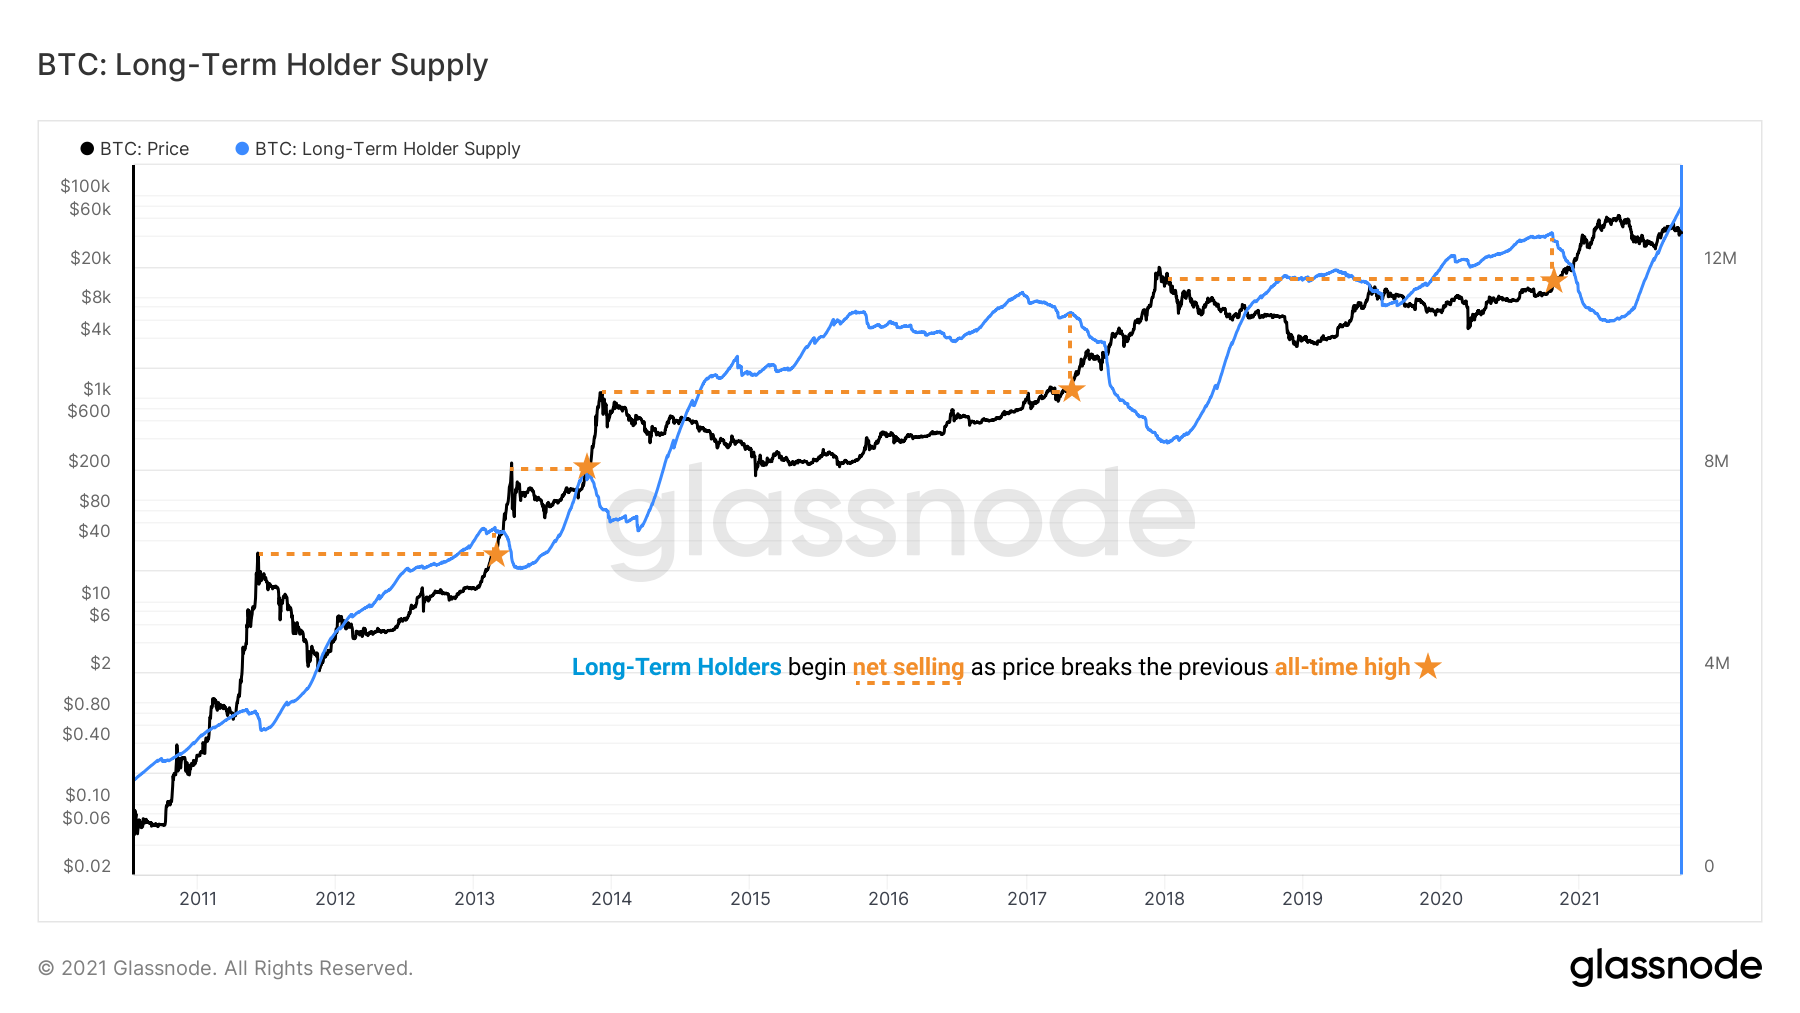
- Higher prices bring increased demand volume, strong hands sell to new investors— often as price breaks the previous high— and realize gains into market strength (see Figure 4).
- Price is propelled upward until overhead supply exhausts demand, and the market eventually breaks down, usually swiftly. By this point, coins are aging once again and the count of Long-Term Holder Supply grows (see Figure 5).
Long-Term Holders rotate out of positions in bull markets, typically as price breaks the previous high.
Eventually, Long-Term Holders finish spending and resume net accumulation again. This commonly signals the bull run is over.
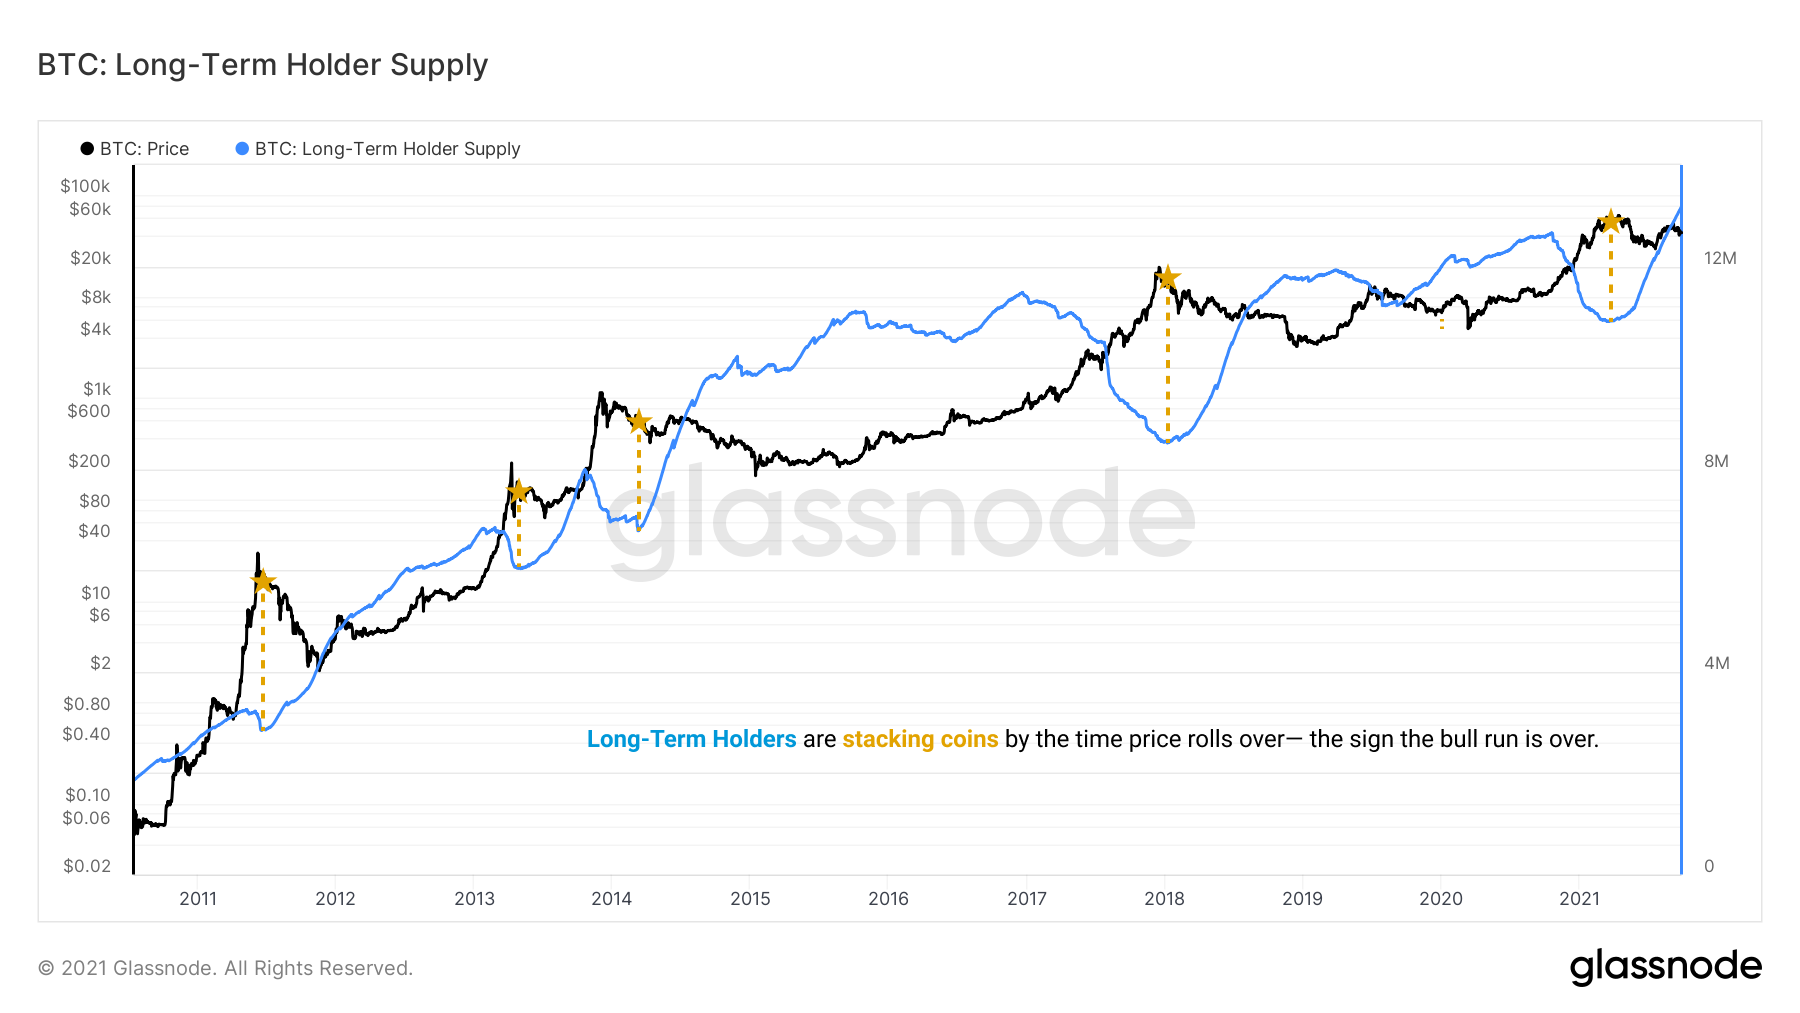
This is a tried and true historical pattern. In addition, a keen observer may note that virtually every market top is followed soon after by a reversal in the downtrend of Long-Term Holder Supply.
Put another way: Long-Term Holders consistently flip net positive and begin re-accumulation soon after each macro market top. This includes coins accumulated during the final stages of the bull market and can be considered a reliable confirmation of a broader macro shift.
A Rising Long-Term Floor
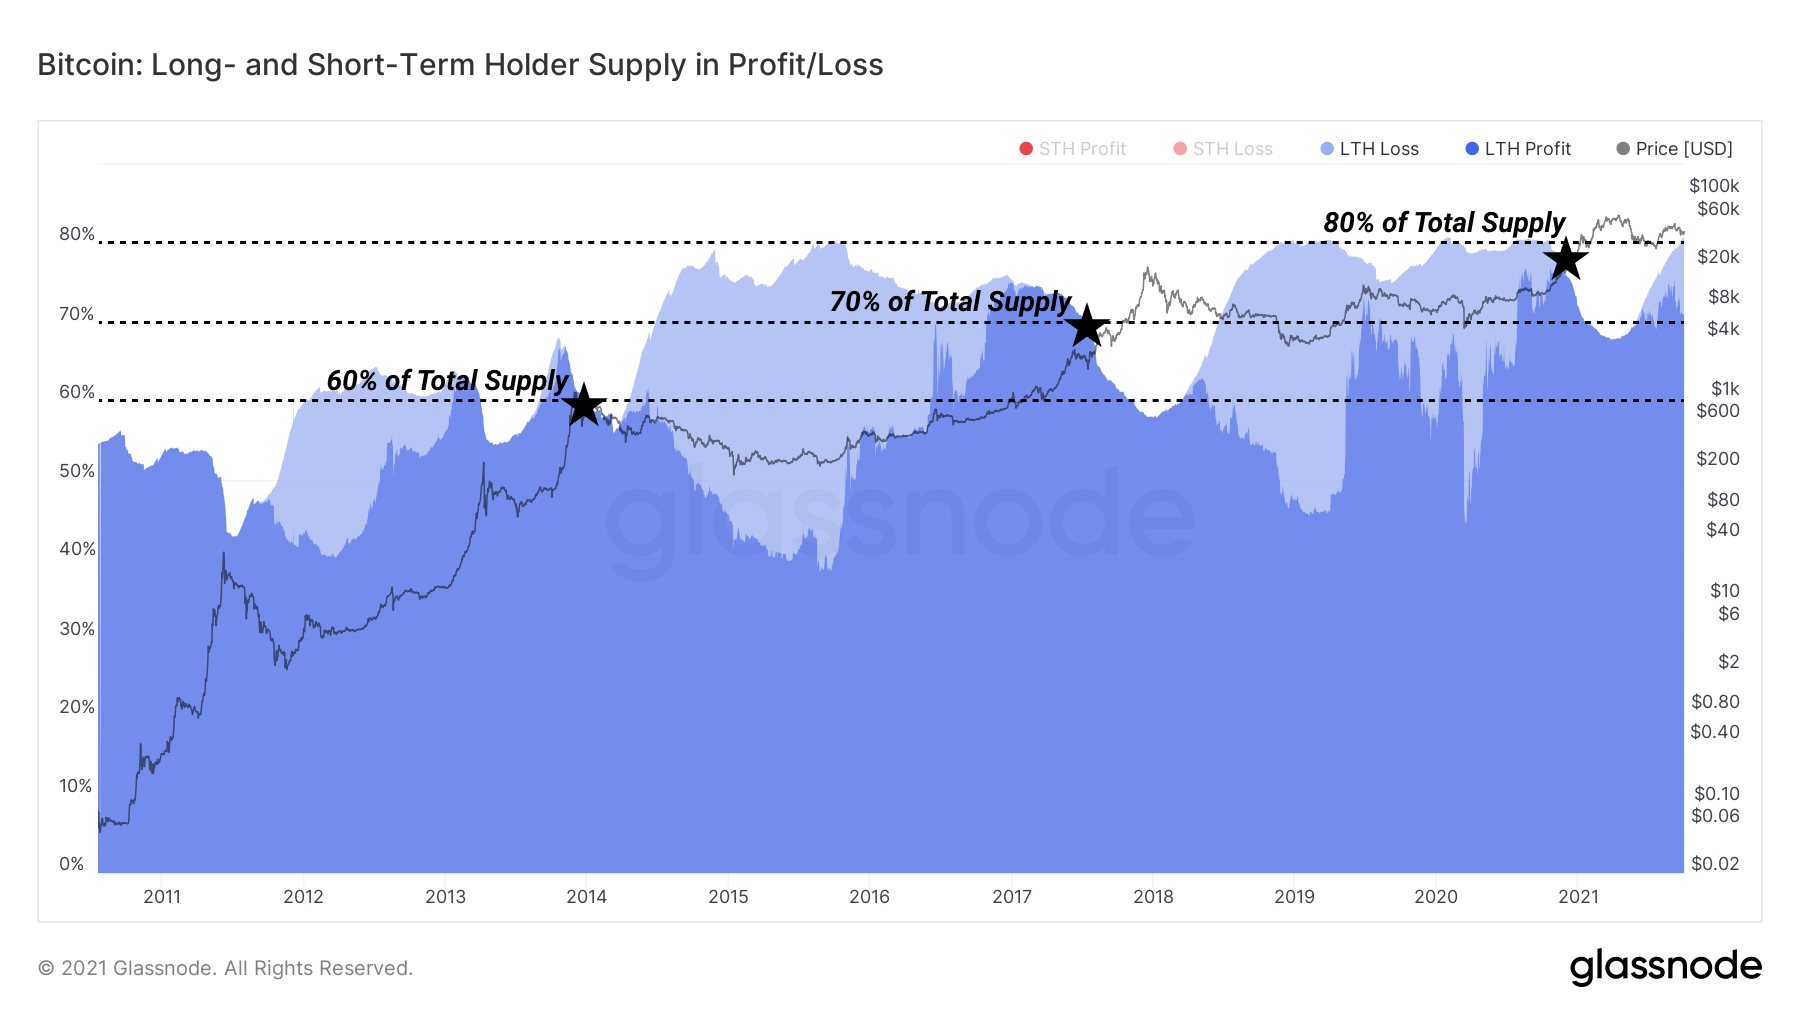
Another observable pattern with Long-Term Holders is their step-wise capture of greater portions of relative supply (approximately 10%) with each cycle (see Figure 6). While many coins are spent into rallies and transferred to younger hands, a more significant percentage remain dormant and further add to the balance of Long-Term Holders when they resume accumulation on the back side of the run.
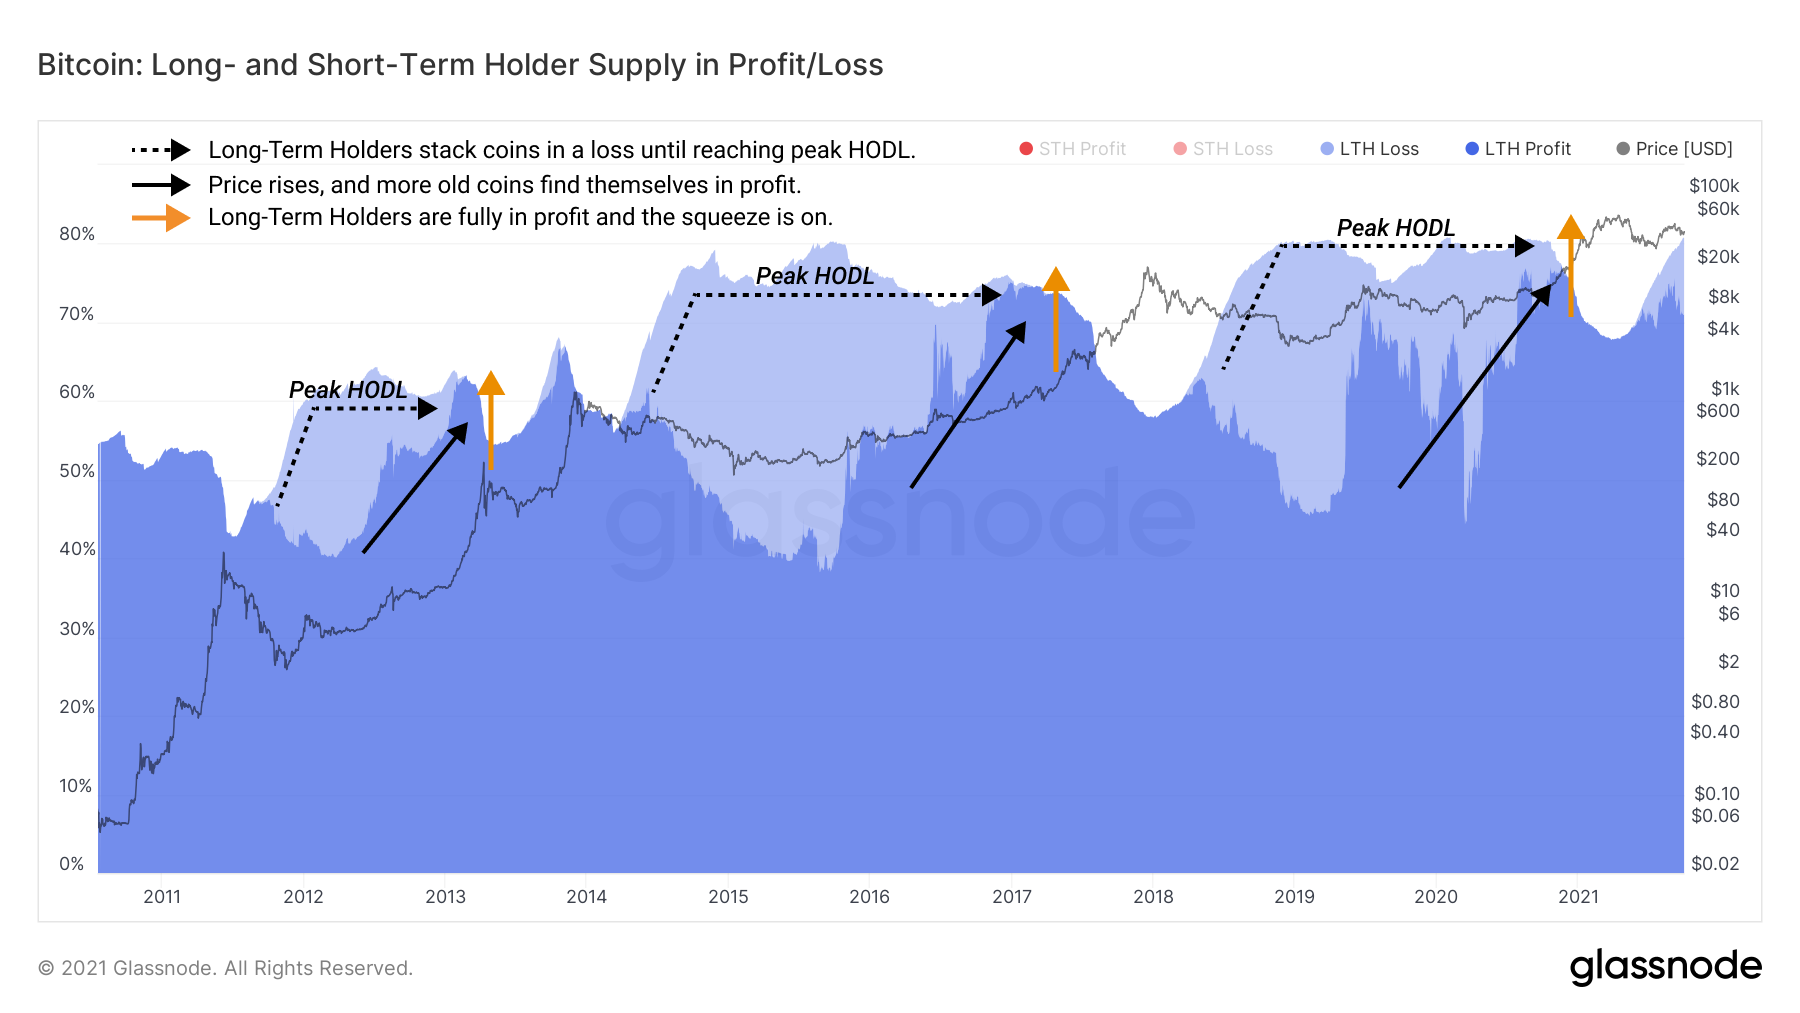
During each cyclical expansion of Long-Term Holder Supply, the coins bought in the late bull and early bear market are mostly in loss (light blue).
This group eventually reaches "peak HODL," where their relative supply flattens out as they wait for price to rise and bring their coins into profit. This can be visualized by the shift from light blue to dark blue in the supply chart below (see Figure 7). Typically, when price rises towards the all-time-high, the bull run is in motion, and a supply squeeze begins.
Putting a Bow on it
The beautiful transparency of Bitcoin's immutable public ledger lets us witness, for the first time in financial markets, the oscillation of an asset's supply between high and low time preference investors. Many books have been written about the nature of markets and the human psychology underpinning them, and now we can provably measure this free market behavior in the data held by Bitcoin's ledger.
Bitcoin insights, like the flow of supply between Long-Term and Short-Term Holders through market cycles, is what excites many of us in on-chain analytics. It provides unprecedented insight into the supply dynamics and market sentiment associated with Bitcoin as a monetary network and a store of value. The study of the Bitcoin ledger may even prove to be a reflection, an immutable record of human market psychology, as the asset progresses from a single laptop to becoming the world's reserve asset.