Glassnotes Issue #1
Glassnotes is a newsletter outlining the most recent on-chain market intelligence. It features analyses and commentary on the state of digital asset markets.


Introduction
Welcome to the first issue of Glassnotes, your source of on-chain market intelligence, brought to you by Glassnode.
On Monday, we launched our comprehensive product suite, including the Glassnode API, Glassnode Studio, and Glassnode Insights.
Based on the on-chain metrics available through these products, Glassnotes will outline the most recent crypto network updates, and will feature analyses and commentary on the state of the market to provide the fundamental insights you need to invest confidently in digital asset markets.
Subscribe to Glassnotes to receive regular industry updates directly in your inbox.
Weekly Ecosystem Updates
The raw on-chain data for these metrics are sourced from our Glassnode API. Further visualisations can be found on the Glassnode Studio.
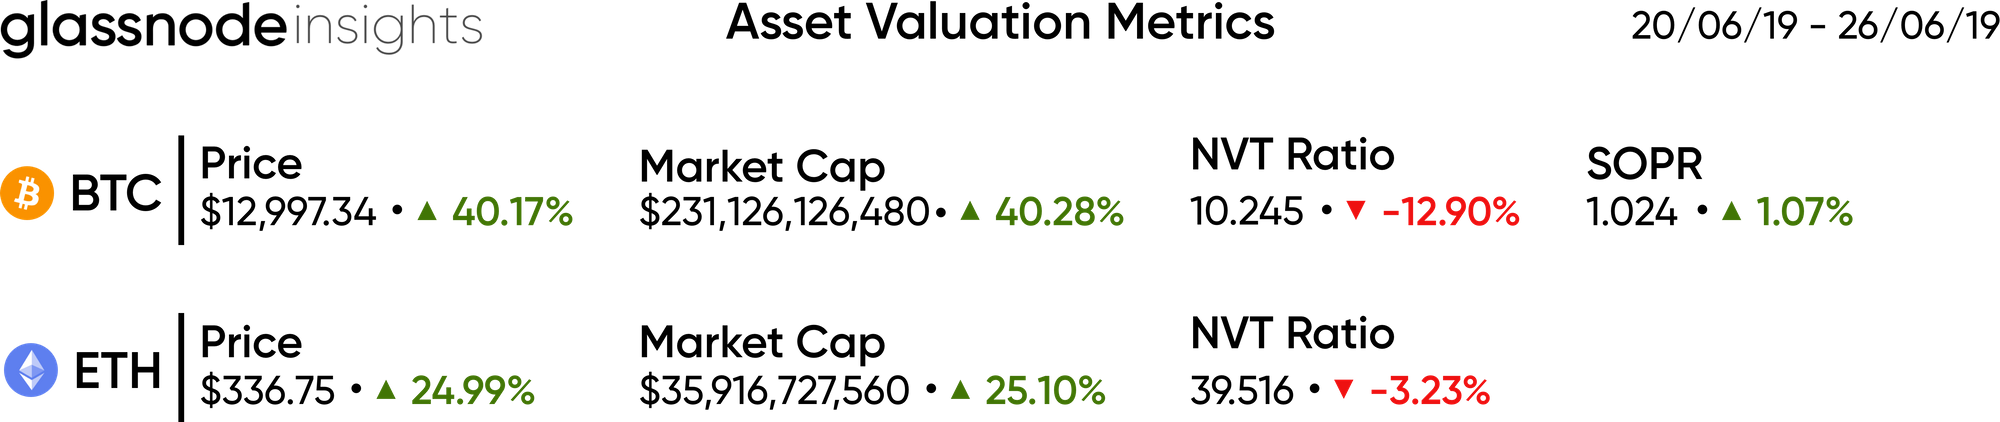
Asset Valuation Metrics
Valuation-based metrics take on-chain data and compare these with market data (such as price) to provide a clearer picture of the forces and trends driving the market.
Core On-Chain Metrics
Core on-chain metrics look at the health of a given network as a whole through the lens of activity and engagement happening on the blockchain itself.

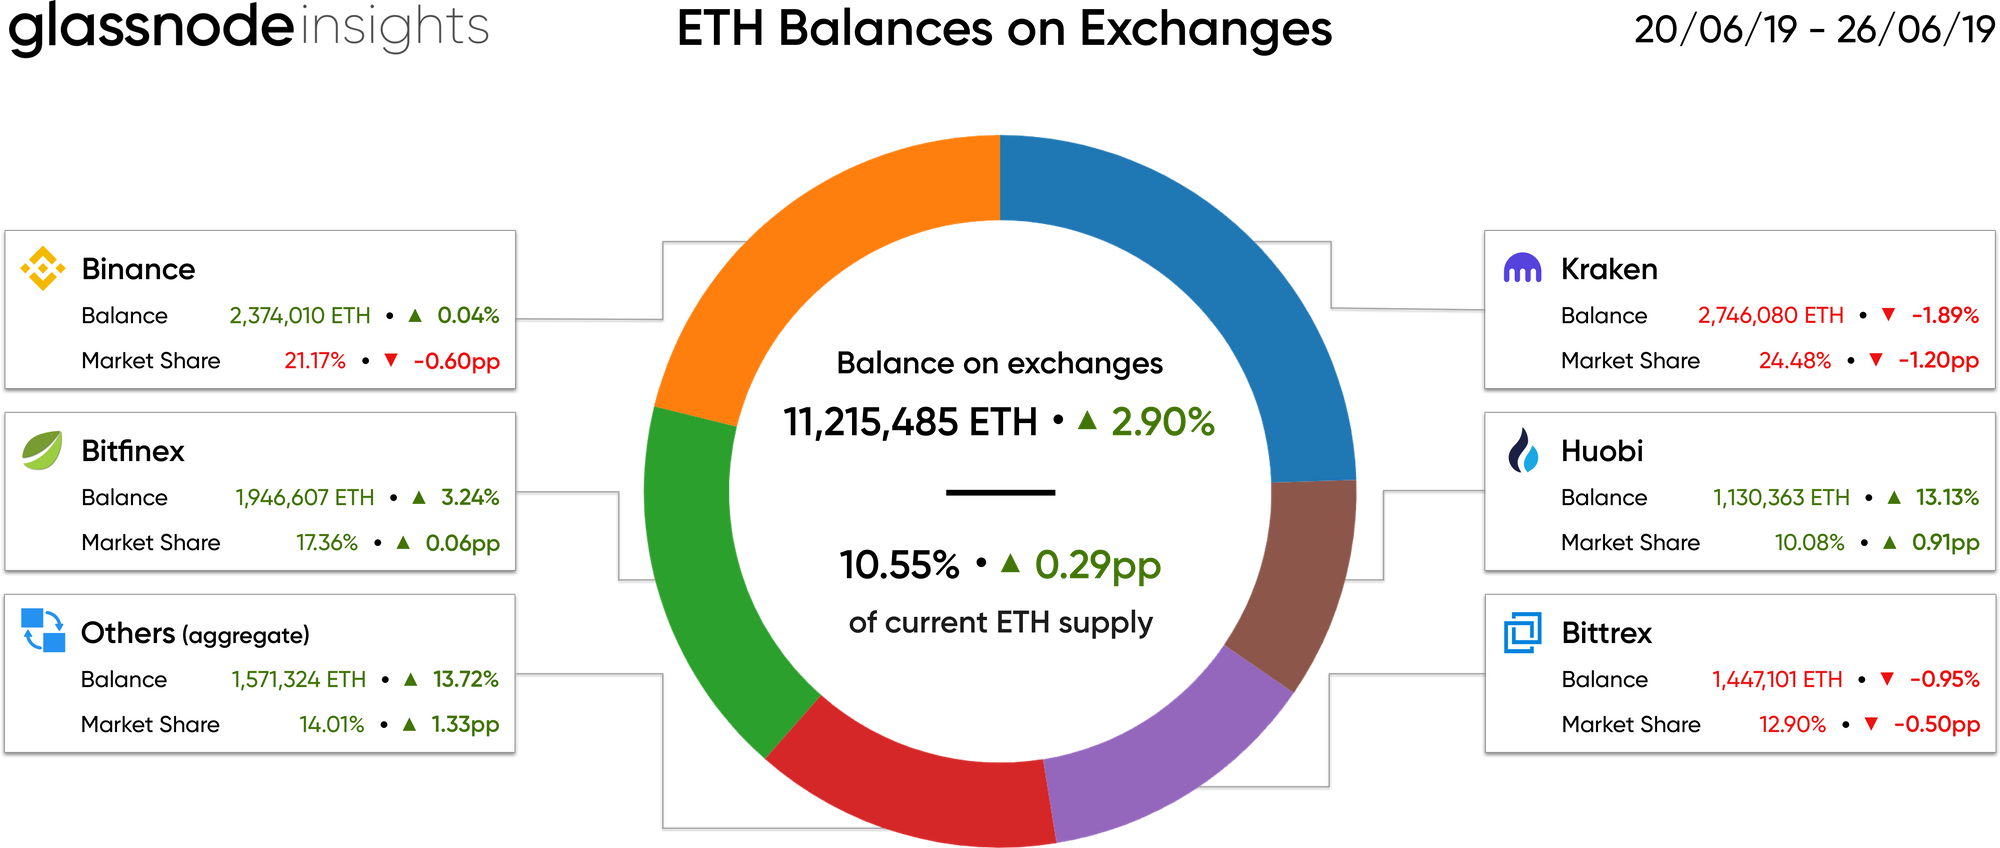
Exchange Distribution
The flow of funds moving between exchanges and privately controlled wallets often highlights imminent market events.
Ecosystem Feature: On-Chain Analysis of the Recent BTC Bull Run
With BTC up over 40% this week, traders, investors, and industry commentators are getting extremely excited, with much speculation about what caused this latest increase in price.
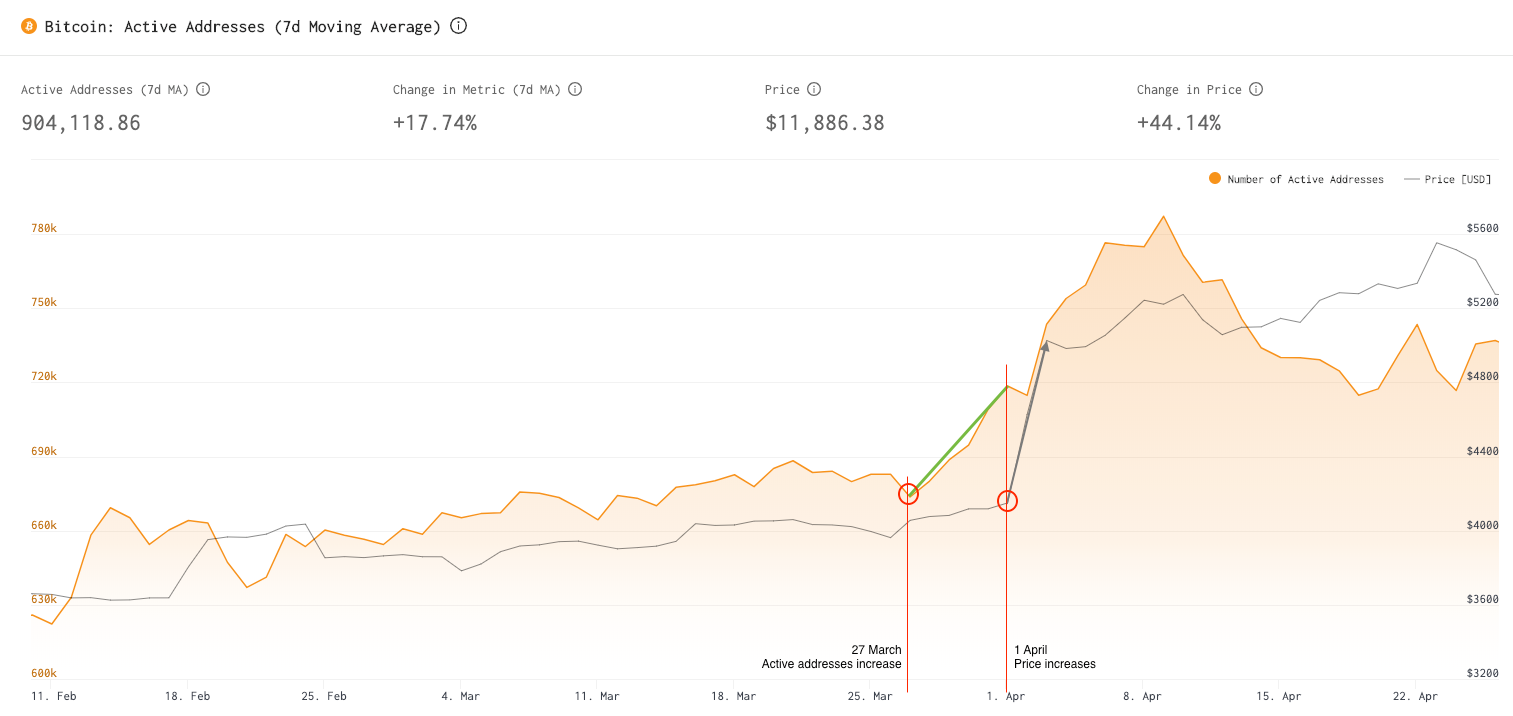
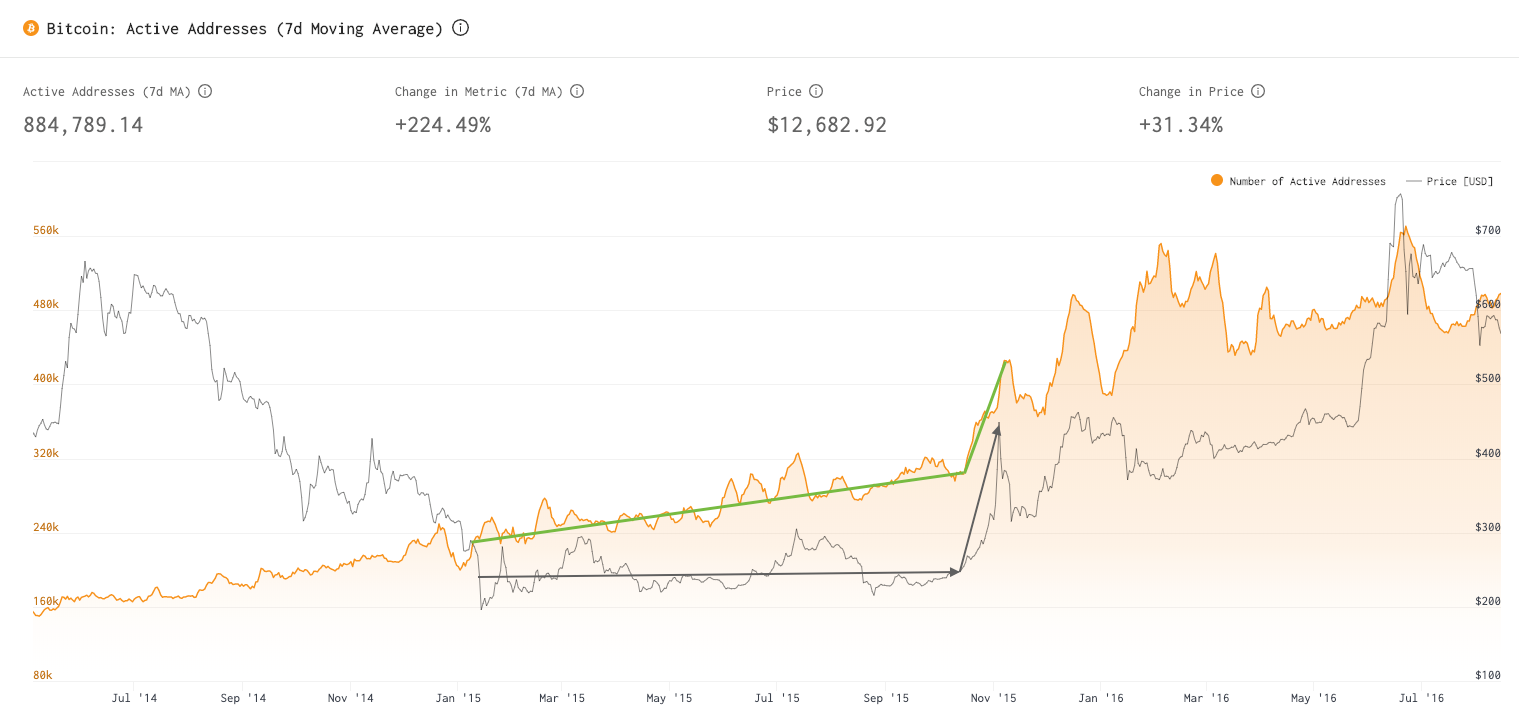
Active Addresses
Since January 2019, when BTC was hovering around its lowest price point in 15 months, the network has seen a steady increase in active addresses. This increase followed a continued upward linear trajectory, signalling an upcoming trend reversal almost 3 months before a meaningful BTC price increase was seen.
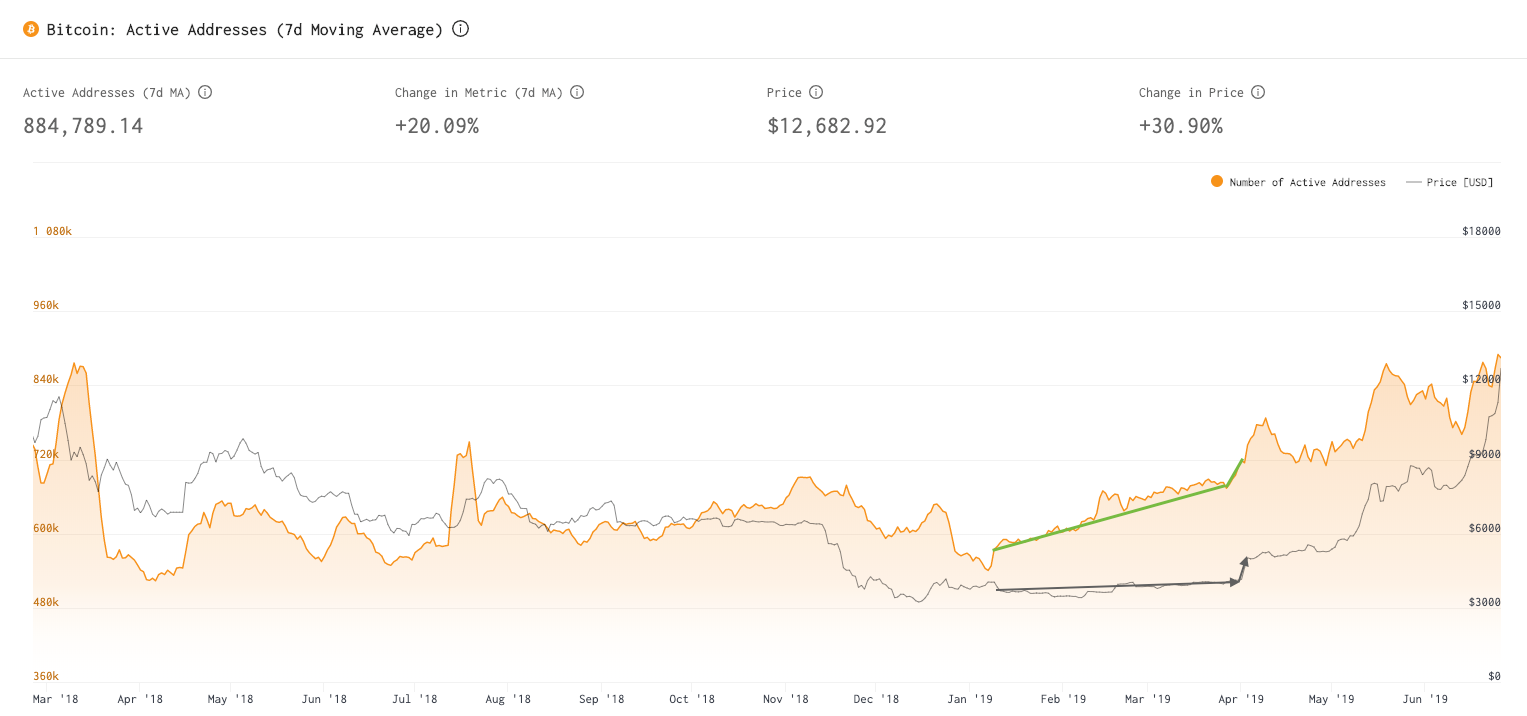
As another indicator, 5 days before the April 2019 price increase, active addresses started to increase even more rapidly, suggesting imminent upward price movement.
Historical data show that during sideways markets, sustained increases in active addresses may indicate an upcoming positive trend. During the “long winter” of 2015, active addresses increased linearly while price continued to move sideways. Following this, a sharp uptick in active addresses and then price occurred.
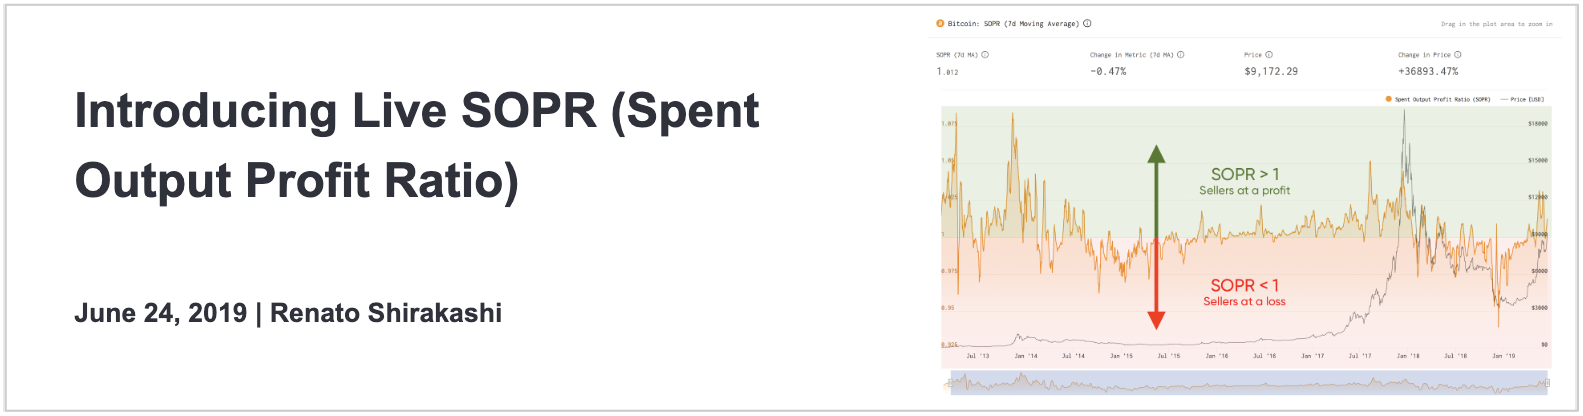
SOPR (Spent Output Profit Ratio) Analysis
Another interesting lens through which to examine the price increase is the SOPR (Spent Output Profit Ratio) metric, recently launched on Glassnode Studio. By comparing price with on-chain transaction data, it indicates when market participants are, on average, selling at a profit or a loss.
Renato Shirakashi, who recently joined the Glassnode team, explained in a recent article how SOPR can help predict price corrections in both bull and bear markets.
Looking at historical data, he examines how a SOPR value of greater than 1 in a bear market precipitates a sharp downward price correction, while a value of less than 1 in a bull market triggers an upward correction.
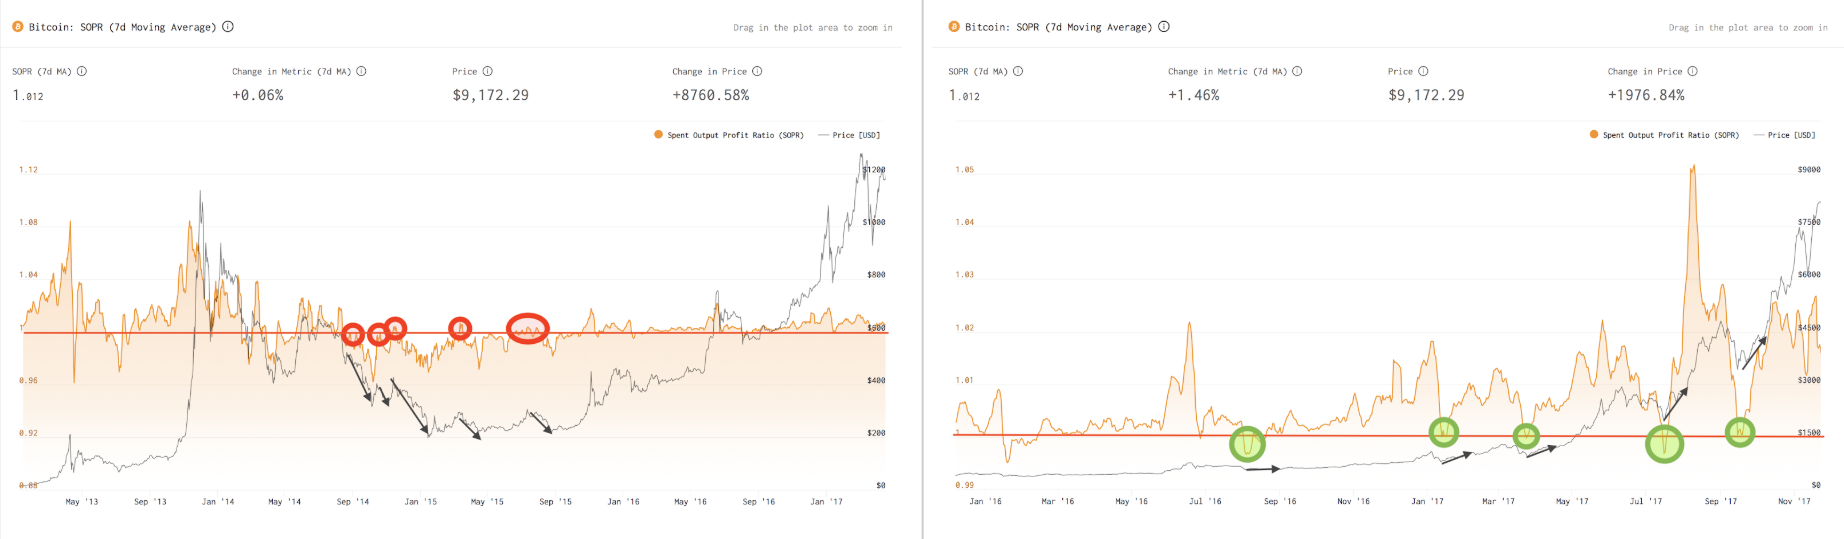
Looking at more recent data, we see this trend continuing throughout the past 18 months. During this extended bear market, whenever SOPR rose over 1, the market reacted with a rapid downward correction. During these times, price is likely driven down due to increased supply as people rush to sell at break-even.
SOPR can be used not only to predict rapid price movements in both bull and bear markets, but also to determine whether the market as a whole is bullish or bearish. The above trend shifted in April this year, indicating a trend reversal; SOPR broke above 1 for the first time in 4 months - and for the first time since the last bull market over a year ago, this event didn't trigger a sell-off.
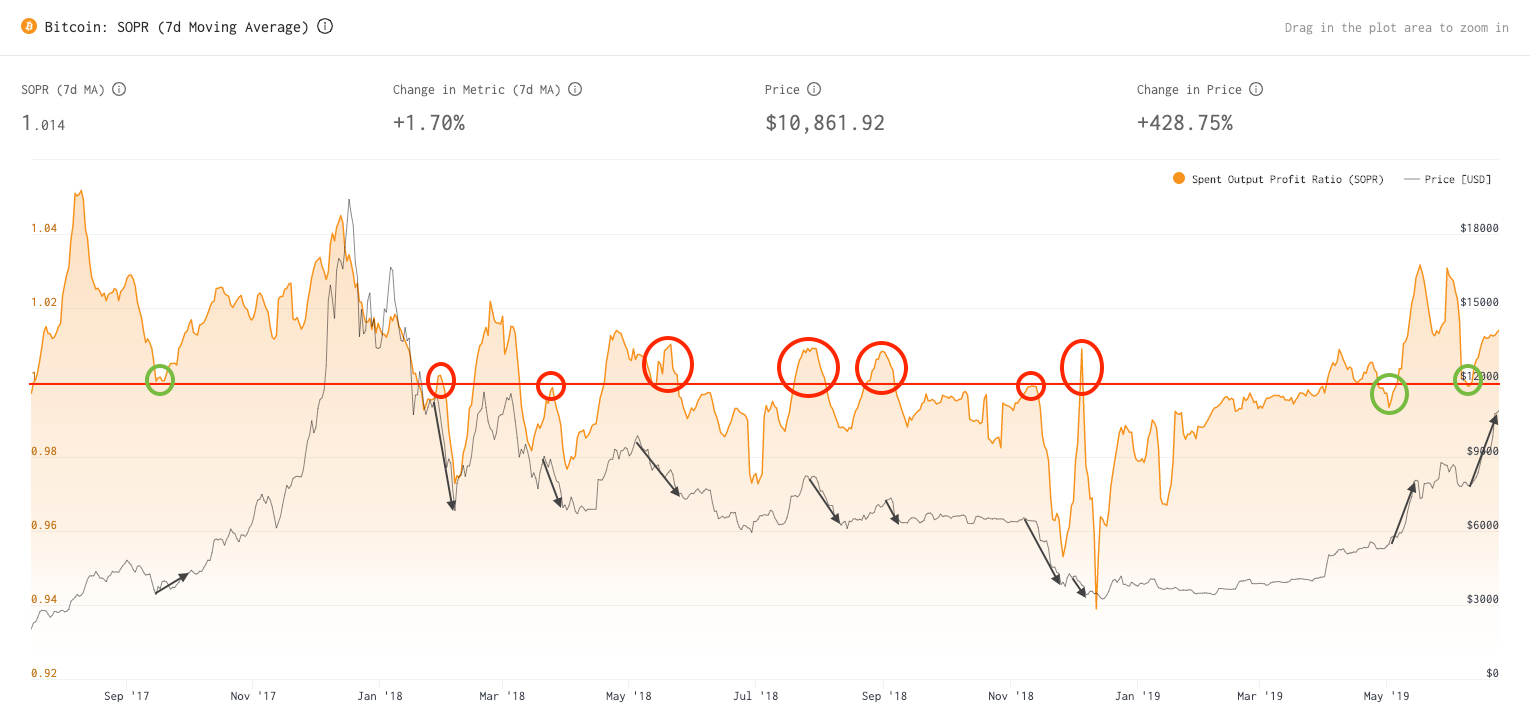
Investors aware of this trend could have seen SOPR rise above 1 in April without triggering a price drop, and interpreted this as signalling an upcoming trend reversal. Anyone who bought at this time would have seen at least 160% gains, or 2.6x as of time of publication.
This early signal of a trend reversal was confirmed in late April this year when a drop in SOPR below 1 triggered a price increase. This occurred again in June, strongly suggesting that the overall trend has shifted; instead of scrambling to sell at break-even, BTC holders appear to be HODLing in anticipation of further price increases.
It should be noted that we can still expect to see a downward correction after this week's run, as the outsized returns will drive many people to sell. However, SOPR predicts that the overall trend remains positive; after a brief downturn, markets will likely continue to rise.
As we release more on-chain metrics, we will be able to demonstrate even more market trends that may reveal crucial insights for investors. Stay tuned, and subscribe to Glassnotes to receive these updates regularly.
Glassnode Updates
Product Updates
- Our recent product launch includes the Glassnode API, Glassnode Studio, and Glassnode Insights. Read more about the products here:
- We have also released live and historical data for SOPR, viewable on Glassnode Studio and available via our API.
- We plan on regularly releasing new on-chain metrics through our Studio and API, which we will be announcing periodically on Glassnode Insights.
Company Updates
- We are excited to be relocating from our Kreuzberg offices next week to a brand new office in WeWork at Potsdamer Platz. Get in touch if you're in Berlin and would like to meet us.
- Over the past week, we have welcomed two new members to our team: Renato Shirakashi (On-Chain Analyst), and Liesl Eichholz (Growth Strategist).
- We are hiring for a range of roles in Berlin. Visit our Careers page to check out our open roles, or send us a speculative application.

- Follow us and reach out on Twitter
- For on–chain metrics and activity graphs, visit Glassnode Studio
- For automated alerts on core on–chain metrics and activity on exchanges, visit our Glassnode Alerts Twitter
Disclaimer: This report does not provide any investment advice. All data is provided for information purposes only. No investment decision shall be based on the information provided here and you are solely responsible for your own investment decisions.