Estimating the Cost of Bitcoin Production
The Bitcoin difficulty adjustment is one of the most remarkable of Satoshi's innovations, creating a system that autonomously seeks equilibrium in the mining sector. In this article, we estimate the cost of production, and derive several metrics describing the cyclical nature of the mining market.


Miners are an essential entity within the Bitcoin network, responsible for the building and ordering of blocks, and the defence against reorganisation of the chain. As a reward, miners receive newly issued coins, and transaction fees. As such, the Mining cohort represents the production side of Bitcoin, and operates within a hyper-competitive industry of bidding for Bitcoin (BTC denominated revenue) with power, CAPEX, and OPEX (fiat currency denominated costs).
In this report, we will explore the dynamic relationship between Miner profitability, and issuance production, in an attempt to obtain a deeper understanding of the complex interplay between between these essential, yet opposing economic factors. We will start with the basic metrics of hashrate and difficulty, and then convert these into tools for modelling the cost of BTC production.
🪟 View all charts covered in this report in This Dashboard.
Hashrate Generation
The network Hashrate can be considered as the number of attempts miners make in aggregate, per second, to find a valid block hash. The observed hashrate is generated by millions of ASIC machines computing many trillions of SHA-256 hashes each second. The chart below shows the estimated number of modern rigs (assuming a single device fleet) would be required to generate the observed hashrate, with counts in the millions of ASIC devices.
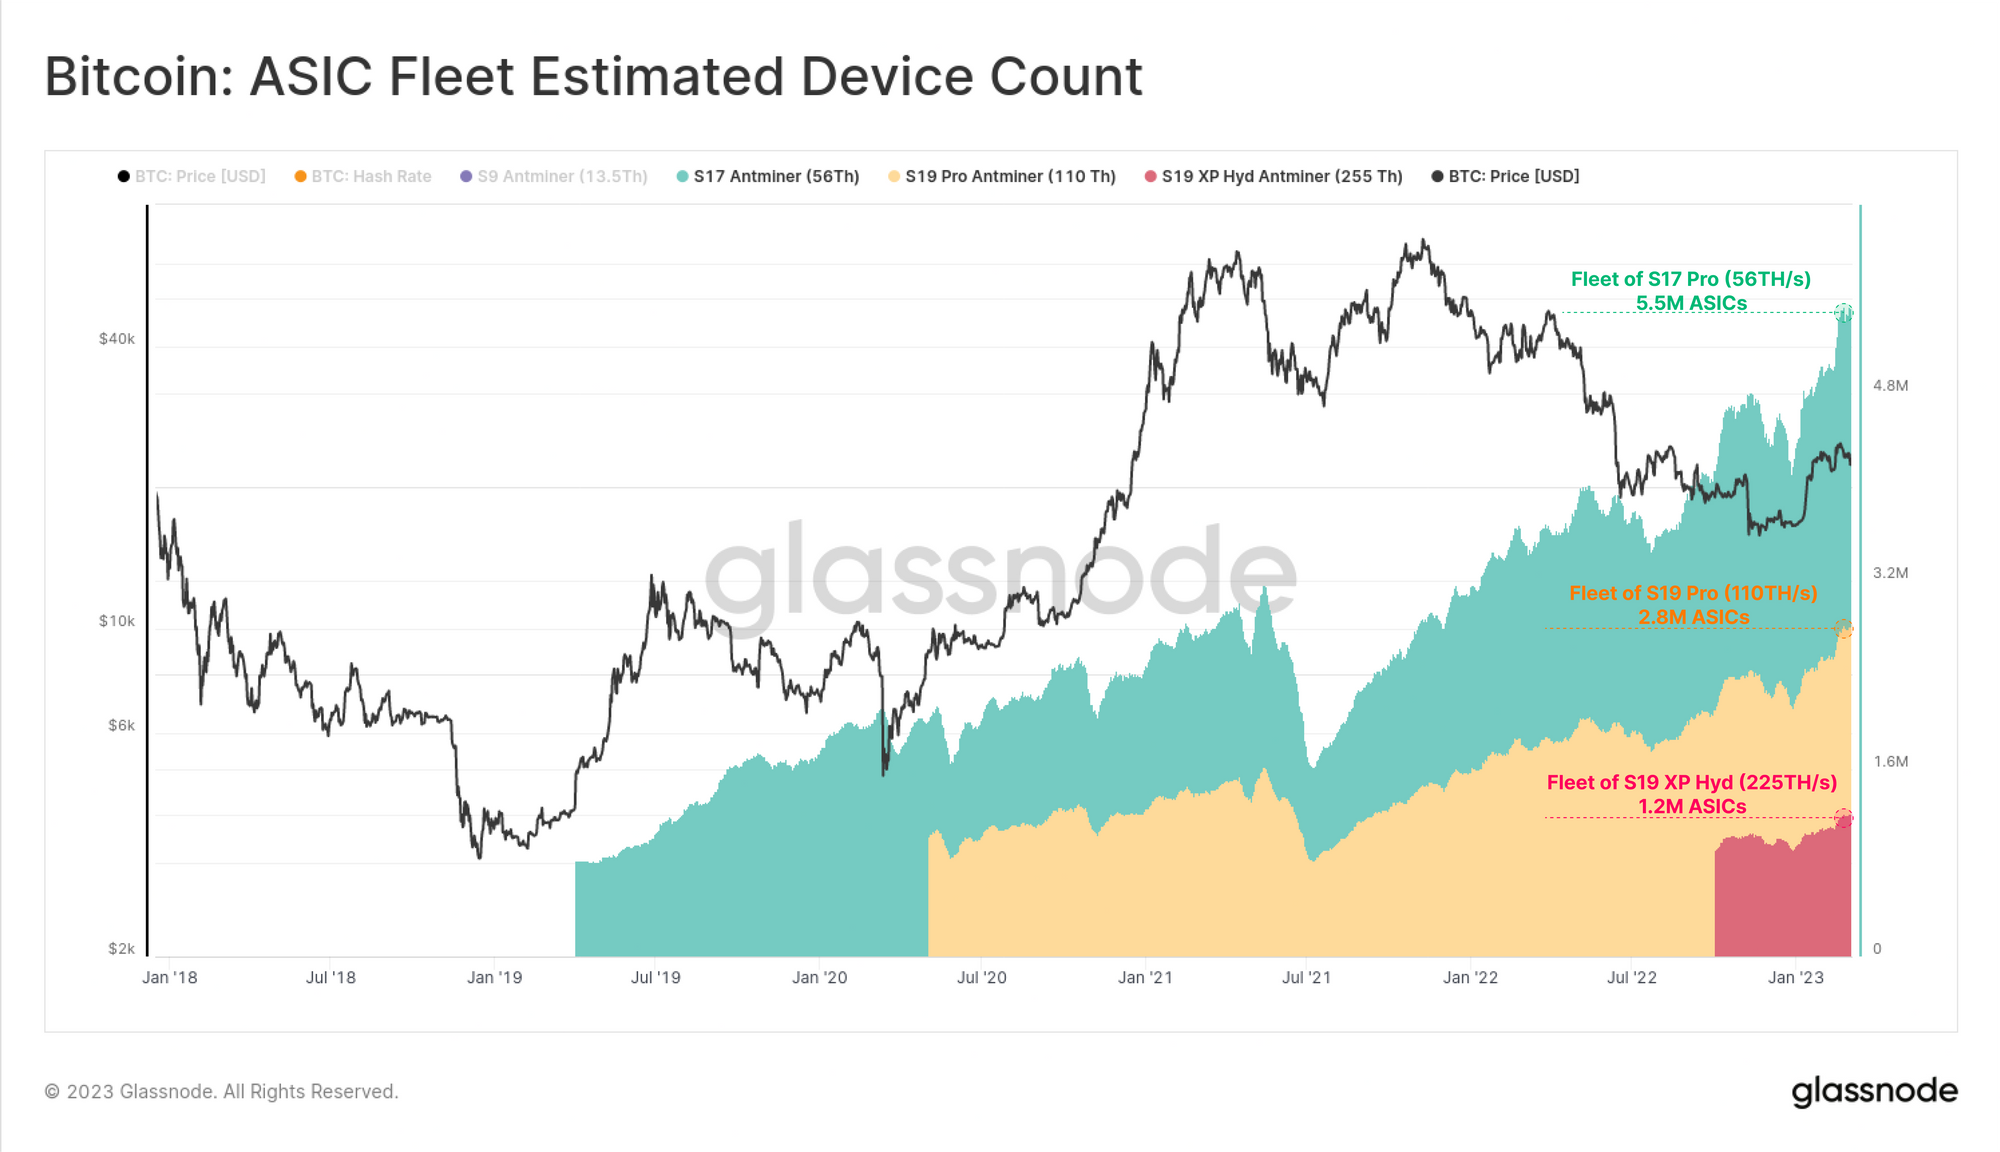
Therefore, Hashrate can be considered as a composite expression of both mining participation, and the generational efficiency of operational ASIC rigs in the fleet. As miners operate in a diverse market for power and hardware, the aggregate hashrate is a reflection of many unique and geographically dispersed mining strategies.
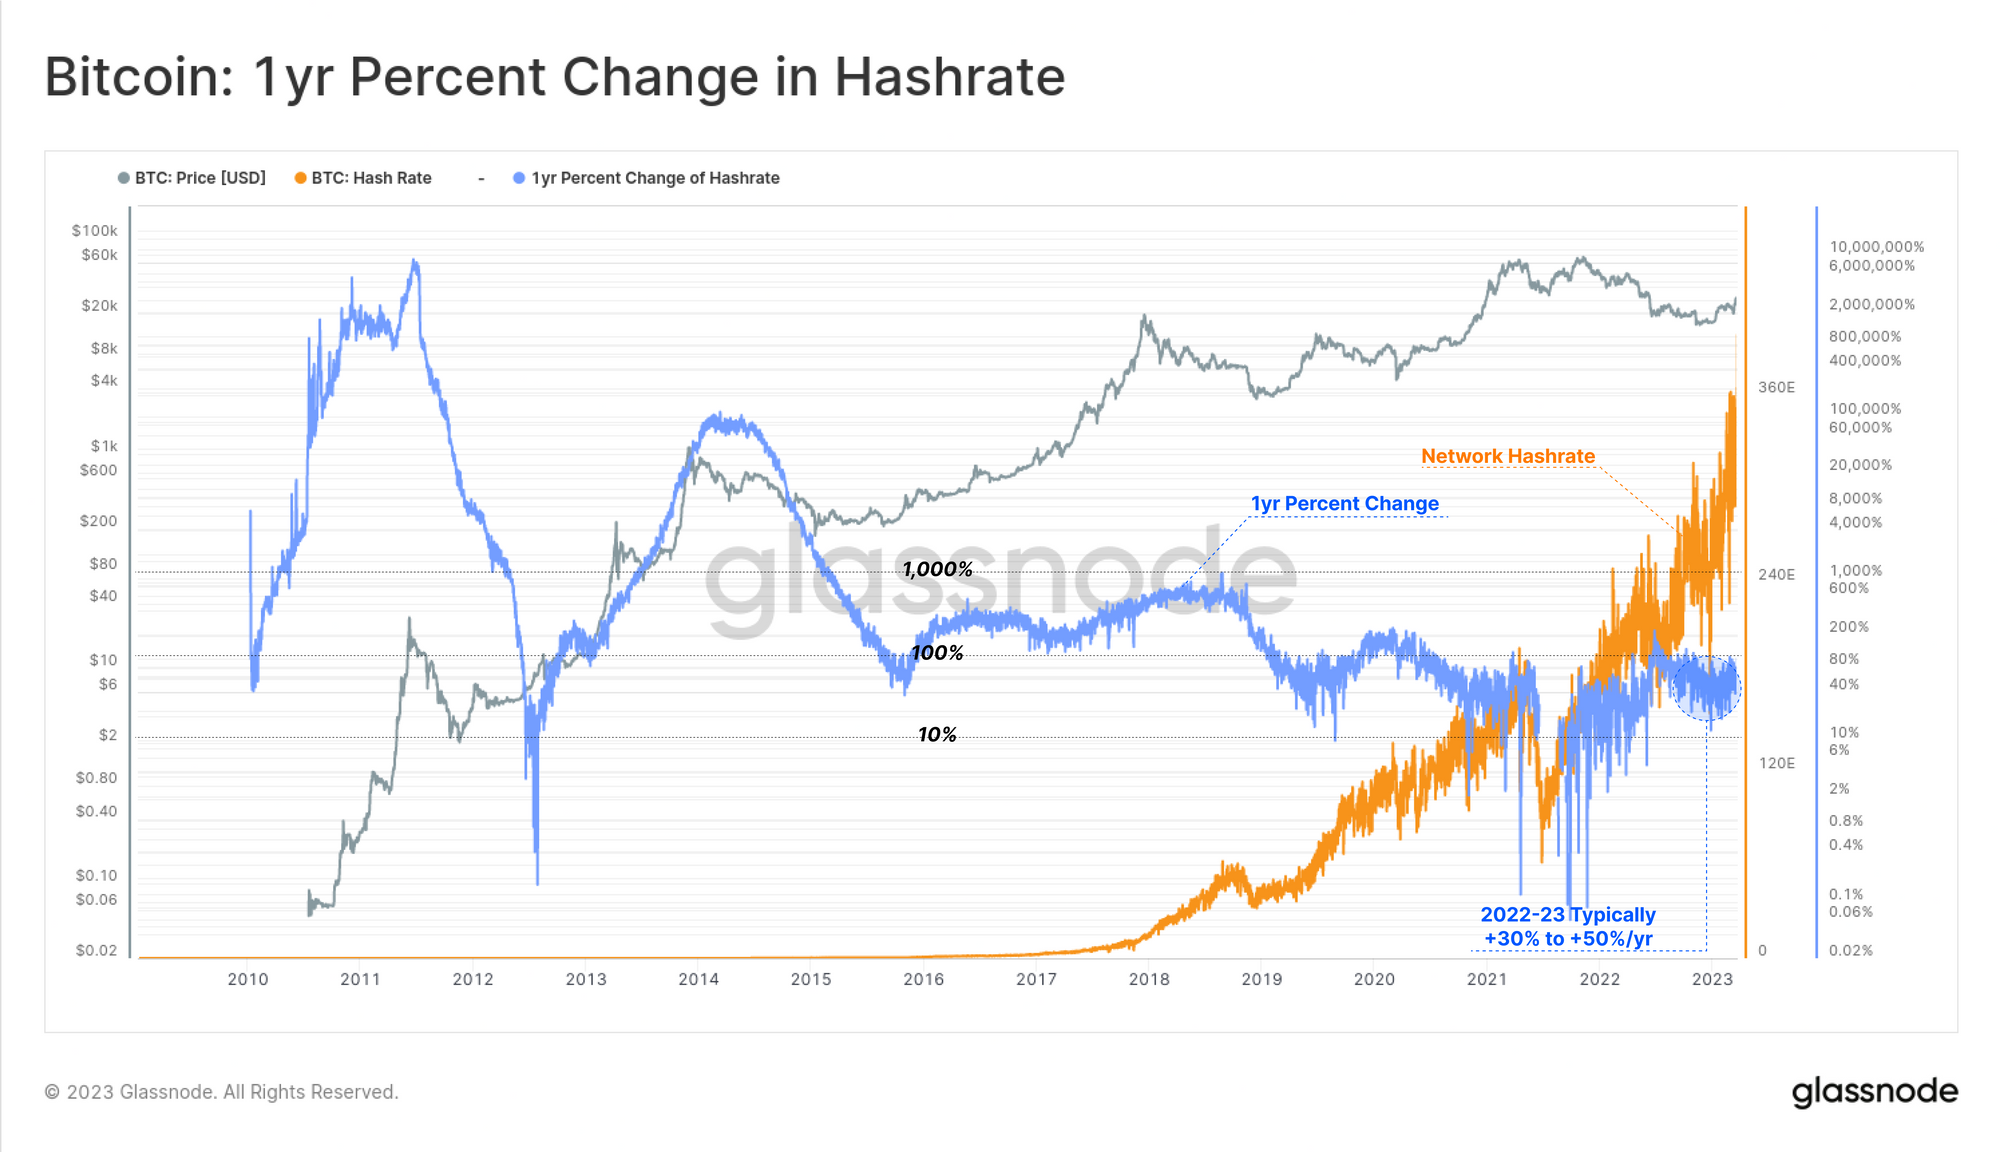
The growth of hashrate is both cyclical in nature, but also decays exponentially as ASIC hardware efficiency plateaus. Through the 2022-23 era, hashrate growth has hovered at around 30% to 50% per year.
Difficulty Adjustment
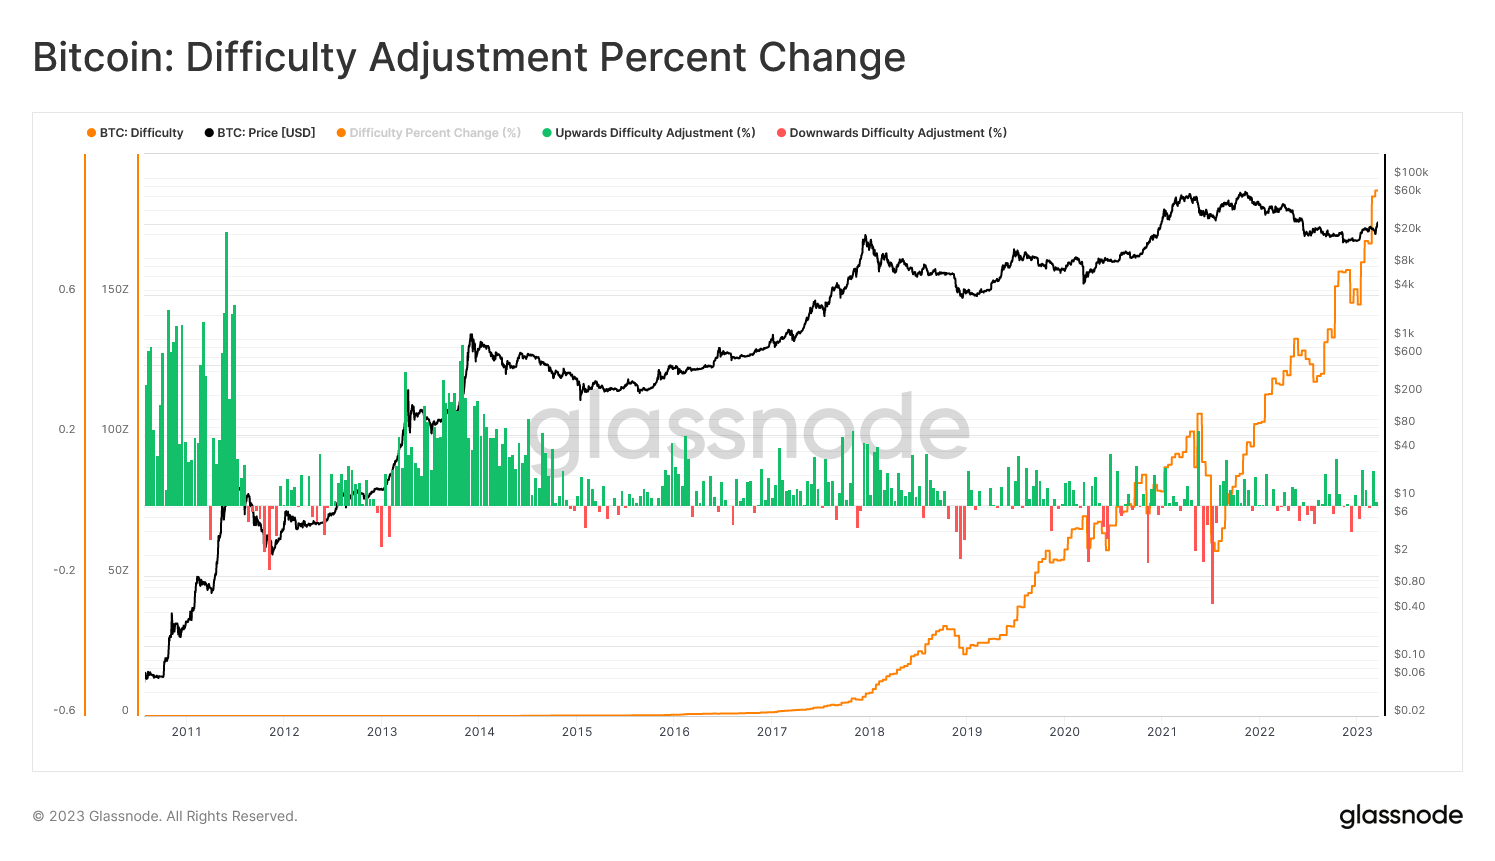
Mining Difficulty is a parameter set by the Bitcoin protocol to regulate the average time between blocks. At a technical level, it is a measure of how difficult it is to find a hash below a given target.
The difficulty re-targeting algorithm creates a dynamic relationship between the behavior of miners, and the issuance of new coins, where a higher protocol Difficulty implies an increasing cost of production per unit of BTC. As more hashpower competition enters or leaves the network, the difficulty adjustment resets the equilibrium position such that a pre-determined schedule of BTC is produced, irrespective of how much hashpower is competing for it.
The net result is that mining is a hyper-competitive industry, where the cost of production for BTC is constantly approaching the break-even price for the average miner over the long-term.
Modelling the Cost of Production
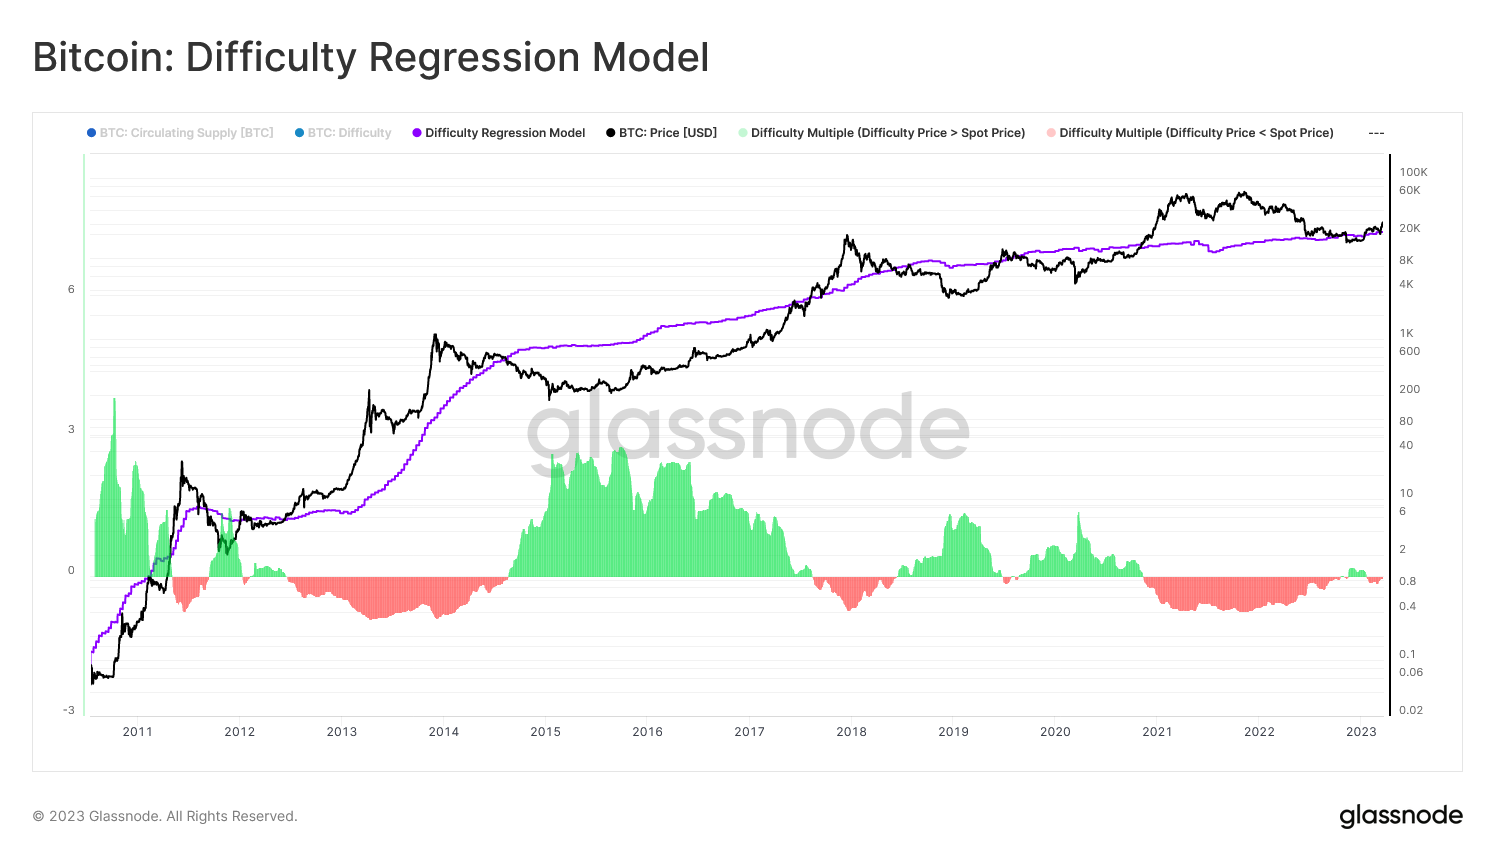
The Difficulty Regression Model is one approach for estimating the all-in-sustaining-cost of production for a unit of BTC. It considers Difficulty as the ultimate distillation of mining 'price', which accounting for all the mining variables in one number. A log-log regression between Market Cap and Difficulty yields a R2 value above 0.95, indicative of the strong relationship between asset value and mining competition.
The derived price therefore reflects an estimated average production cost for BTC across the mining industry, without requiring bespoke breakdown of mining equipment, power costs, and other logistical considerations.
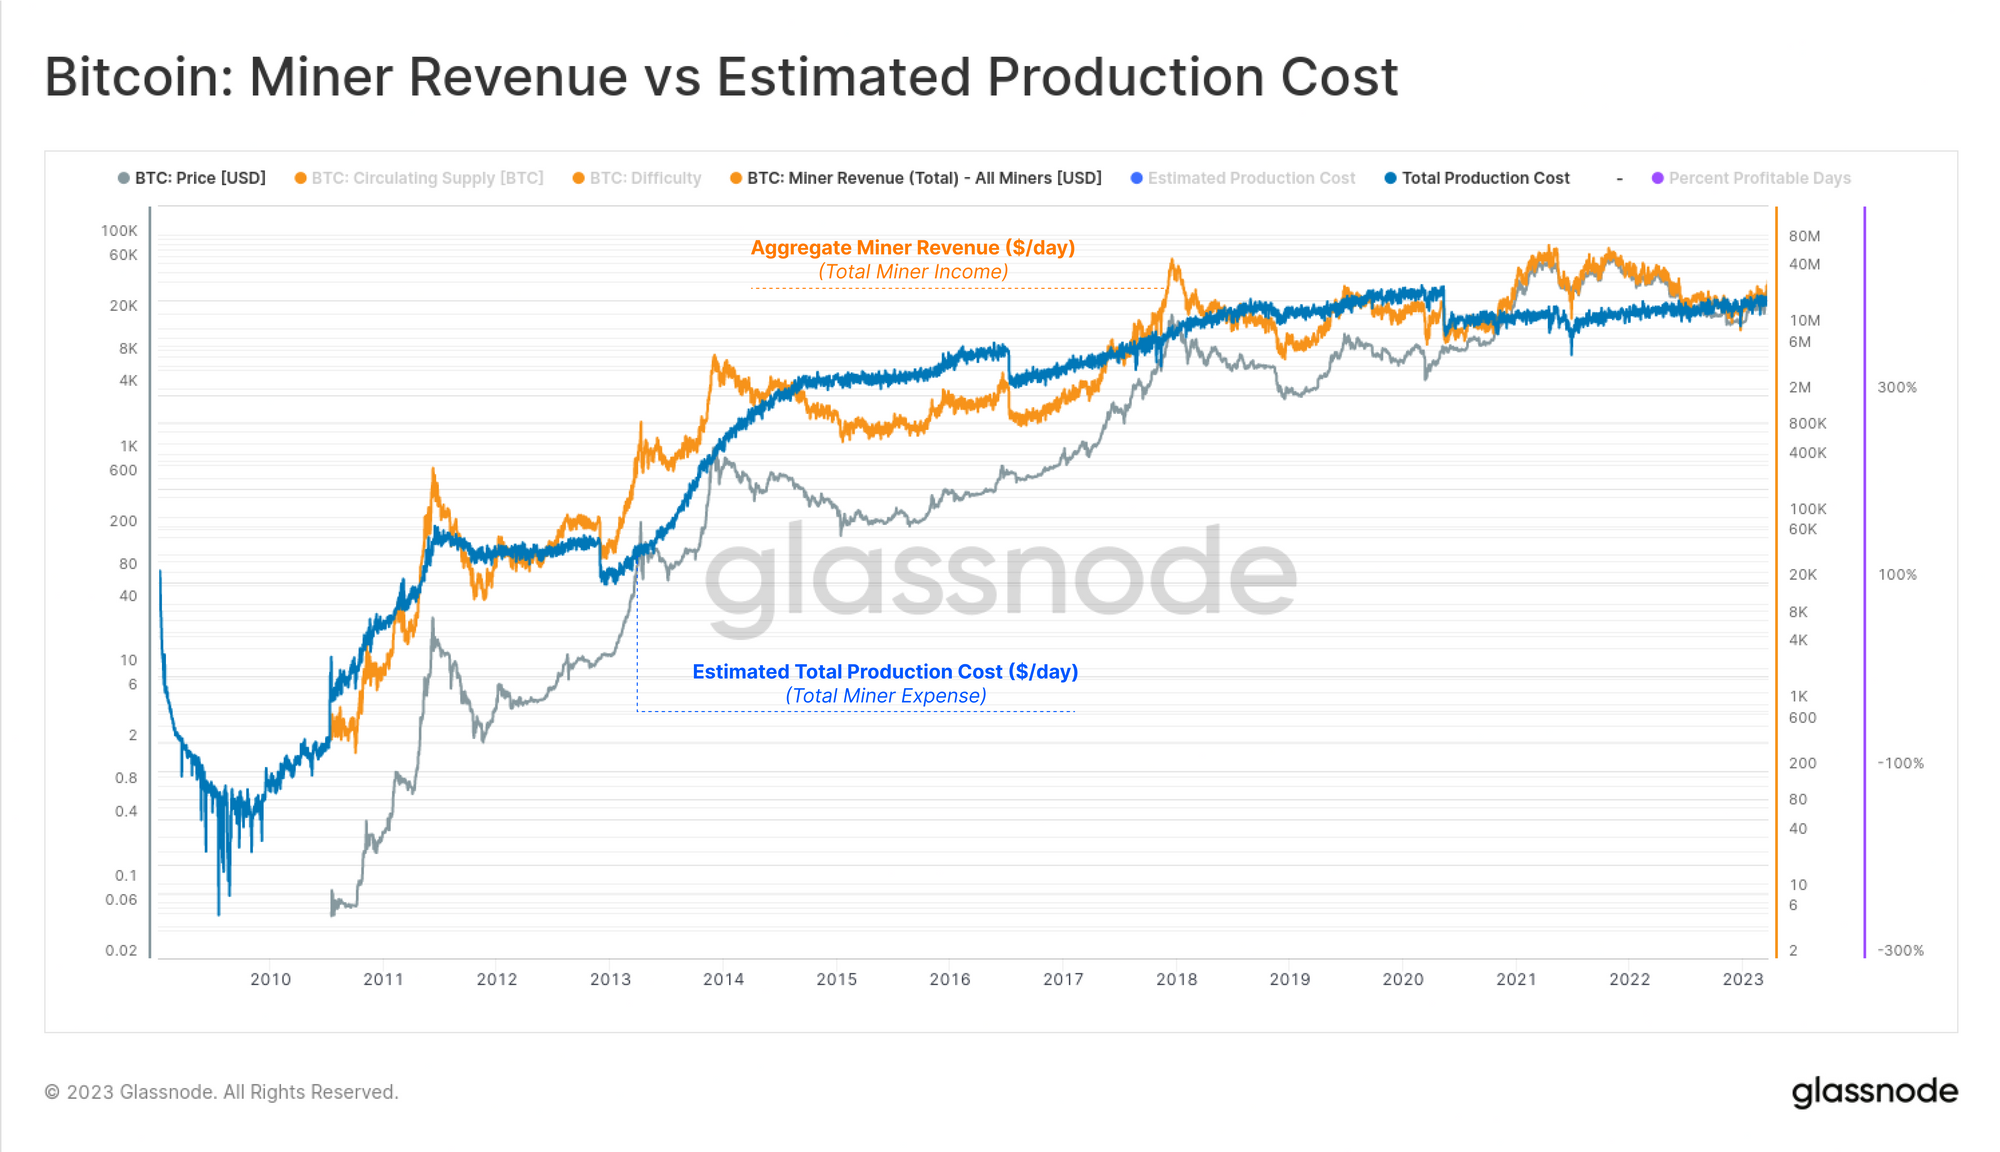
We can utilize the result of this Difficulty Regression Model, and multiply this price by the BTC supply issued, providing an approximation of the Total Production Cost.

This model leverages the notion that both Operational, and Capital Expenditure are fully reflected within protocol Difficulty in aggregate. Therefore, the total estimated expenditure across the mining industry can be obtained. The chart below presents two traces:
- 🔵 Total Production Cost as an estimate for the expended value to produce the coins mined each day.
- 🟠 Total Miner Revenue as an aggregate measure of the spot value of each coin at the time it was mined.
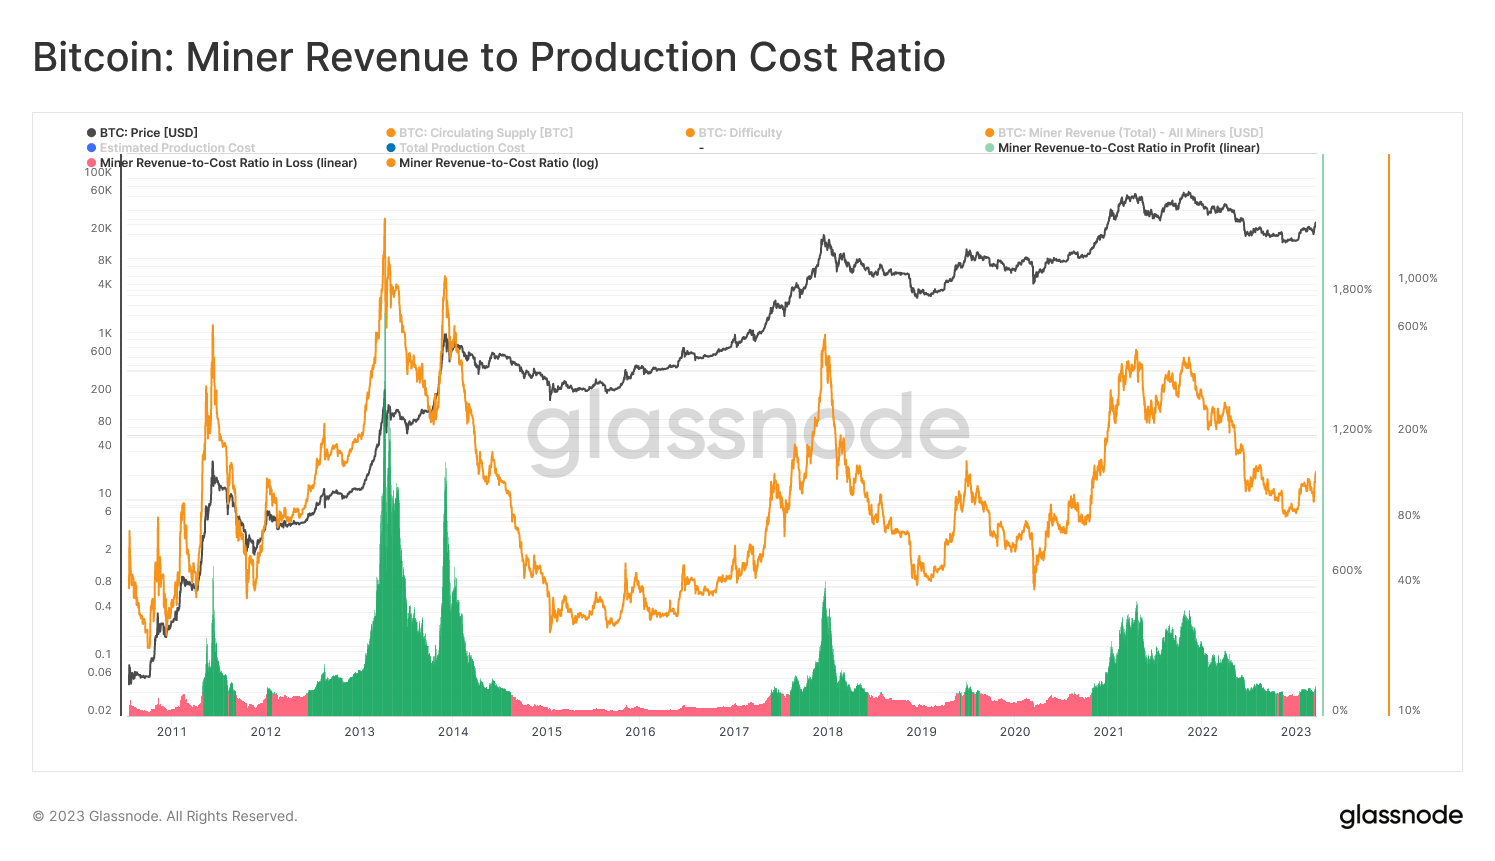
From this, we can define a new metric describing the average operational efficiency of the mining sector, by comparing the revenue generated, to the estimated total cost of production. This metric assesses a form of Revenue-to-Cost Ratio, a methodology commonly used to measure the aggregated efficiency of a target entity, in this case, the Bitcoin Mining Industry.
- 🟢 Values > 100% indicate a profitable mining industry, with revenue-to-cost ratios above 350% typically observed near bull market peaks.
- 🔴 Values < 100% indicate an unprofitable mining industry, with revenues falling to just 30% to 50% of the estimated production cost near bear market lows.
Note that mining requires long-term capital management, and Revenue-to-Cost Ratios will reflect the dynamic competition of the market such as ASIC rigs which have paid themselves off, evolving power input costs and sources, and difficulty adjusting to varying amounts of hashpower applied.
Tracking Mining Cycle Momentum
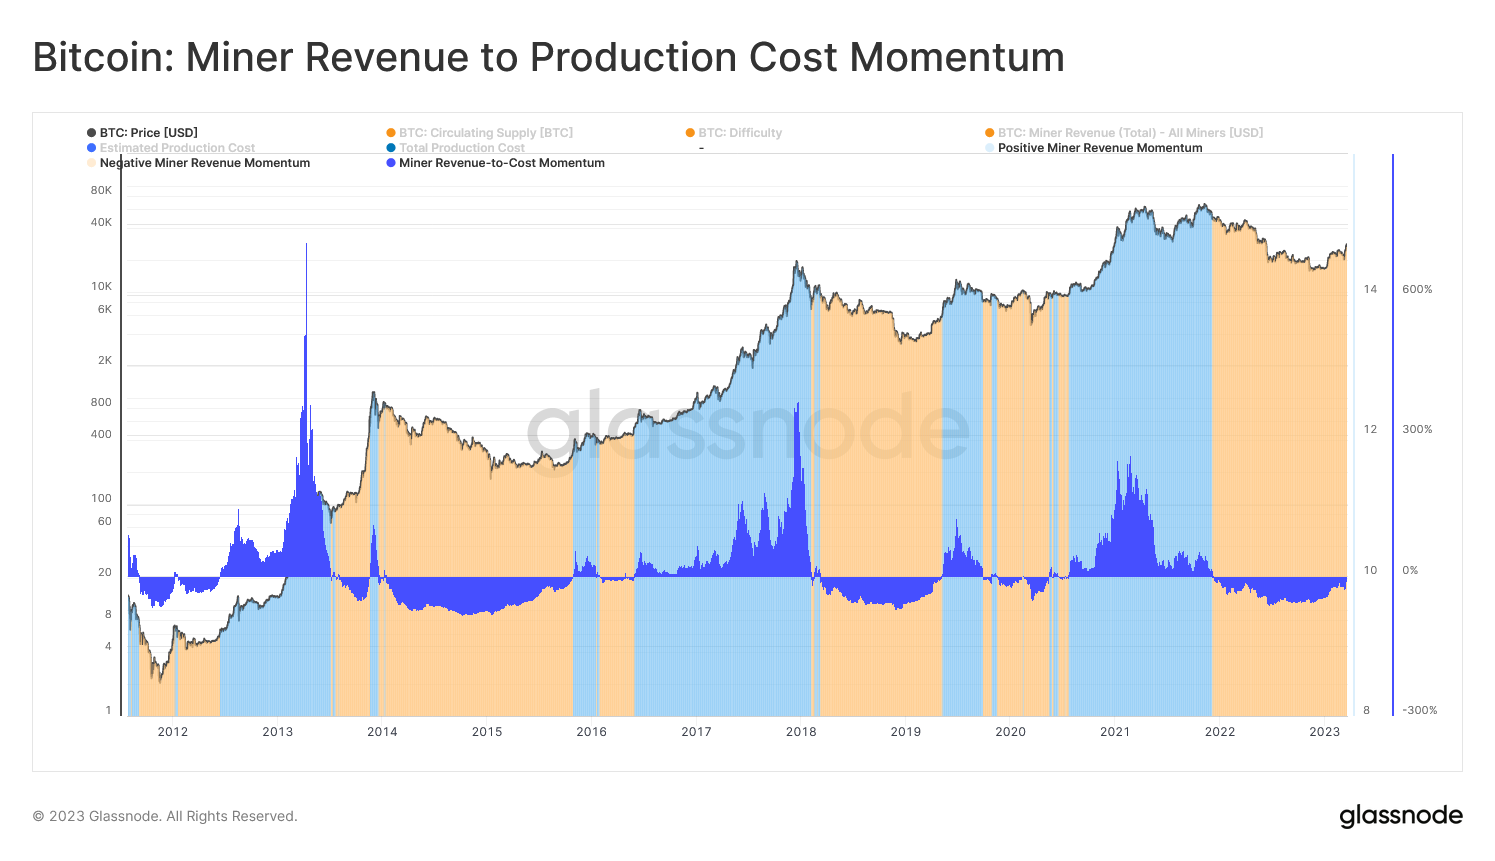
In order to normalize across halving cycles, we can produce a ratio between the Revenue-to-Cost Ratio and its yearly moving average, providing an indicator reflecting the cyclical momentum of industry profitability.
This ratio assesses the current aggregate Miner profitability against its long standing baseline and can be considered under the following framework:
- 🔵 When Miner Revenue Momentum is greater than 0, indicates the mining industry is seeing improving revenue multiples relative to the yearly average.
- 🟠 When Miner Revenue Momentum is less than 0, indicates the mining industry is seeing deteriorating revenue multiples relative to the yearly average.
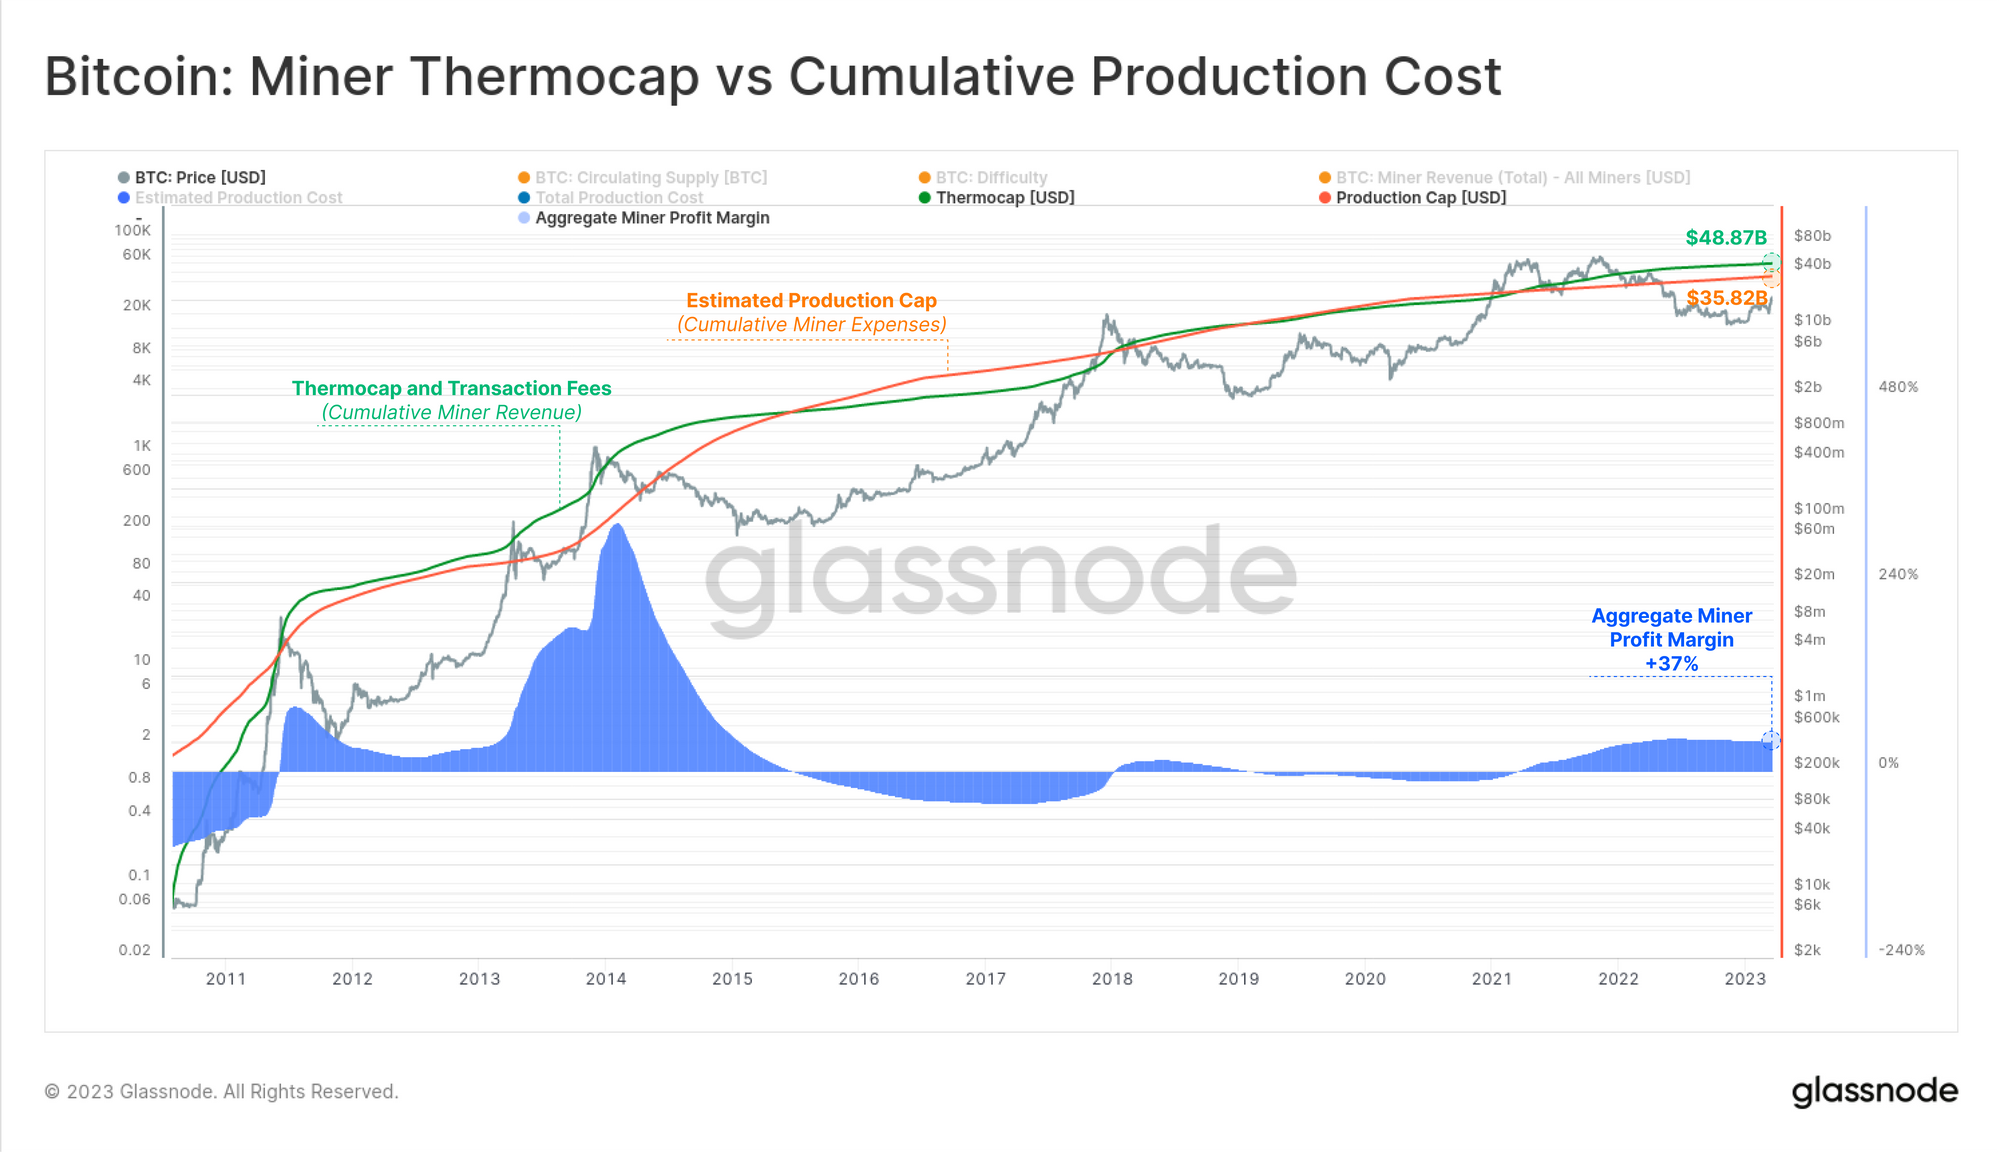
Cumulative Revenue vs All Time Production Cost
We can evaluate the difference between the total all-time revenue generated by miners and the estimated production cost for all coins minted and in circulation. This analysis examines the lifetime performance of two interdependent components of the mining industry.
- 🟢 Thermocap and Transaction Fees taking the cumulative sum of Issuance multiplied by spot price in addition to all-time generated fee revenue.
- 🔴 Difficulty Production Cost taking the cumulative sum of the Difficulty Regression Price multiplied by Issuance.
In this model, the Thermocap and Transaction Fees can be considered the realized revenue by miners, whilst the Difficulty Production Cost is considered the aggregate mining input expense.
Currently, miner have generated $48.8B in revenue since Bitcoin began openly trading in 2010, whilst miners have expended an estimated $35.8B in production. This culminates in a net surplus of +$13.0B across the mining industry, and an all-time profit margin of 37% (noting that profit margins have been extremely tight since 2015).
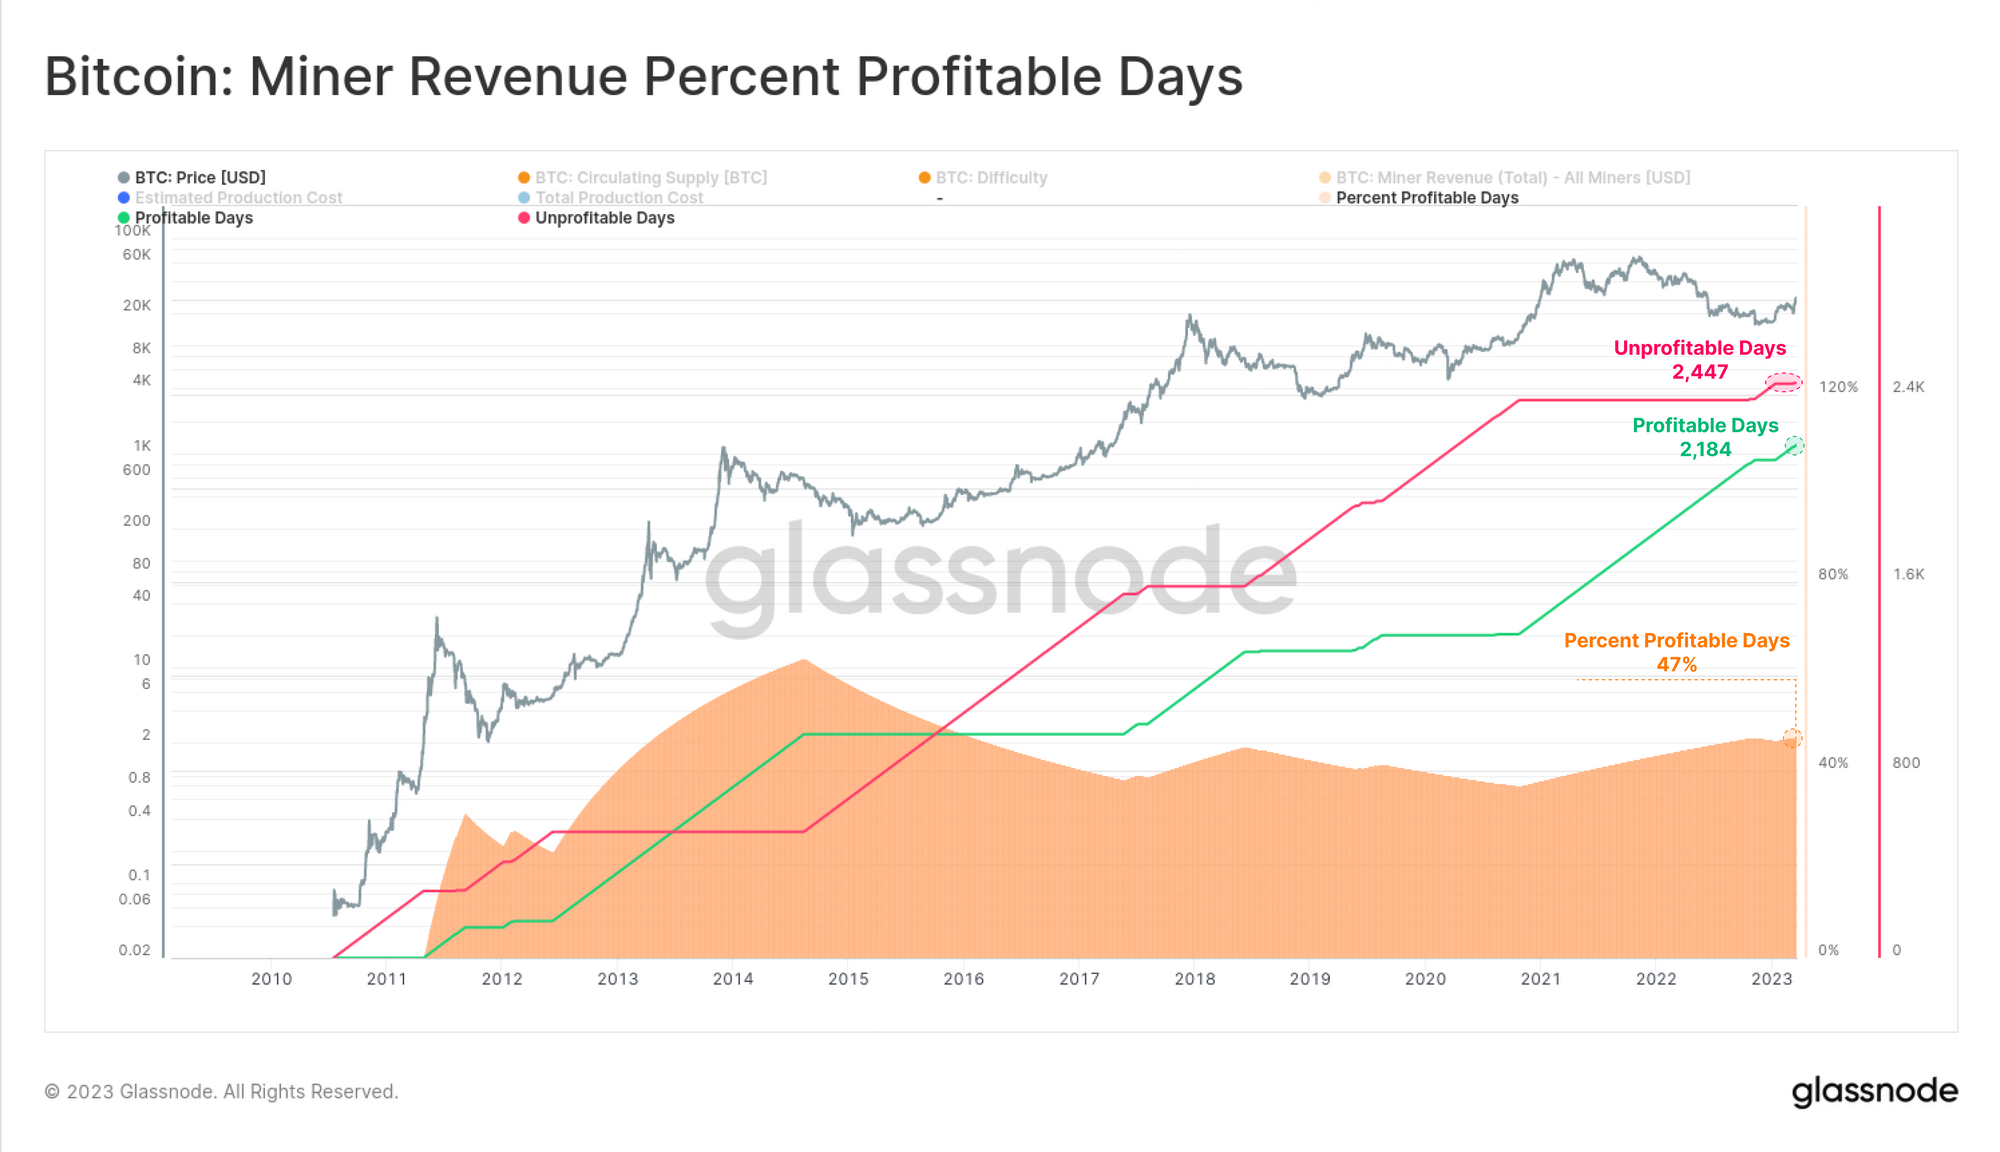
Upon assessing the number of trading days where Miner Revenue exceeded the daily Production Cost, we find that this was the case on 47% of trading days, and thus 53% of trading days have been unprofitable for the average miner.
According to economic theory, a perfect market is one where supply and demand reach equilibrium, and the price of the asset approaches the point of cost (production price). Given how close these numbers are to a 50:50 condition, one could argue that the difficulty adjustment has done a remarkable job of targeting just such an equilibrium.
Summary and Conclusions
The Bitcoin difficulty adjustment is one of the most remarkable of Satoshi's innovations, creating a system that autonomously seeks equilibrium in the mining sector. From this research, we developed a model which estimates the cost of production for the average miner. From this, we can derive several metrics which describe the cyclical nature of the mining market, as well as suggest that the difficulty adjustment algorithm indeed seeks a near perfect balance between supply of hashpower, and the demand for BTC coins.
Disclaimer: This report does not provide any investment advice. All data is provided for information and educational purposes only. No investment decision shall be based on the information provided here and you are solely responsible for your own investment decisions.
- Join our Telegram channel
- Visit Glassnode Forum for long-form discussions and analysis.
- For on-chain metrics, dashboards, and alerts, visit Glassnode Studio
- For automated alerts on core on-chain metrics and activity on exchanges, visit our Glassnode Alerts Twitter
