New Bitcoin Whales: Where Are They Coming From?
Bitcoin's whale population is on the rise for the first time since 2016. Where are these whales coming from, and are they hoarding more BTC than ever?


After decreasing since 2016, bitcoin's whale population is growing once again, having been on the rise almost continuously since January 2020.
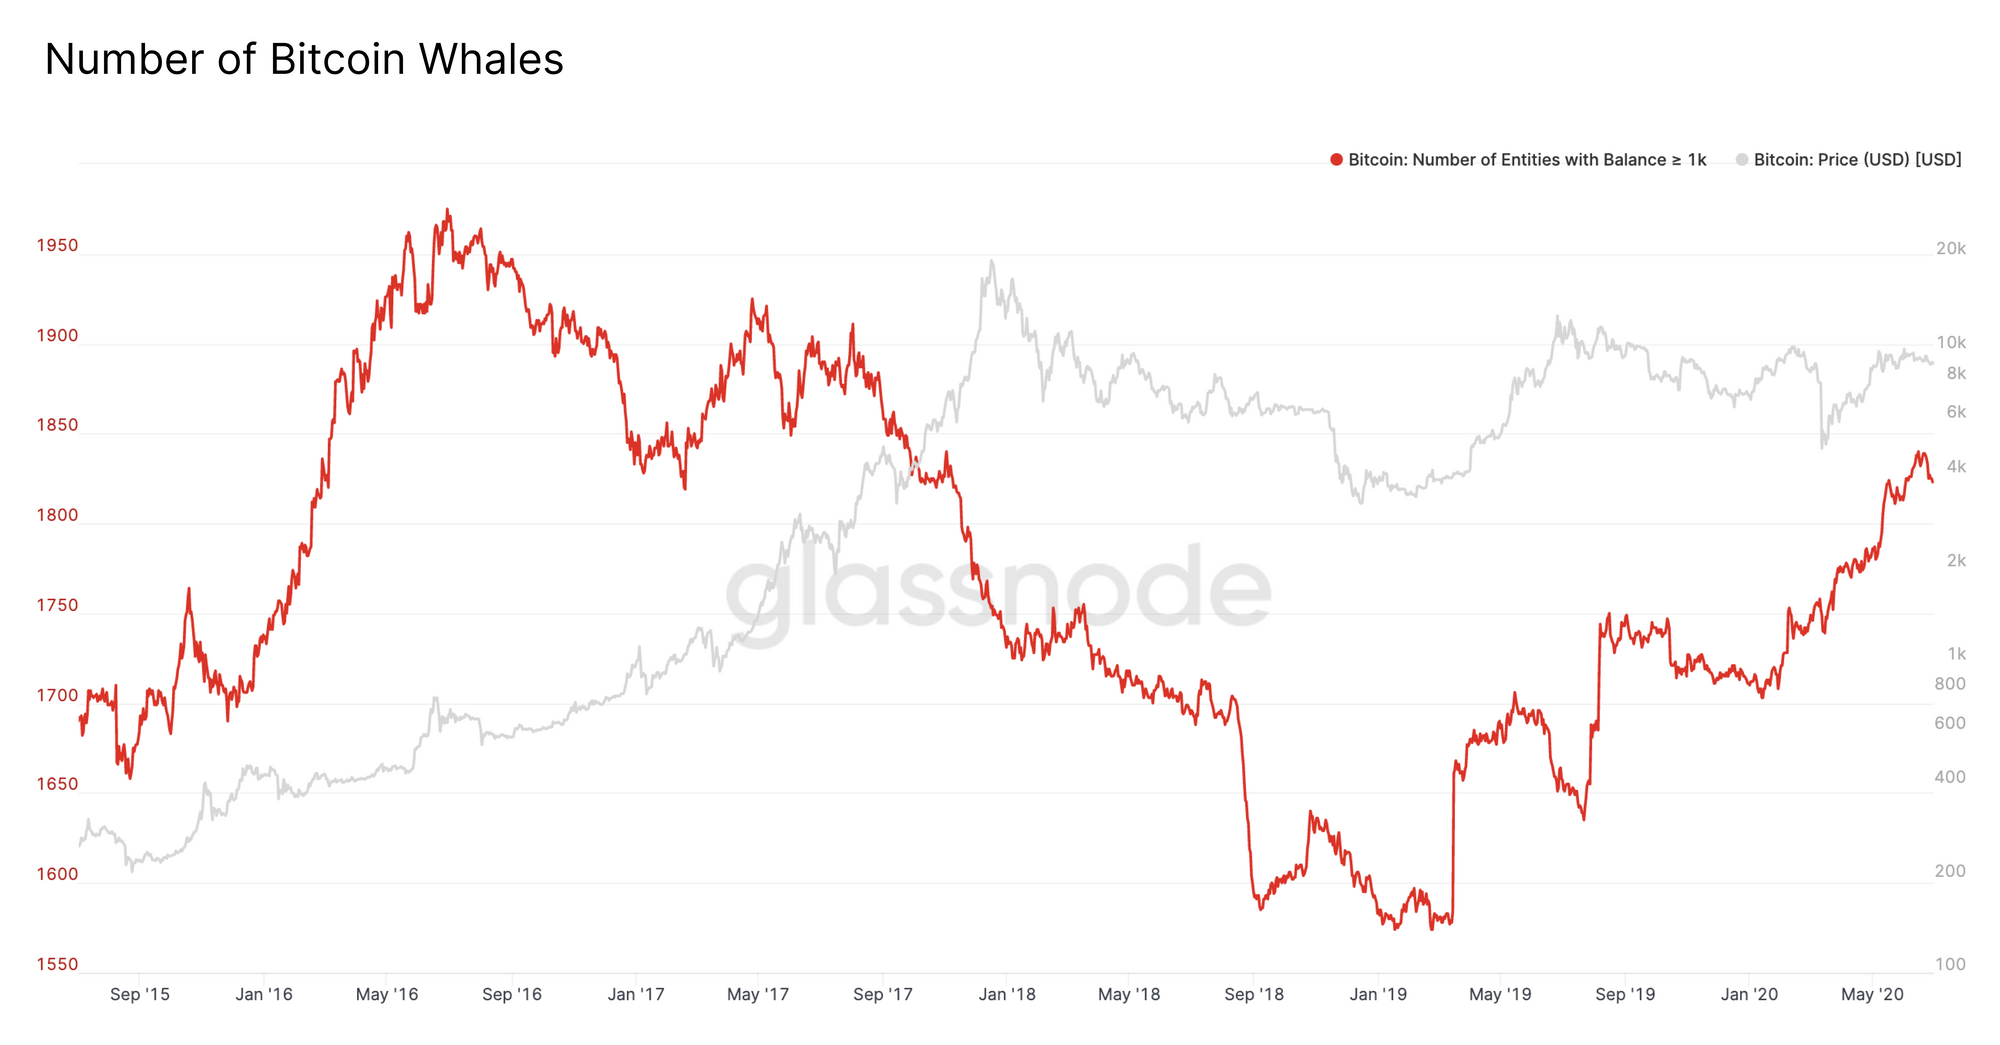
We define whales as entities with a balance of at least 1000 BTC. Note that this is not the number of addresses with at least 1000 BTC, but rather the number of entities. Also note that throughout this article, exchanges are excluded from our analysis unless otherwise specified.
Based on our clustering heuristics, we see that the number of whales has increased to above 1800, and is possibly on the path to overtake previous highs.
But where are these new whales coming from? And does this increase mean that whales are hoarding more and more bitcoin? Yes and no. While whales are gaining an increasing share of BTC, this increase is not highly significant yet, although it could be if the trend continues. Furthermore, individual whales are not getting richer.
Investigating Whale Dominance
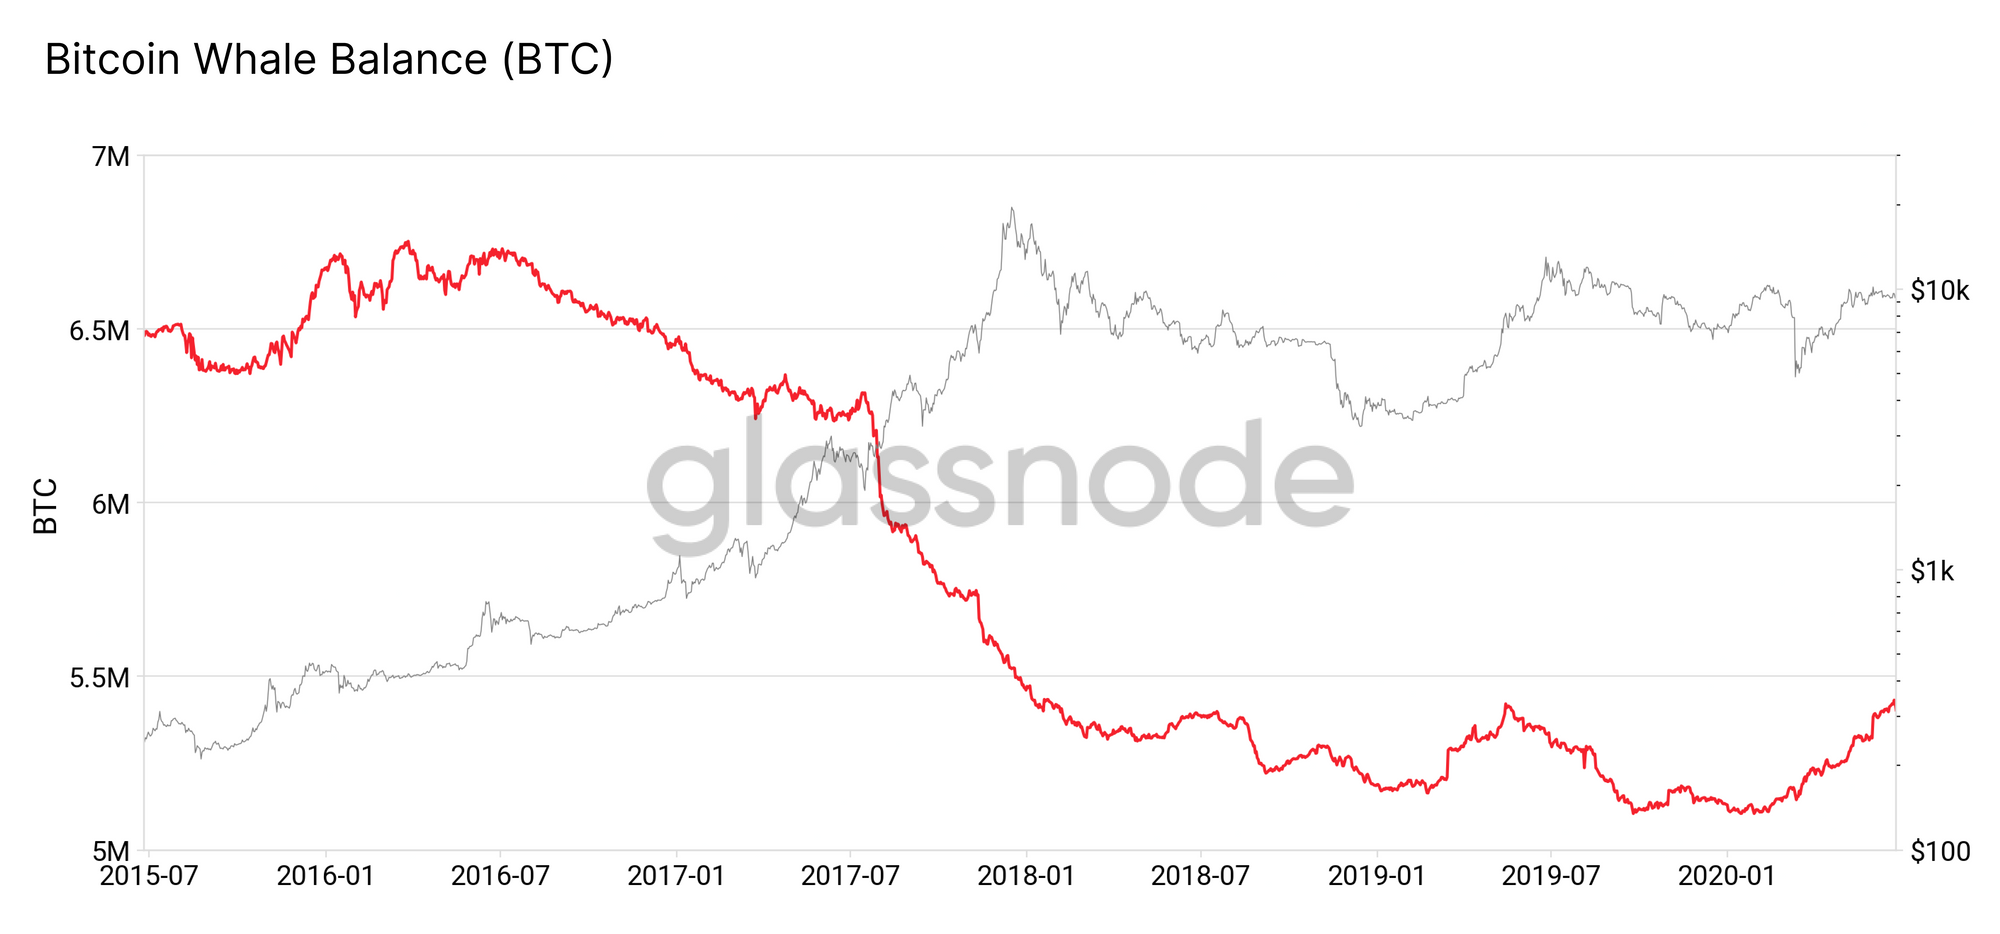
The number of BTC held by whales actually decreased steadily over the past 5 years, declining over 22% from around 6.7m to 5.2m BTC. But it has begun to incline once again as more and more entities pass the threshold of becoming a whale.
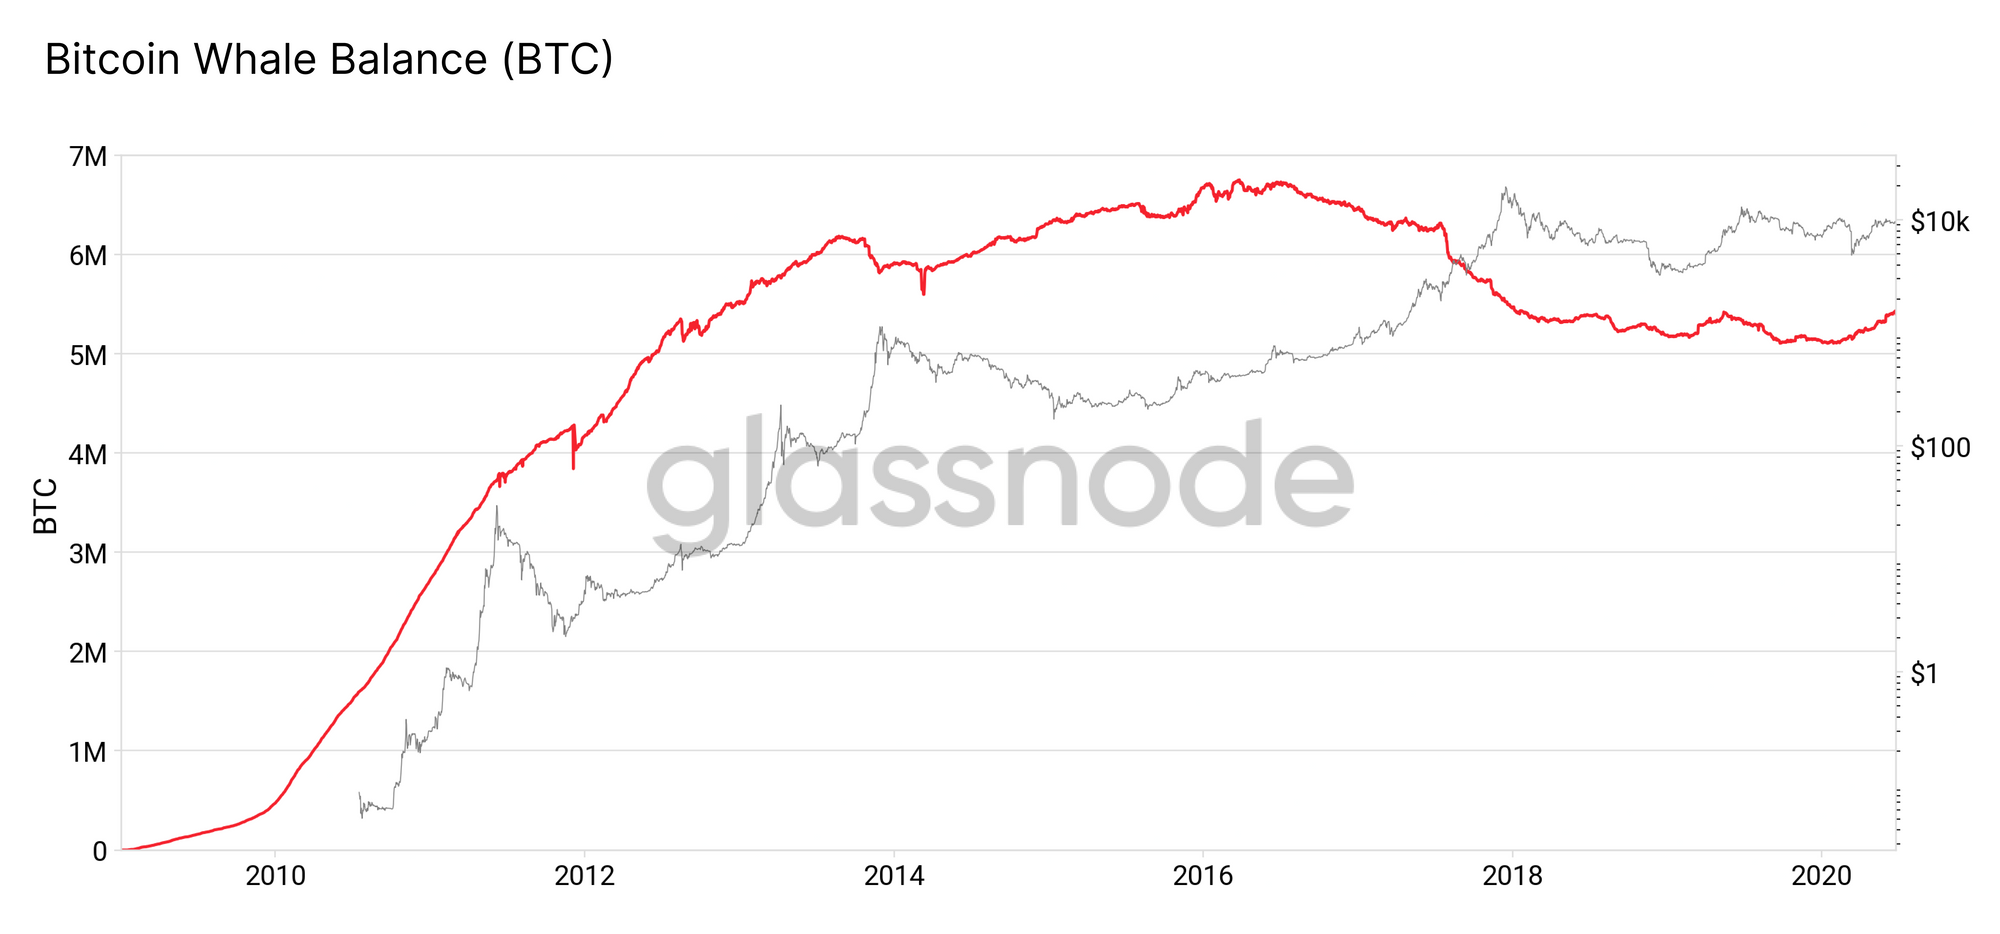
When we zoom out to view bitcoin's full history, we see that the BTC balance held by whales peaked in early 2016, and then started decreasing consistently. Despite the increase in whale holdings this year, the balance of BTC held by whales is still well below the peak.
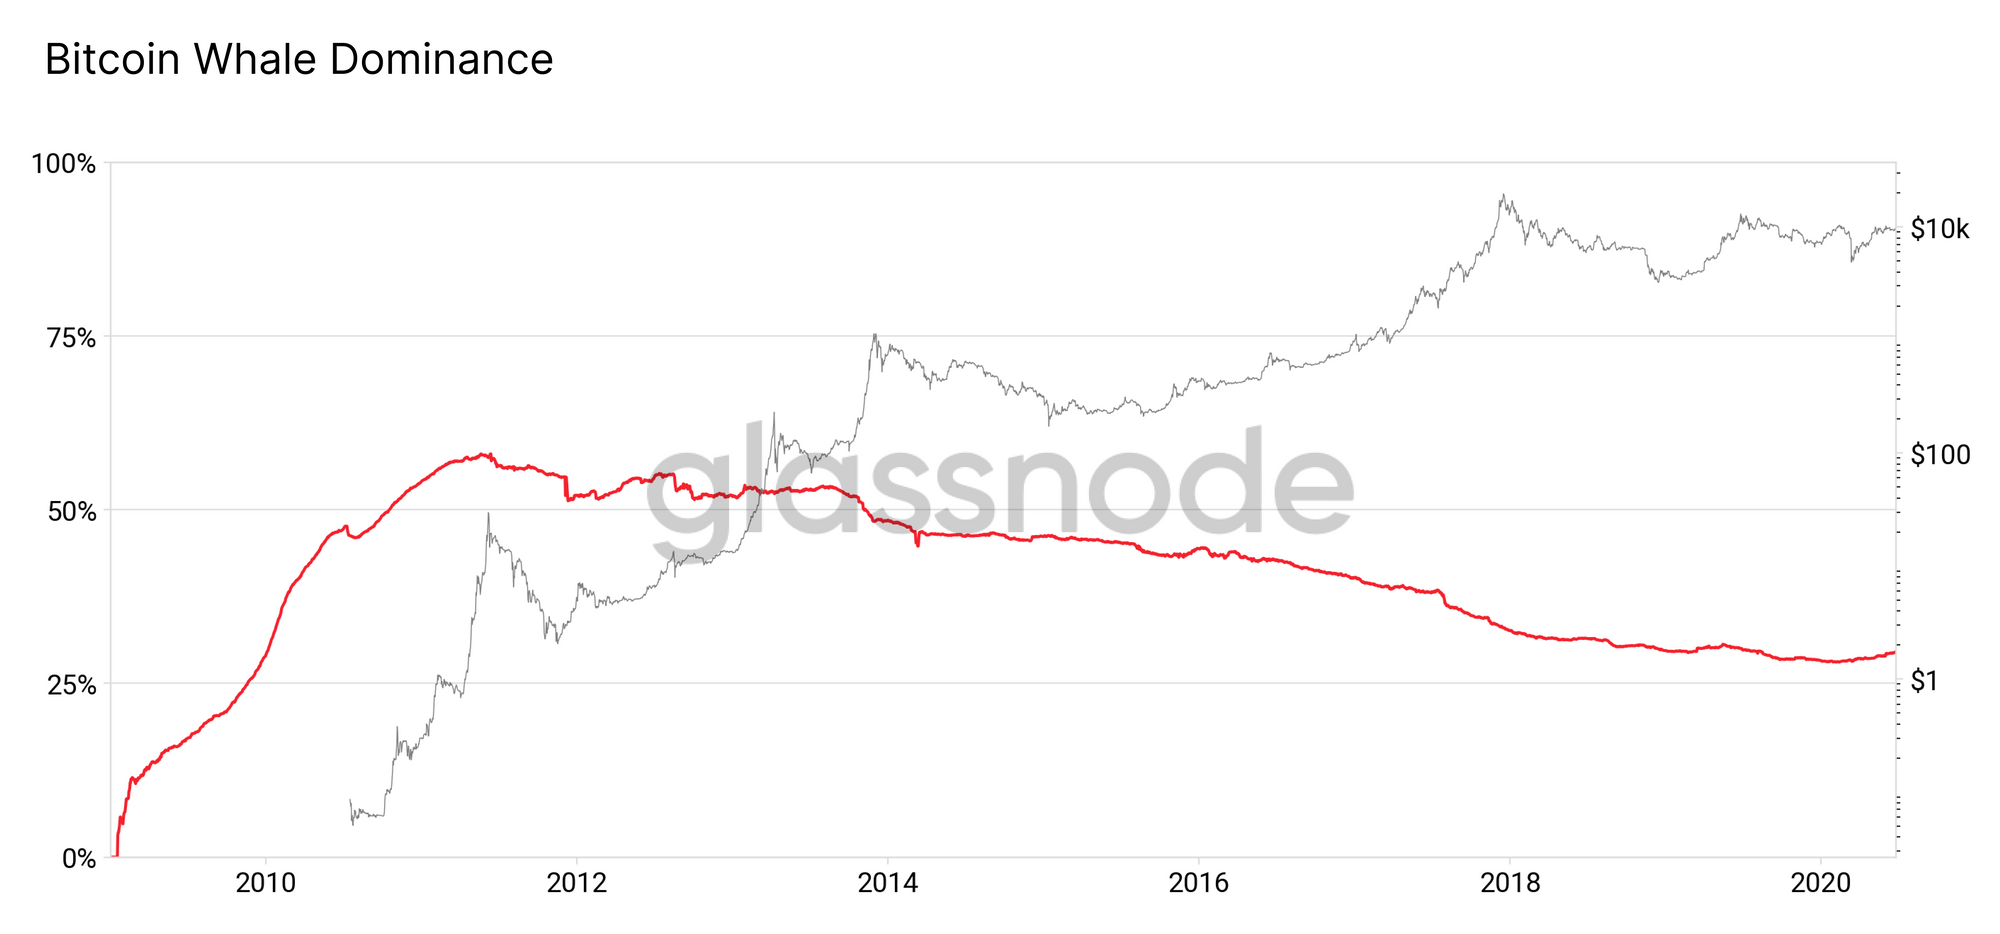
In order to assess whales' overall dominance in the market, however, we must account for the fact that the total bitcoin supply was lower in earlier years. As such, we can look at whale dominance (that is, the proportion of BTC held by whales) to determine their share of the market over time.
In Figure 4 below, we see that while the total BTC balance held by whales only peaked in 2016, their dominance in the BTC market actually peaked much earlier in 2011, after which it has has been in a state of near-constant decline. This means that the recent incline in whale dominance, while seemingly small on the scale of bitcoin's existence, is still the largest sustained increase in almost a decade.
So, what does this mean for the wealth of whales? We know they have a smaller (albeit slowly growing) share of the "bitcoin pie" than they did in the past - but how much wealth does this represent, considering the pie has gotten bigger?
Whale Wealth
Despite the recent increase in the number of BTC held by whales, as a group they are still not as rich (in USD terms) as they have been at certain times in the past, with the highest USD wealth having been reached at the peak of the market in late 2017.
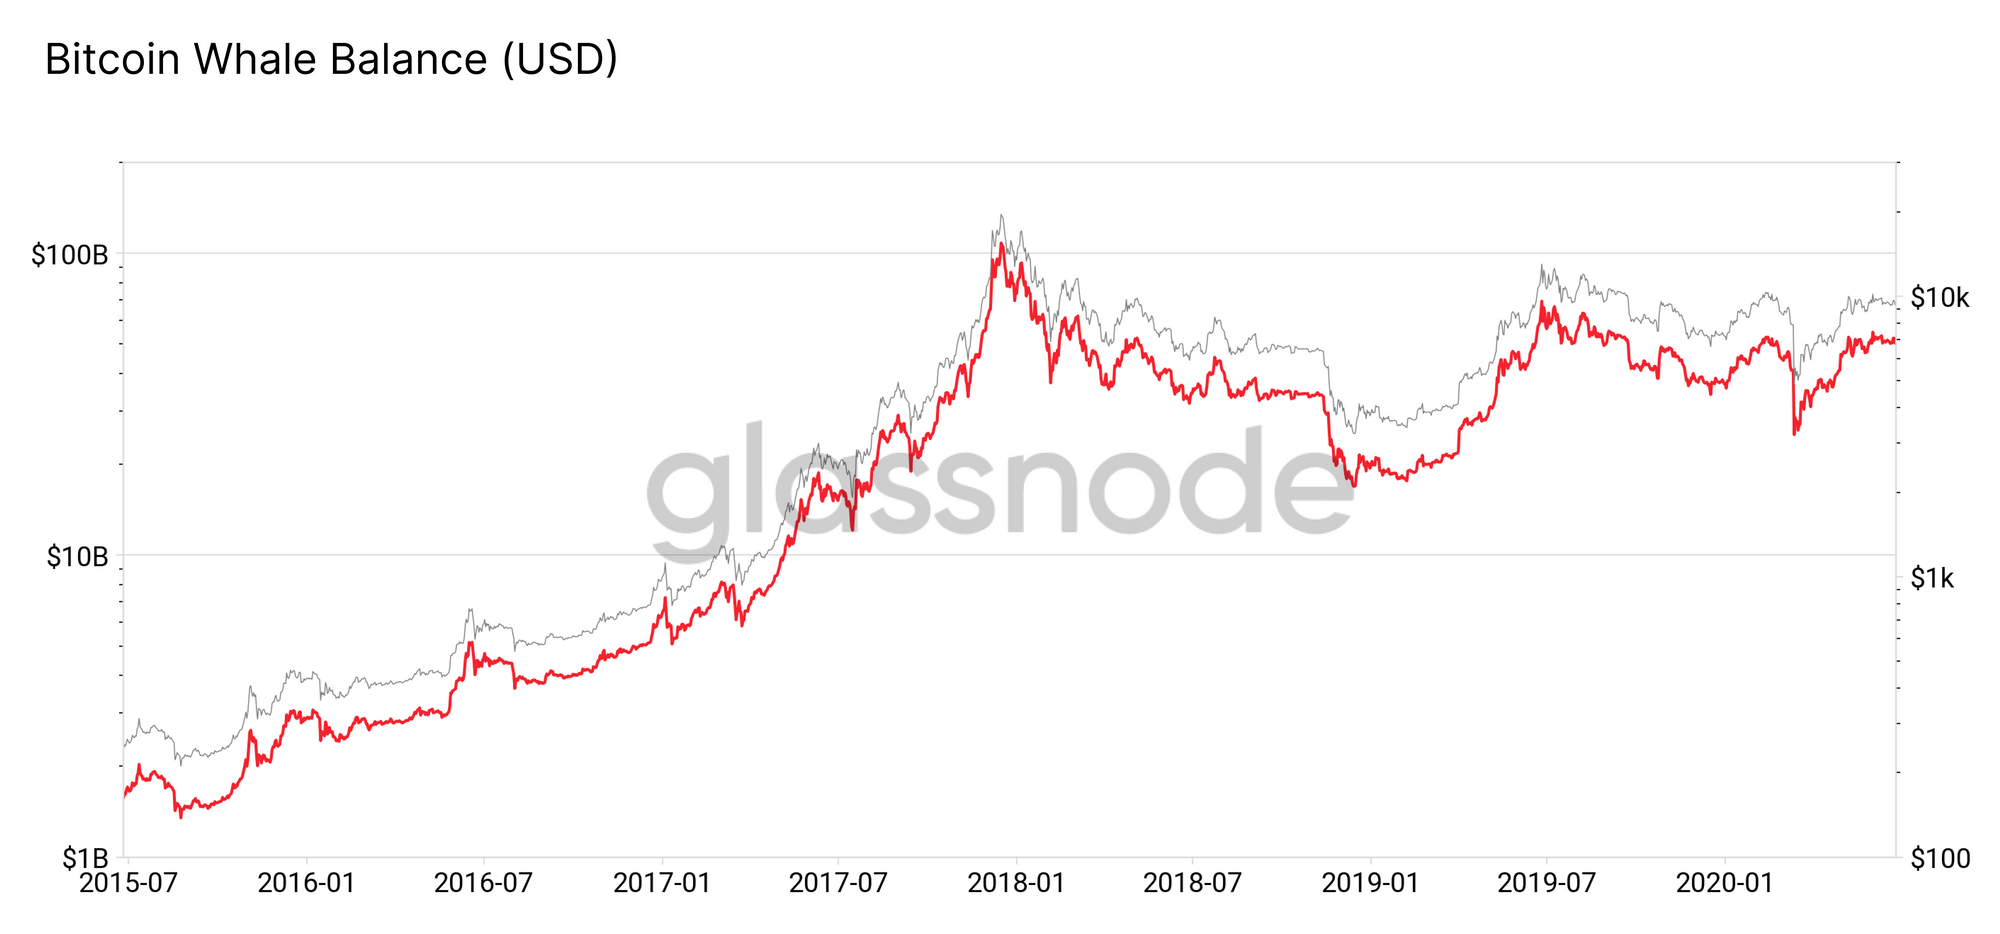
Note how the USD balance of whales is (understandably) heavily correlated with price, but that the decoupling has grown slightly as their overall BTC balance has gradually decreased, before beginning to converge more recently as this trend reverses.
If the number of whales continues to increase at the current rate, we may ostensibly see their USD wealth overtake the level reached in June 2019. However, in order to reach a new all-time high in USD wealth, we would likely have to see an increase in market cap, as whale dominance is not likely to increase dramatically enough to cause USD wealth to overtake 2017 bull market levels.
Individual Whales
While whales as a group are beginning to accrue more wealth once again, individual whales are growing slightly poorer. The mean BTC balance held by whales (i.e. the average BTC wealth of each whale) has been in decline since 2011, and has not meaningfully increased in 2020 alongside the number of whales.
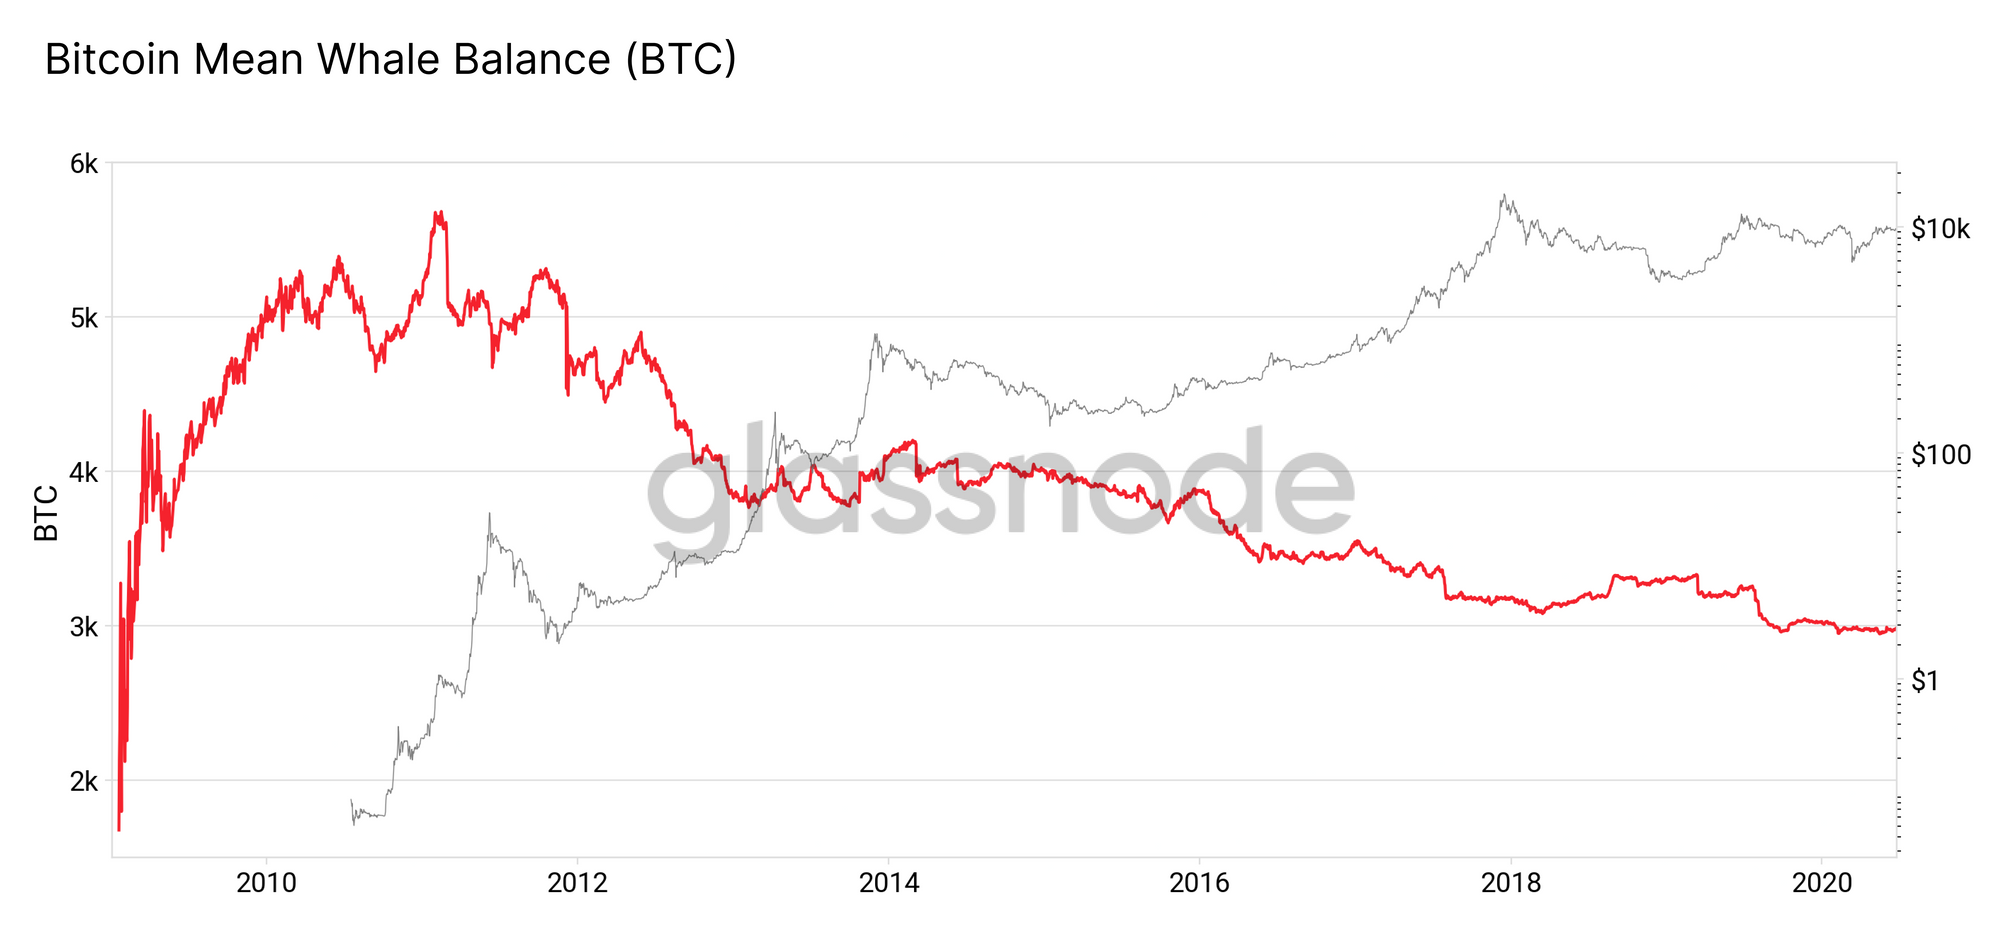
This means that while we are seeing more whales, they are more like "belugas" rather than "blue whales"; individual whales are not getting richer on average. As such, we can deduce that the recent increase in whales' BTC balance is due to the increasing number of whales, not due to individual whales getting richer.
Where did these new whales come from?
Much of the recent increase in the number of whales can be explained not by new money, but rather by existing wealthy entities withdrawing their BTC from exchanges. As we have reported before, the total balance of BTC on exchanges has decreased significantly throughout 2020, specifically since Black Thursday.
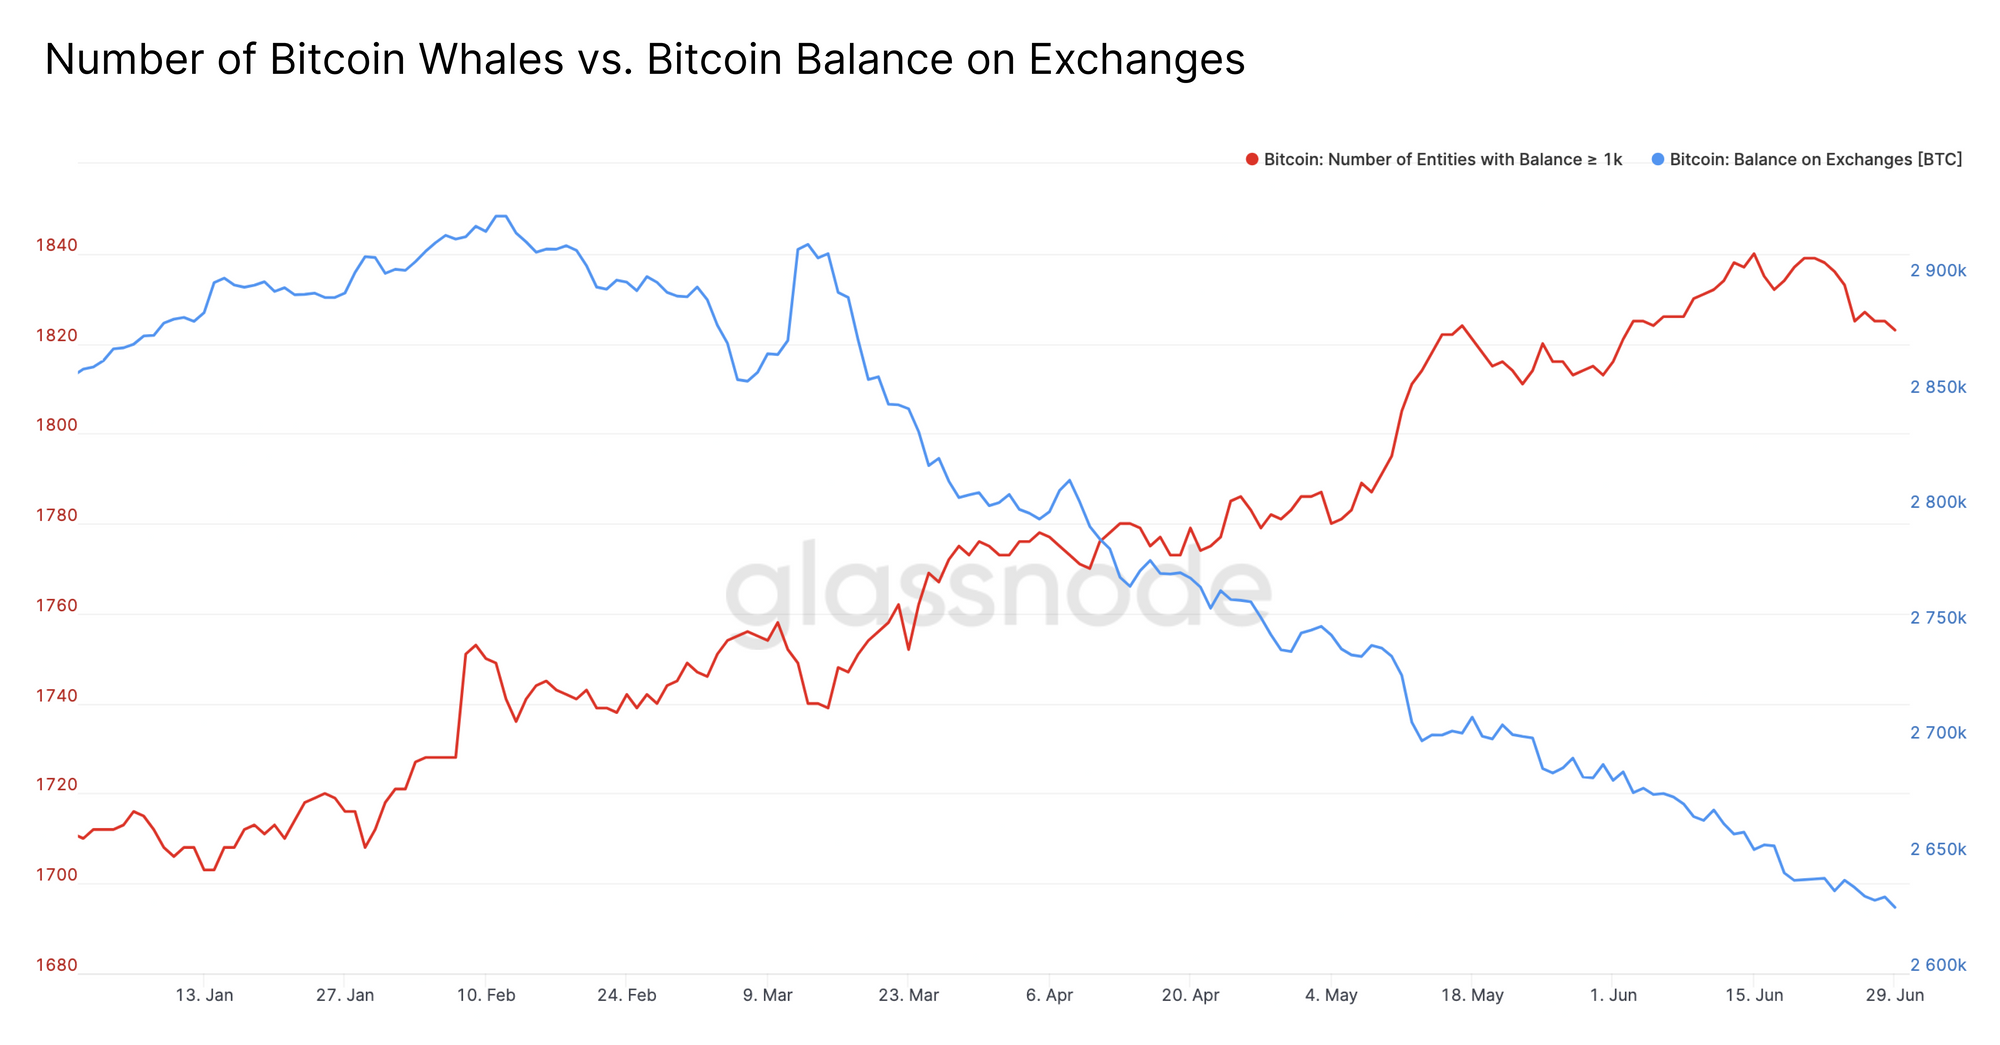
We can see that this decrease in the balance of BTC on exchanges coincides with the increase in the number of bitcoin whales. It also correlates with the increase in whales' BTC balance, which can be seen when we compare whale dominance to exchange dominance.

While whale dominance has begun to increase in 2020, exchange dominance has decreased, meaning that their combined value has not experienced any significant change.
This was caused at least in part by an uncharacteristic proportion of exchange withdrawals by whales over the past few months, contributing to the creation of seemingly "new" whales. The effect was strongest directly after Black Thursday, when the flow of BTC from exchanges to whales increased significantly.
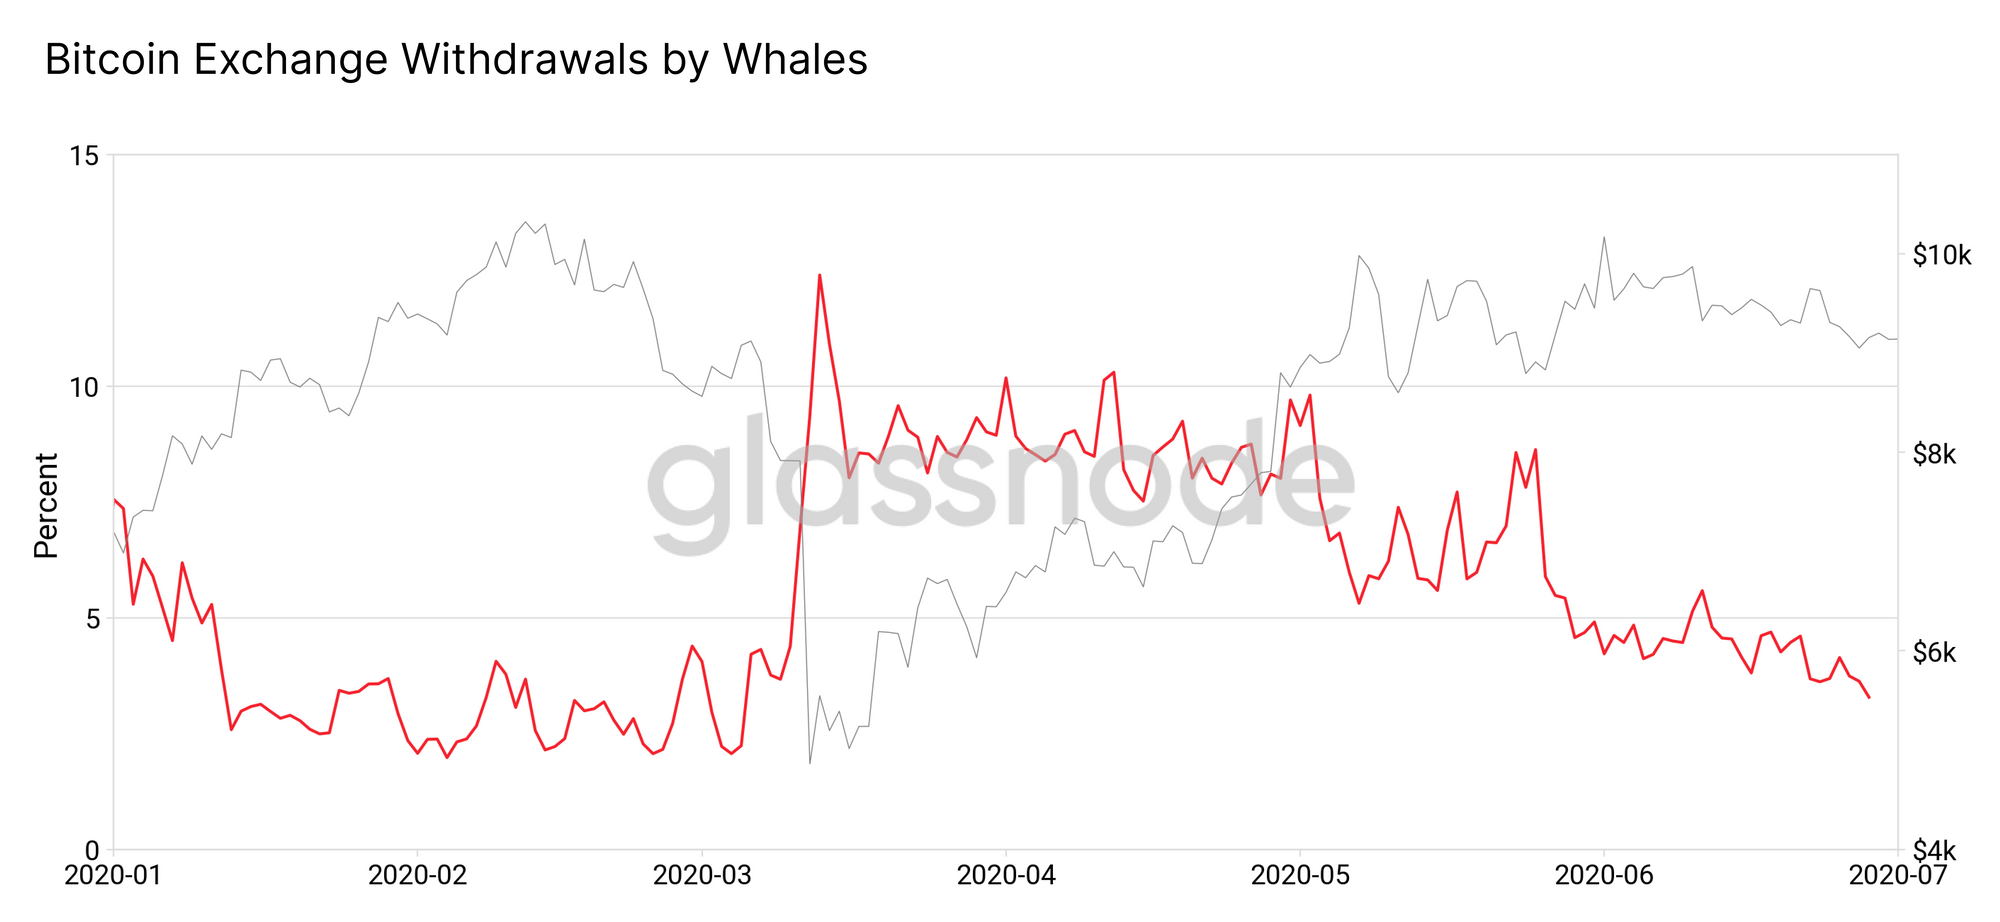
These withdrawals explain to a large degree how so many new whales could appear on-chain in such a short amount of time. It also provides a hint as to why so many BTC are moving off exchanges, especially into whale wallets.
While there is no single explanation of what caused these large holders to withdraw their BTC from exchanges, the chart in Figure 9 suggests that whales may have used Black Thursday as an opportunity to get in at the bottom and then withdraw their bitcoin to HODL for the longer term in anticipation of the next bull run.
Summary/TL;DR
- After declining since 2016, the number of BTC whales (that is, entities with at least 1000 BTC) is increasing.
- Similarly, the total BTC balance held by whales has begun to increase for the first time since 2016.
- Meanwhile, whale dominance (i.e. whales' market share) is seeing its largest sustained increase since 2011, after experiencing a near-consistent decline for almost a decade.
- Despite this, the total USD balance held by whales is still below its peak, which was reached at the height of the bull market in late 2017.
- The average BTC wealth per whale has decreased slightly during 2020, indicating that the new whales we are seeing are, on average, slightly smaller than the previous average.
- The reason that new whales are not bringing the average whale wealth down even further is because some of them may still be quite large. This is possible not because entities are rapidly acquiring new wealth, but because many "new" whales are actually withdrawing existing wealth from exchanges.
Special thanks to Kilian Heeg for the development of the charts used in this analysis.
Live metrics on Glassnode Studio:

- Follow us and reach out on Twitter
- Join our Telegram channel
- For on–chain metrics and activity graphs, visit Glassnode Studio
- For automated alerts on core on–chain metrics and activity on exchanges, visit our Glassnode Alerts Twitter