Introducing Options Premium & Taker Flow Analytics
A new options metric suite focused on premium flows and taker activity helps traders assess market positioning and conviction—available for BTC, ETH, SOL, BNB, and XRP, with history back to 2021.


As crypto markets mature and become institutionalized, an increasing amount of capital has shifted from on-chain spot transactions to off-chain derivatives.
To give investors the full picture, Glassnode is expanding options coverage across more assets, exchanges, and history, and introducing new metrics focused on premium flows and taker behavior (buyers vs. sellers). In this article, we explain these metrics, how they clarify market intent, and what’s next for our derivatives analytics.
Why Options Data is a Goldmine of Information
Options contracts are a uniquely rich source of market data. Unlike simple spot transactions, options embed a wealth of information by design, adding a sense of timing and expectation to market bets. A single option conveys multiple layers of information:
- its strike price provides a specific target level;
- its maturity (expiration) adds a time element, and
- its implied volatility reflects the market’s expectation of future price swings.
By analyzing these variables, we can glean insights into:
- where traders believe the market is headed;
- when they expect the move, and
- how confident they are.
Why Metrics Focused on Premiums and Taker Flows?
Premiums
Premium is the amount of money spent (or received) to buy (or sell) an option. Many traders still rely on traditional metrics like volume and open interest (OI) to gauge sentiment; however, these don’t tell the full story. For example, a large number of cheap, out-of-the-money options may show up as significant OI, yet represent very little capital in dollar terms – this alone doesn’t show conviction. Unlike trade count or contract size, premium represents actual capital at risk, a more objective read on conviction and P&L sensitivity.
Taker Flows
In crypto, taker flow data is transparent. This allows us to separate call buyers from call sellers, and put buyers from put sellers, providing a clearer window into trade intent. Crypto options venues (e.g., Deribit) mark trades from the order-book aggressor's (taker's) perspective. Because taker is labeled, we know which side took liquidity and whether that party was buying or selling calls or puts. By definition, a taker is willing to pay the spread to execute immediately instead of waiting for price improvement, which signals urgency. Taker flow captures this preference – whether to speculate or hedge – and therefore serves as a practical proxy for conviction.
By contrast, passive liquidity from market makers is typically about inventory and does not express directional conviction. Combining the taker side with the premium paid or received moves us from activity to allocation: we can see who is paying, for what purpose, and at which strike/price levels, which is why metrics based on premiums and taker flows add clarity that volume or open interest alone cannot.
New Options Metrics: Definitions & Uses
Our new metric suite covers BTC, ETH, SOL, BNB, and XRP, with historical data back to 2021 from major exchanges, including Deribit, OKX, Bybit, and Binance.
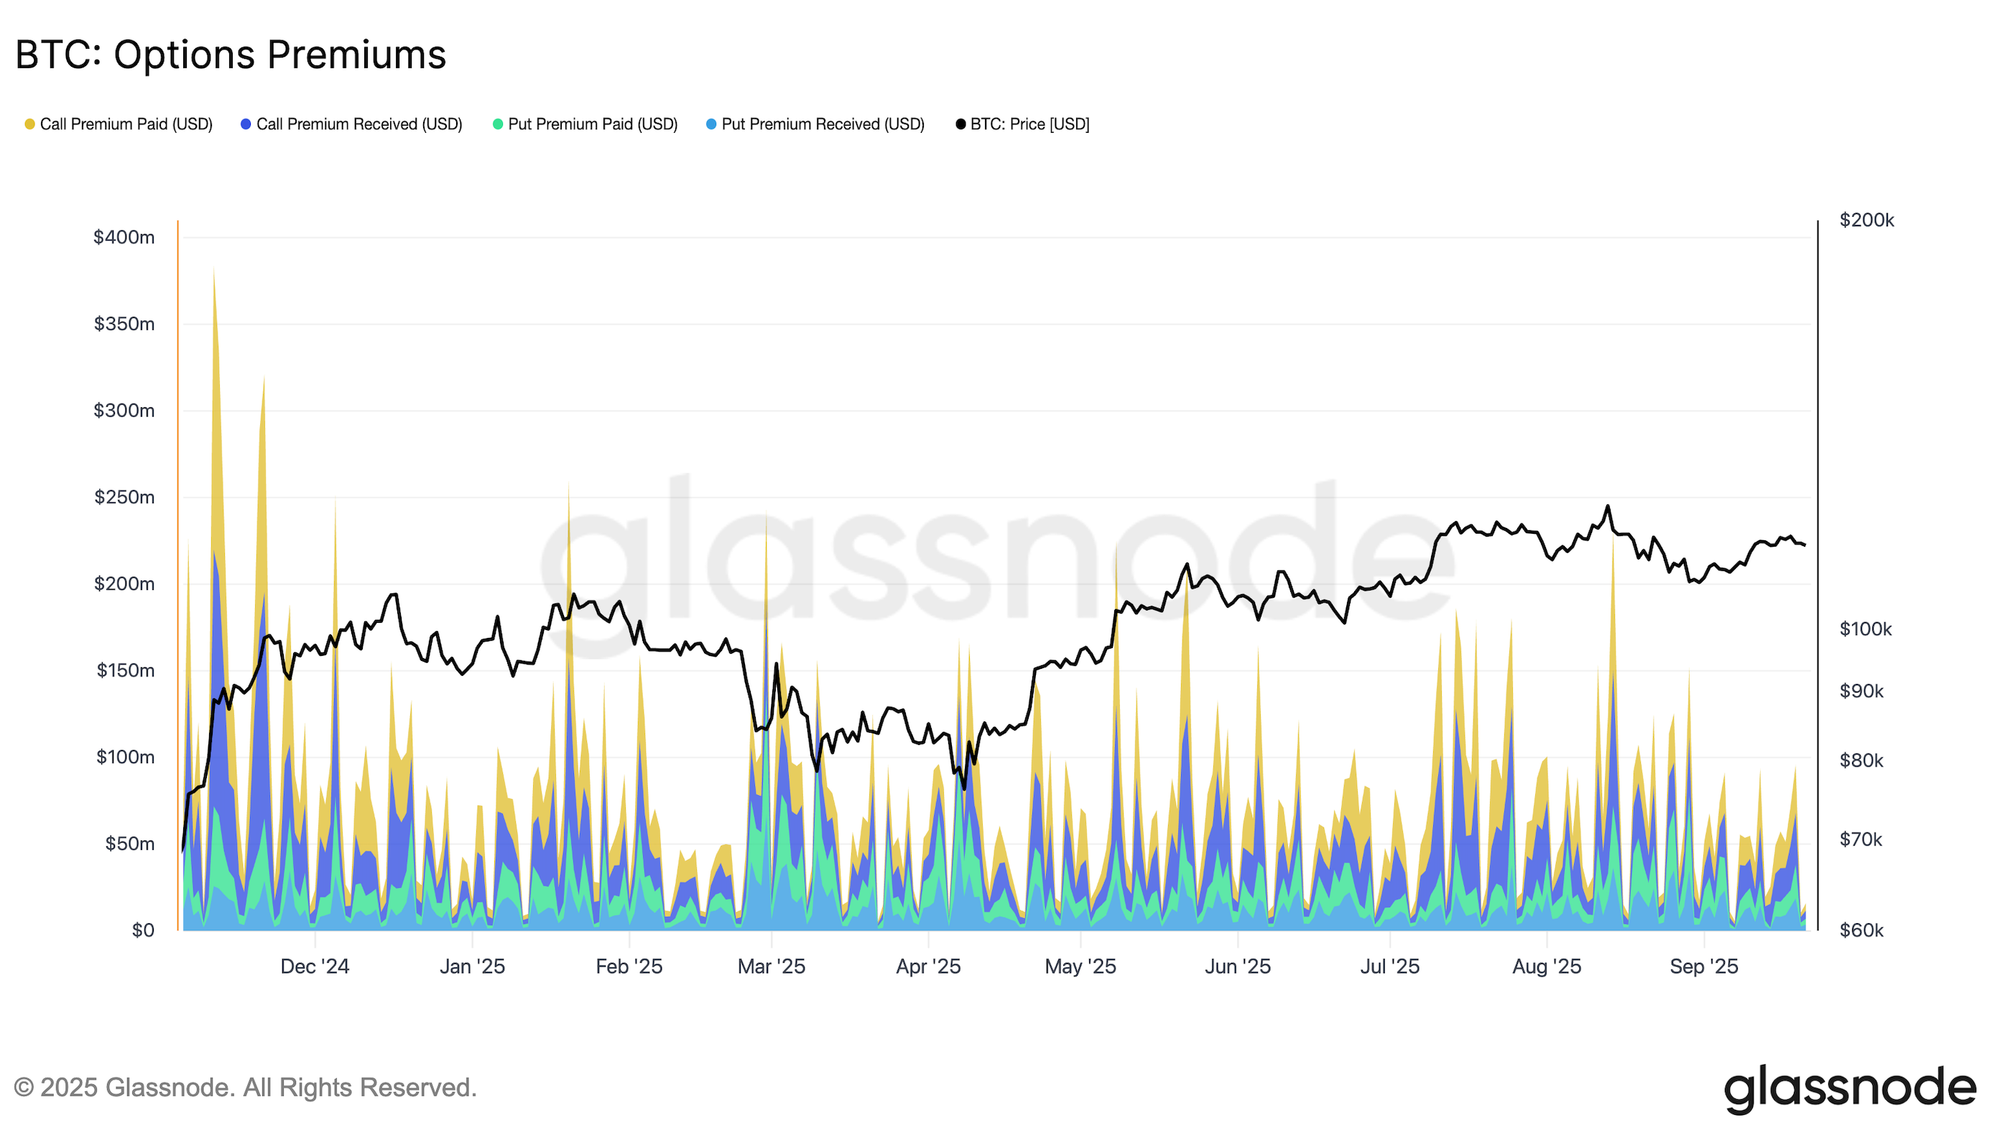
Daily Options Premiums
Visualizes gross premium flow in USD, split by Call Paid/Received and Put Paid/Received. Use it to gauge where capital is being committed and the market’s directional tilt.
Put Premium Received (USD): The total amount earned from selling puts. Often reflects traders selling volatility or expressing a slightly neutral-to-bullish view, as put sellers benefit from stable or rising prices.
Put Premium Paid (USD): The total amount spent to buy puts. Typically used as downside protection or to express a bearish outlook on the market.
Call Premium Received (USD): The total amount earned from selling calls. Indicates neutral-to-bearish sentiment or an attempt to generate yield in a range-bound market by selling volatility.
Call Premium Paid (USD): The total amount spent to buy calls. Generally associated with bullish positioning, as traders seek upside exposure with defined risk.
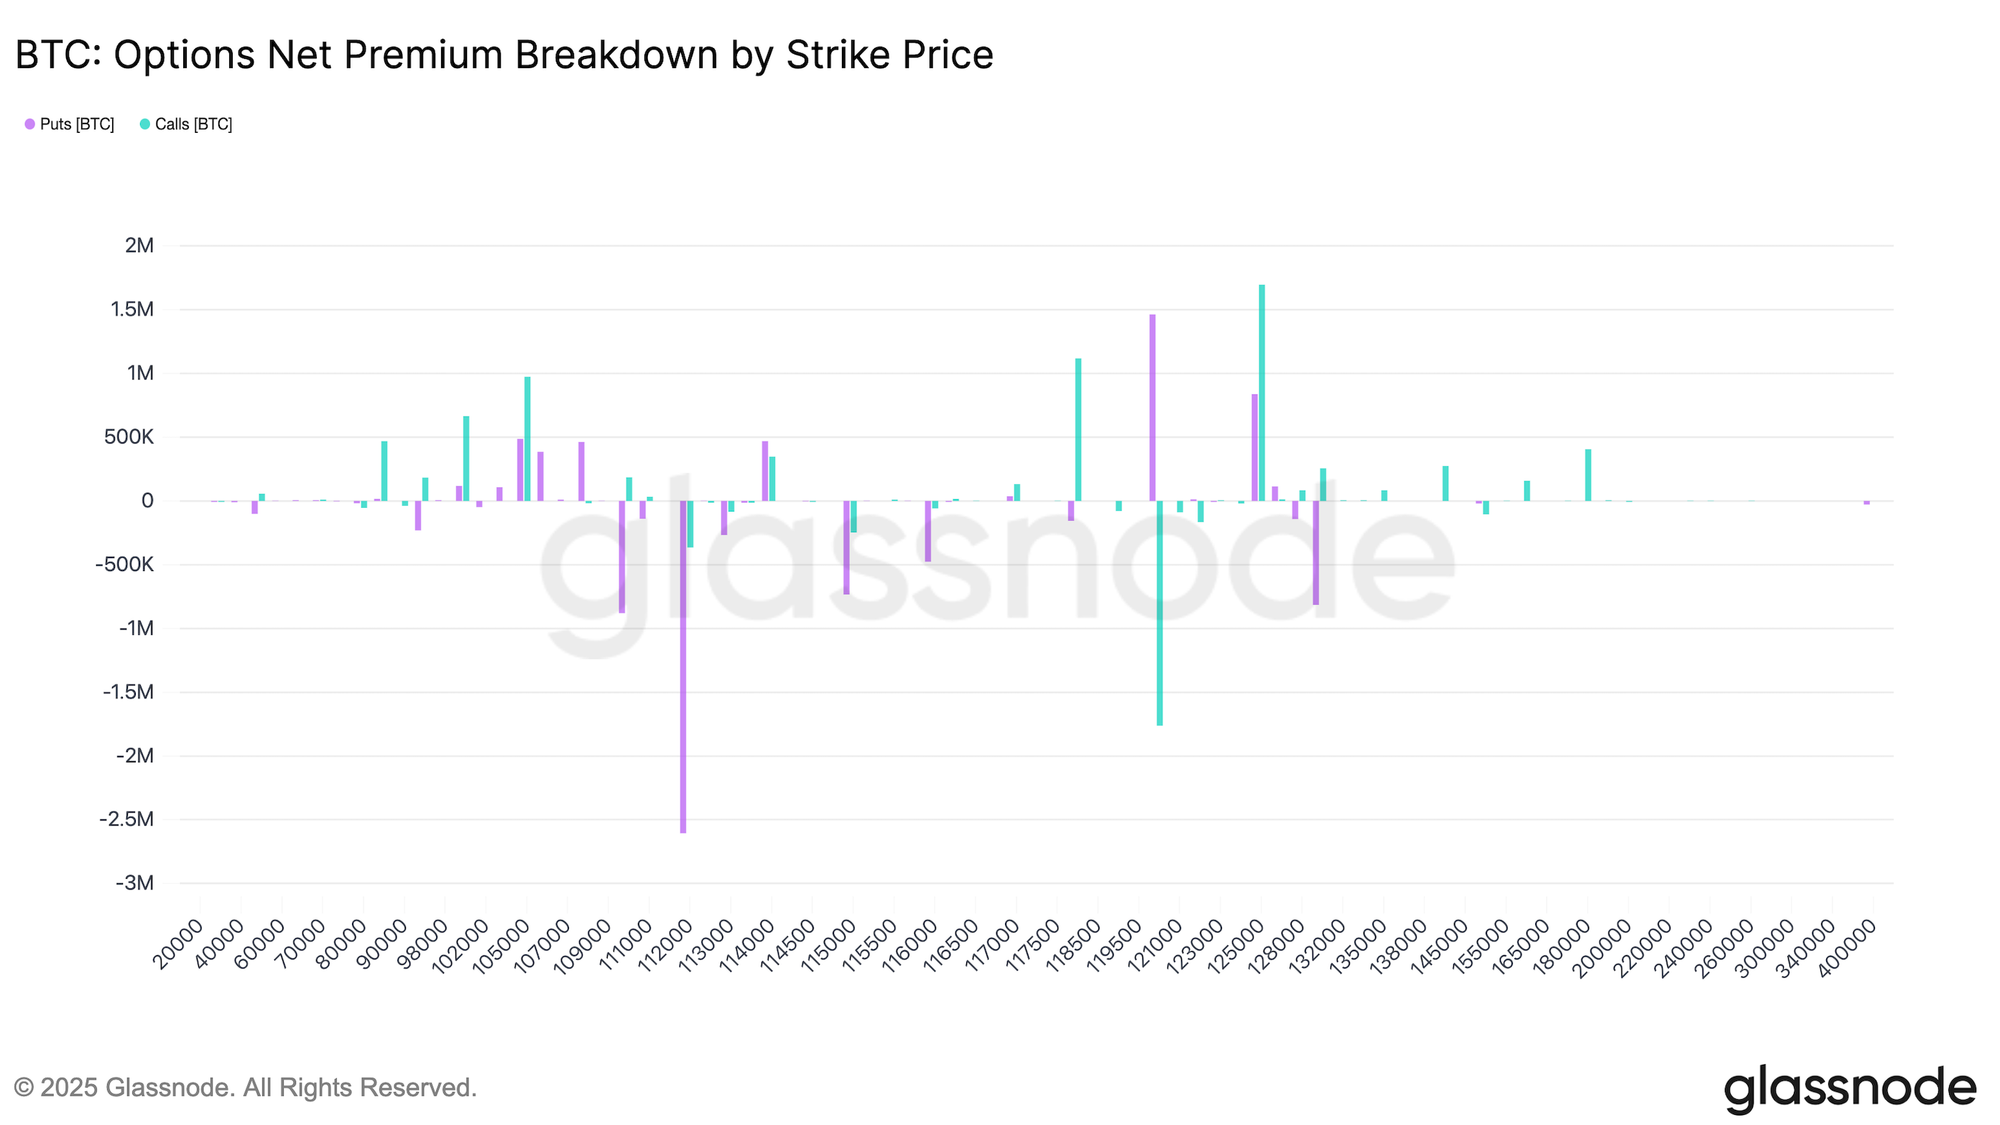
Options Net Premium Breakdown by Strike
This detailed chart tracks net call and put premiums (paid minus received) across strikes over the past 24 hours. It helps you identify where capital is being allocated across specific price levels, which can act as key support and resistance zones. For example, negative values above the current spot price may indicate net call selling, suggesting traders are capping upside.
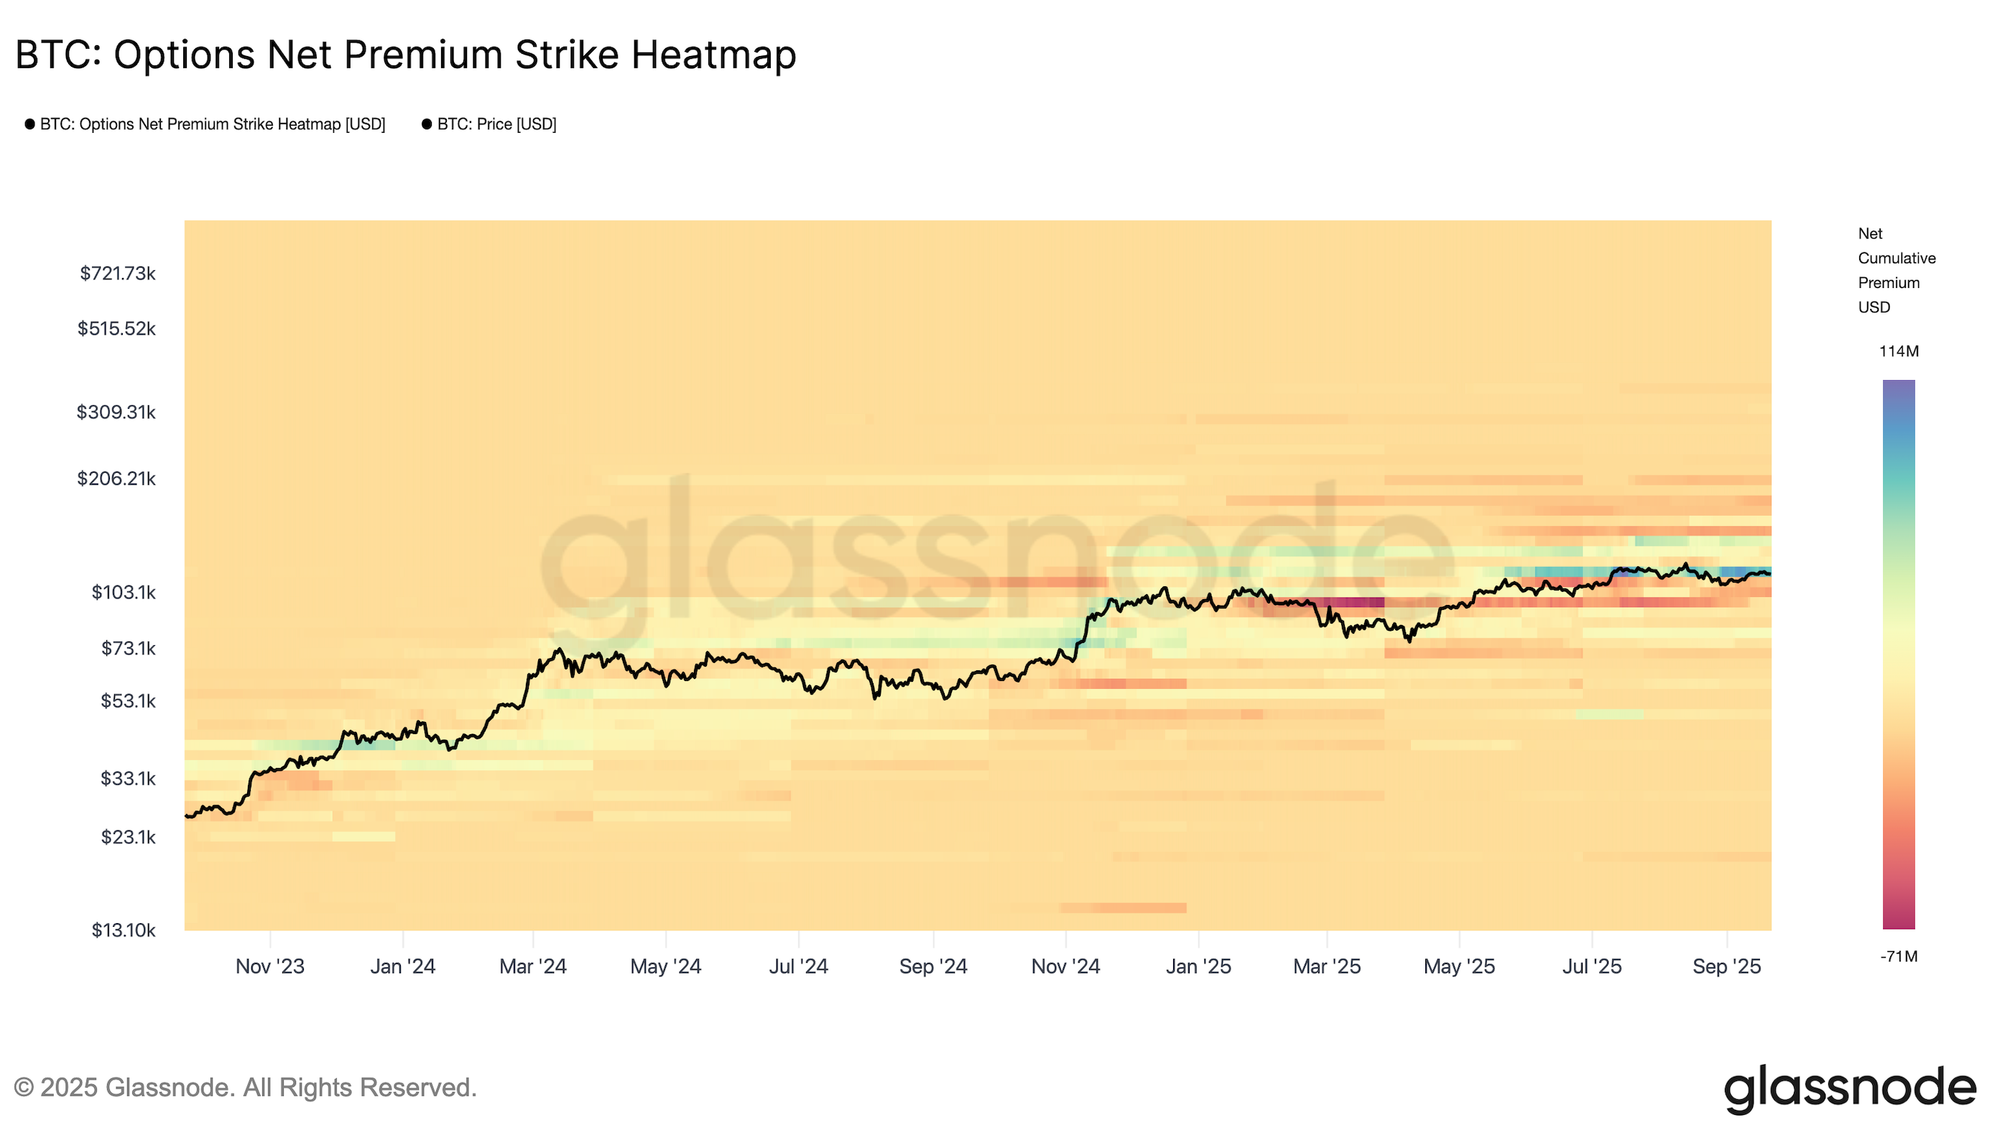
Options Net Premium Strike Heatmap
This powerful visualization aggregates net premium flows over time and across strike prices. Blue/green tones indicate net buying activity, while red tones highlight net selling. By examining the distribution of net premium, you can identify key price levels that could act as magnets or zones of heightened risk. Because options positioning can reflect forward-looking market views, this visualization helps anticipate where traders expect significant price action.
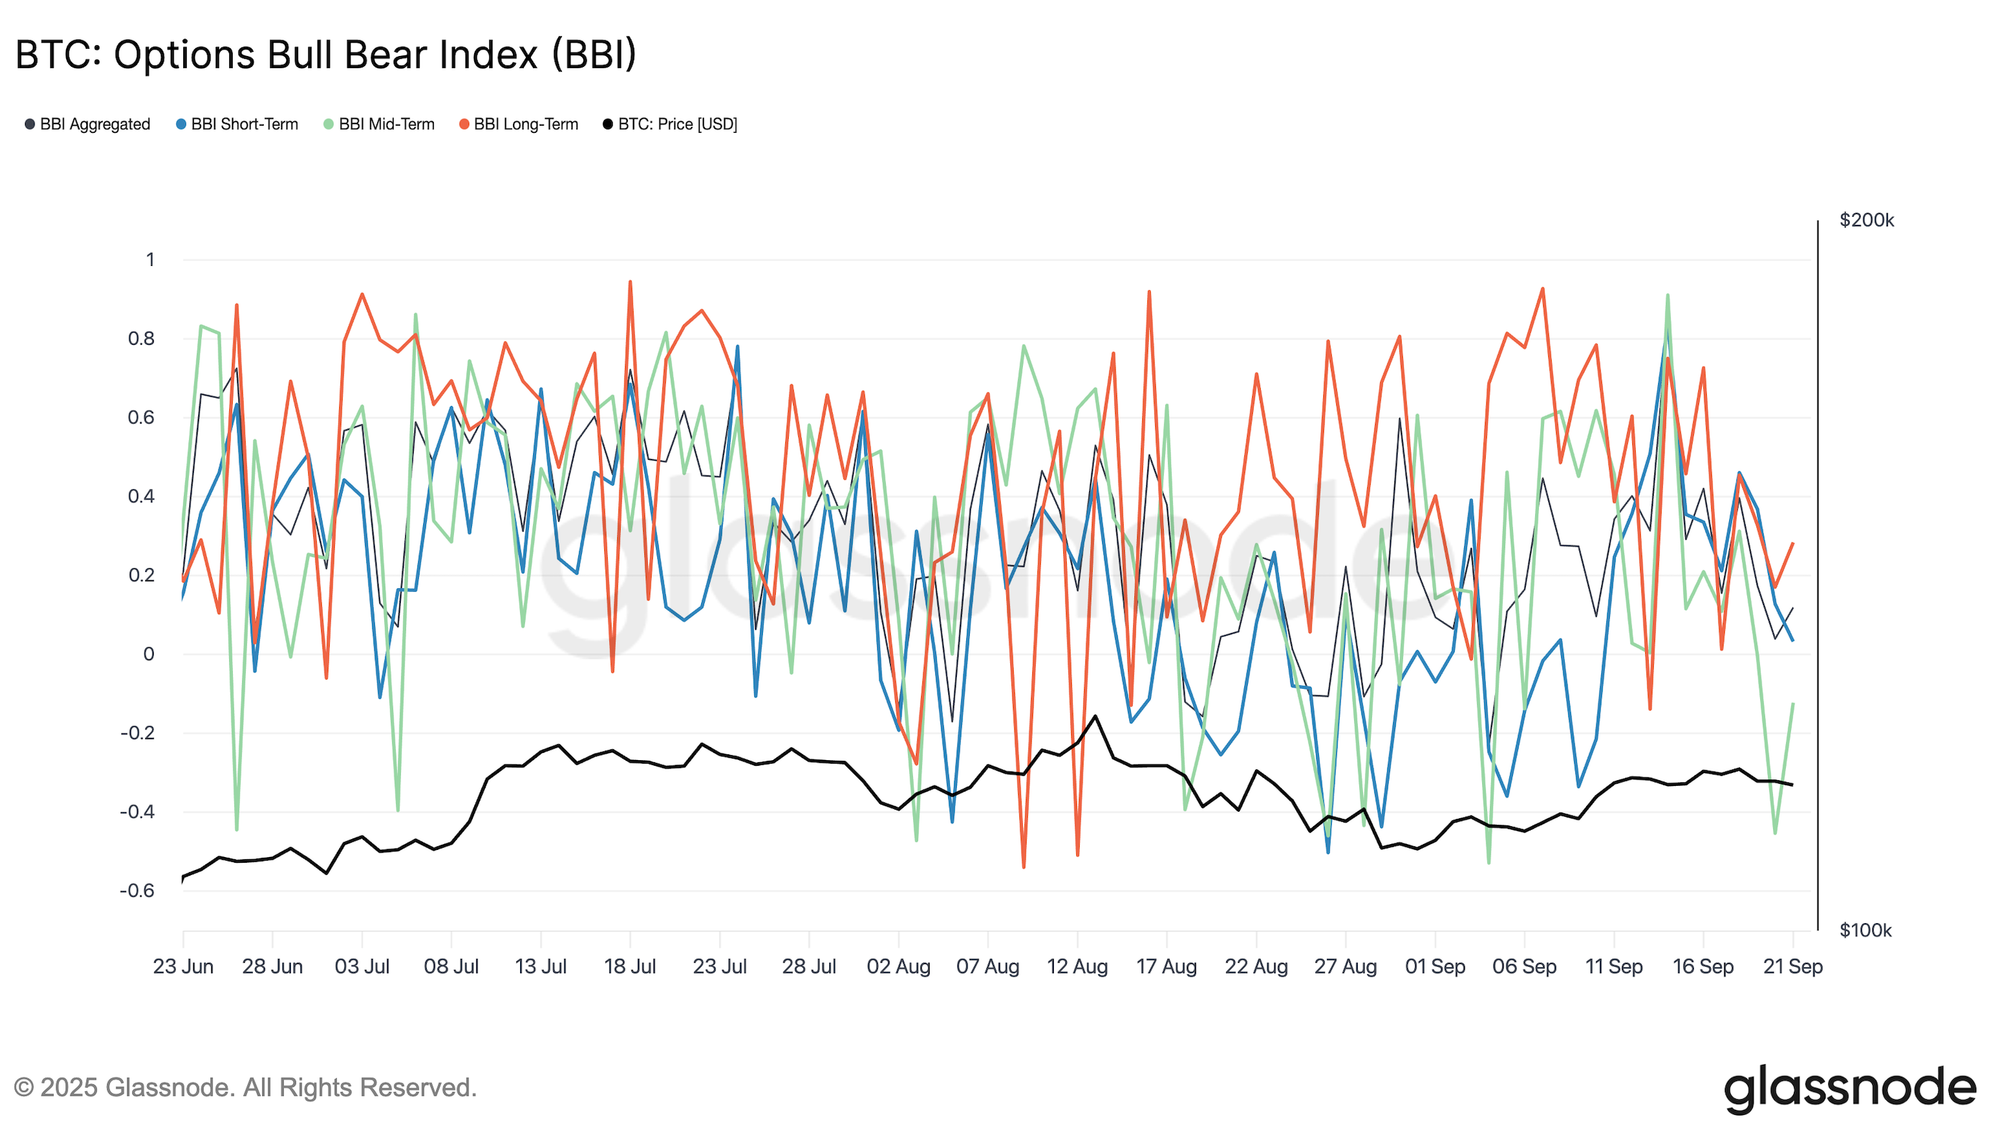
Options Bull–Bear Index (BBI)
Measures whether traders allocate more capital to call (bullish) or put (bearish) buying. It is defined as follow:
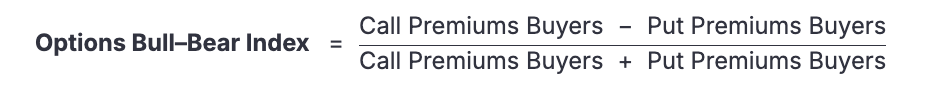
A value of +1 indicates only call option buyers (strong bullish sentiment), a −1 value indicates only put option buyers (strong bearish sentiment), and values near 0 indicate a neutral balance. The index is also segmented by options maturity to distinguish between short-term conviction, tactical positioning, and long-term structural sentiment.
Annotated Dashboard
What's Next
Over the next quarter, we'll build on this foundation by adding more advanced metrics related to Implied Volatility, Open Interest, and Greeks. We'll also provide more granular historical data for implied volatility across different strike prices, and introduce new metrics on strike price probability and gamma exposure. Glassnode is dedicated to establishing itself as the leader in the crypto derivative analytics space.
- Follow us on X for timely market updates and analysis
- Join our Telegram channel for regular market insights
- For on-chain metrics, dashboards, and alerts, visit Glassnode Studio
Disclaimer: This report is for informational and educational purposes only. The analysis represents a limited case study with significant constraints and should not be interpreted as investment advice or definitive trading signals. Past performance patterns do not guarantee future results. Always conduct thorough due diligence and consider multiple factors before making investment decisions.