Introducing: Strategy Watch
Our monthly analysis of fund performance, capital flows and allocator trends in digital assets, helping professionals get a clear view of how institutional capital is positioned.

The latest, second edition of Strategy Watch is now live.
Welcome to Strategy Watch
In a rapidly evolving market, where traders and funds chase returns amid volatility, while asset allocators seek data-driven conviction for long-term positioning, Glassnode occupies a unique vantage point. Our on-chain and wider market intelligence has served as a cornerstone for both groups since 2018, earning their trust through consistent, impartial data, analytics and research.
A core Glassnode belief is that genuine insight in digital assets comes from neutrality and depth, unbiased data that empowers decisions across the ecosystem. That is why we are thrilled to launch Strategy Watch, a new monthly newsletter dedicated to the analysis of fund-level performance and allocation trends in digital assets.
We hope to bring value by regularly delivering clear, high-signal analysis of capital flows, head-to-head strategy performance benchmarks, and the most important allocation moves actually being made by institutions and funds. But this is just the beginning. We are actively exploring ways to bridge these worlds further, and would love your feedback as Strategy Watch evolves.
Inside Strategy Watch
The report is structured across six core sections, each focused on a distinct dimension of institutional activity in digital assets:
- Institutional Flow Monitor
- Fund and SMA Performance
- On-chain Vault Performance
- Manager Monitor
- Allocation Updates
The full report is available in PDF format.

The Premier Digital Assets Allocator Platform. Learn more
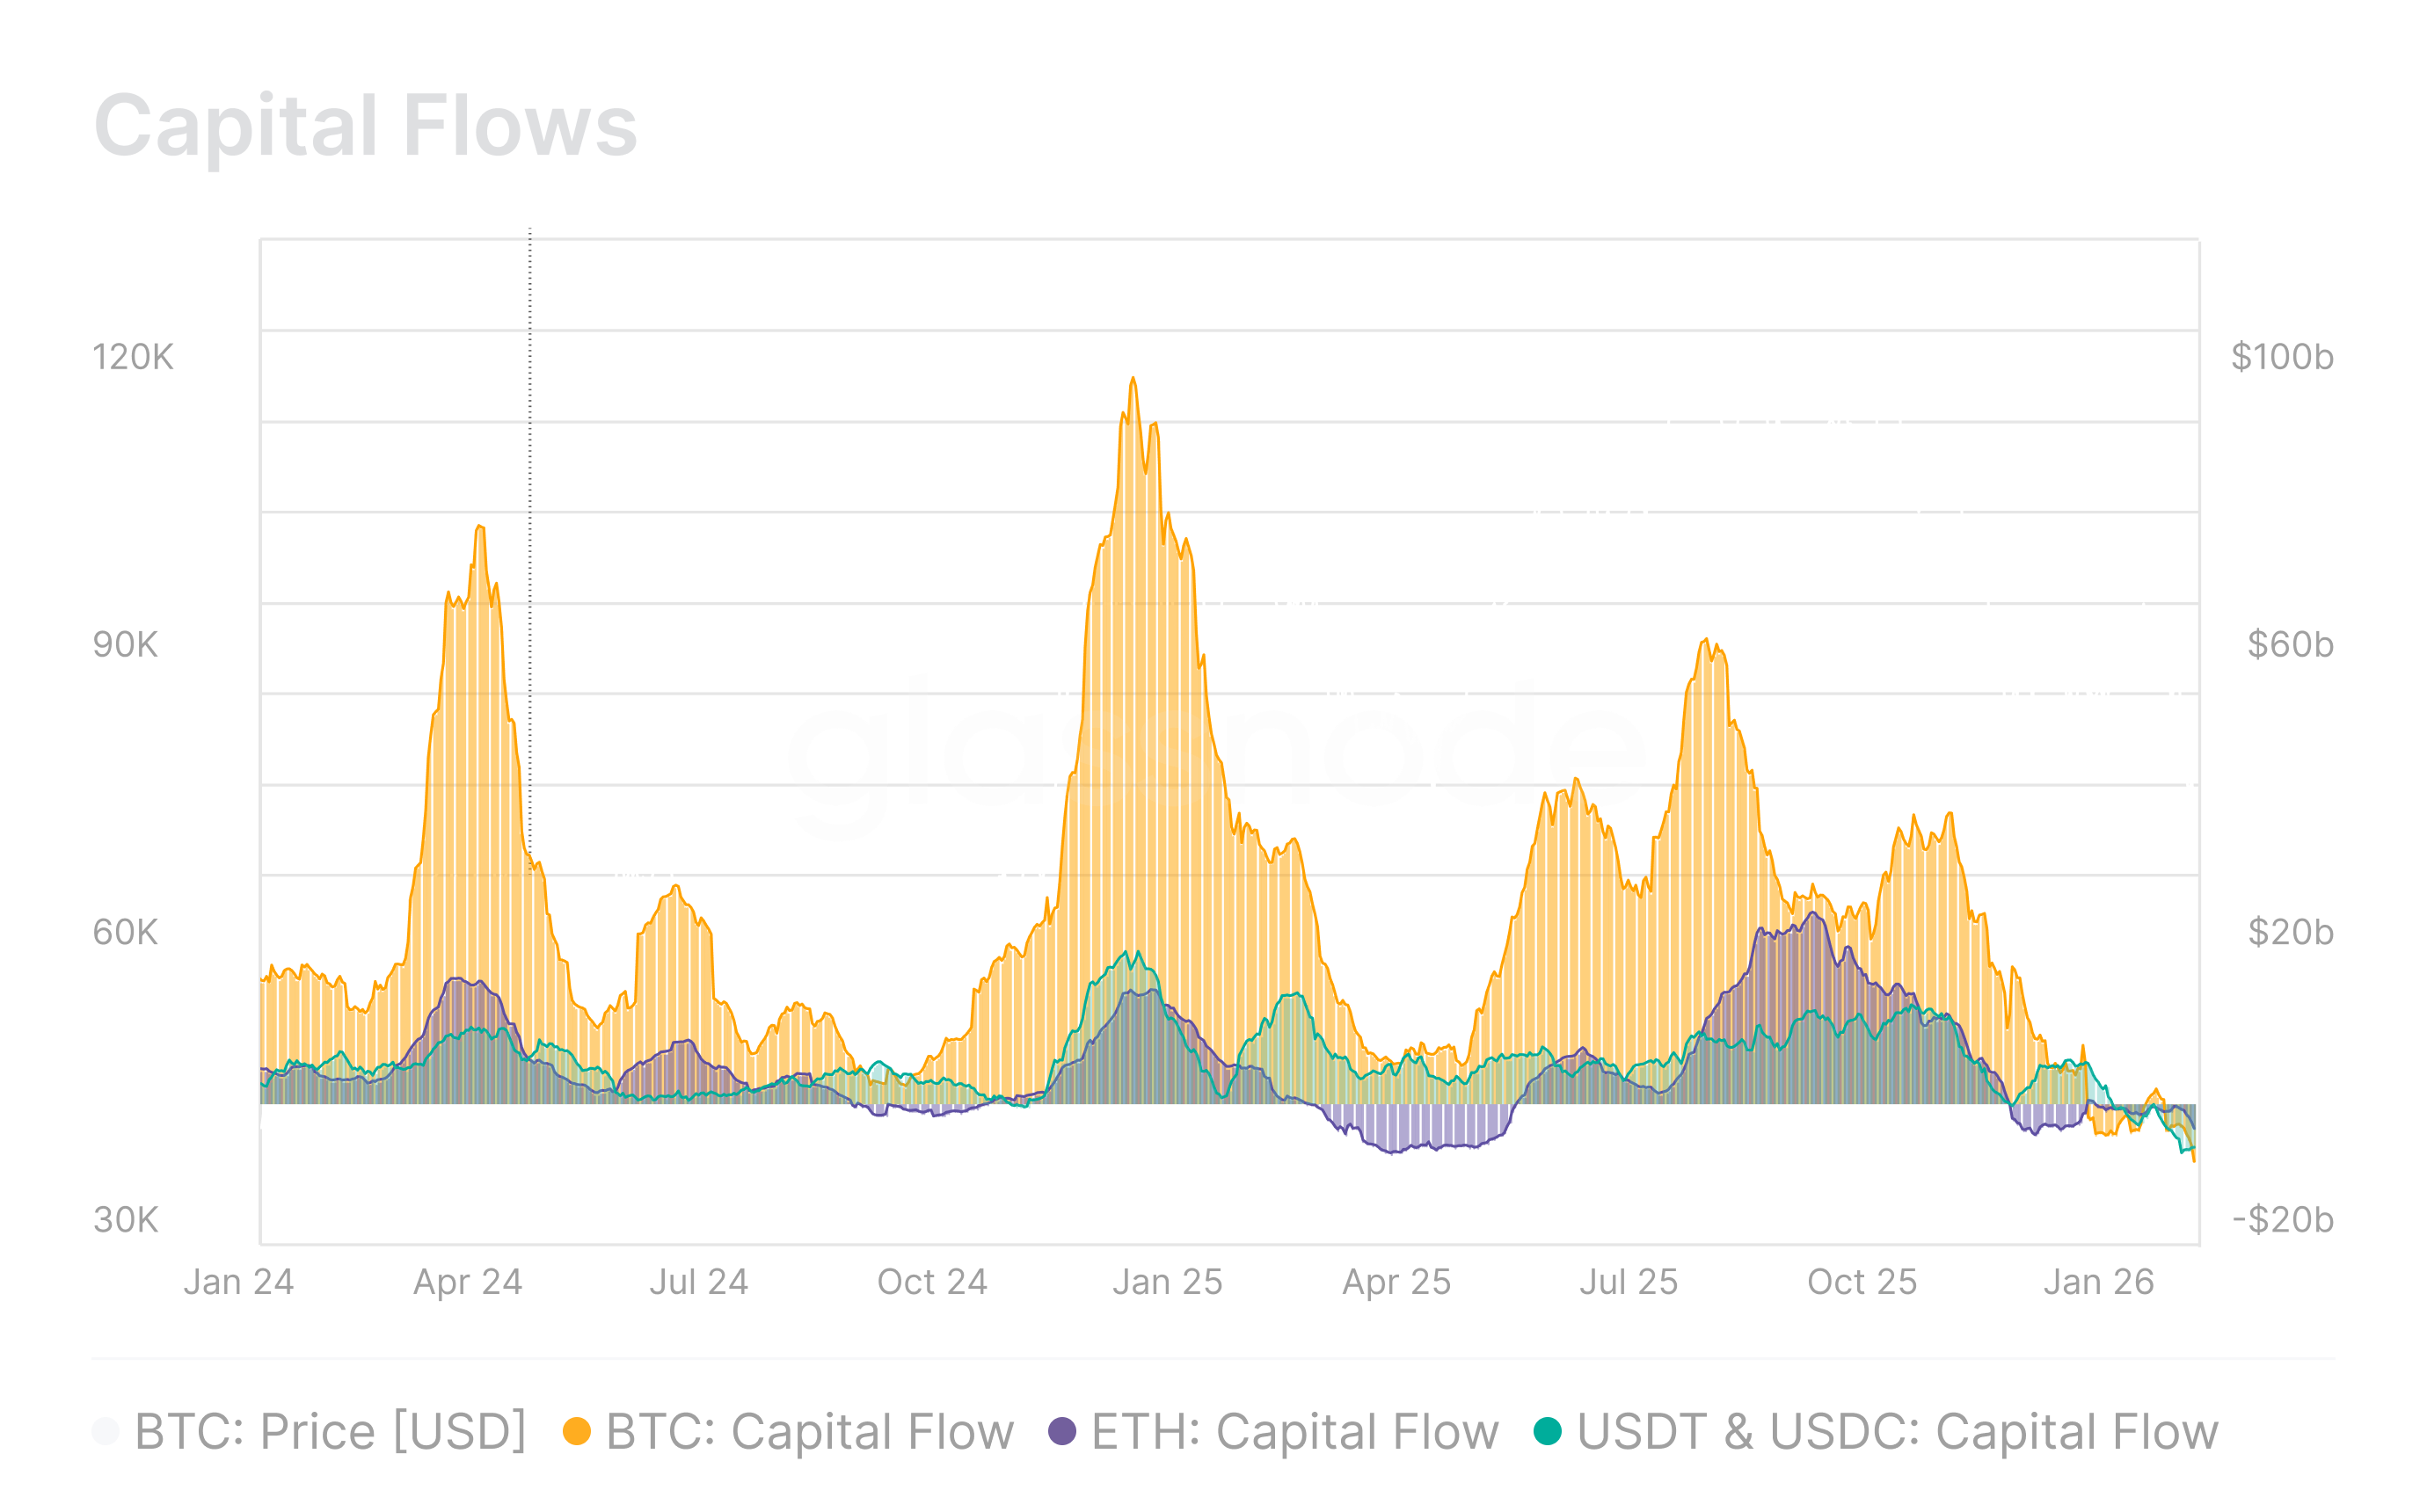
Institutional Flow Monitor
Bitcoin, Ethereum, and Stablecoins have seen a clear slowdown in capital inflows, signalling weakening demand and a structural contraction in liquidity. All three assets have now shifted into net outflow, with Bitcoin at –$8.4B per month, Ethereum at –$3.8B, and stablecoins at –$6.4B. This broad-based drawdown across core crypto assets reflects a defensive regime, where institutional capital is de-risking rather than re-entering risk positions. This negative trend has further accelerated as of January 2026.
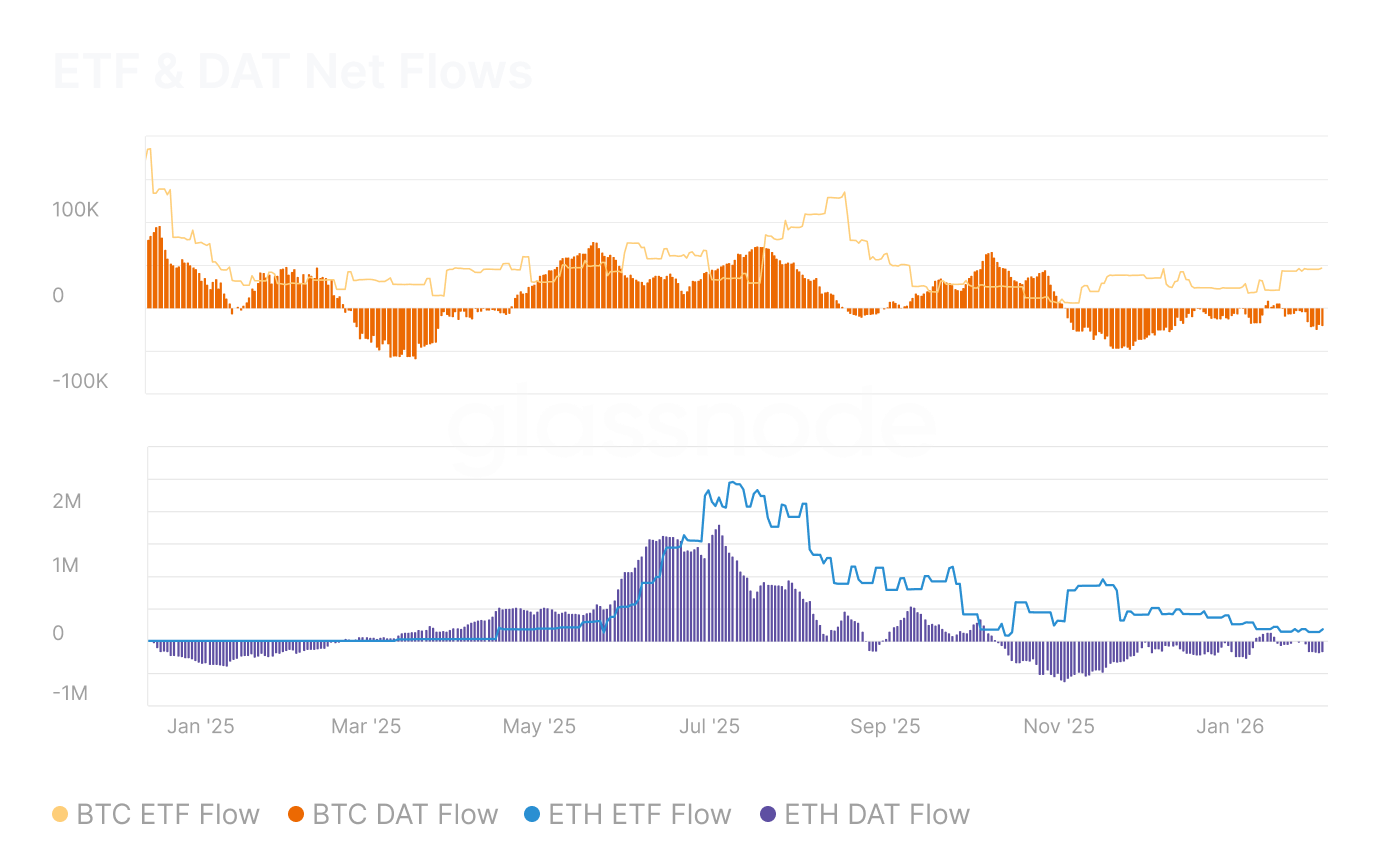
ETF & DAT Net Flows
Net flows into these vehicles act as a proxy for institutional demand. In Q4 2025 and early January, institutions were net sellers through the ETF channel, with Bitcoin ETF outflows approximating –35.8k BTC per month and Ethereum ETF flows around –257.6k ETH per month. Over the same period, DATs saw strong inflows in August 2025 driven by new product launches, but buy pressure has since softened; nonetheless, flows into DATs remain positive, indicating ongoing, albeit weaker, institutional interest via balance-sheet exposure.
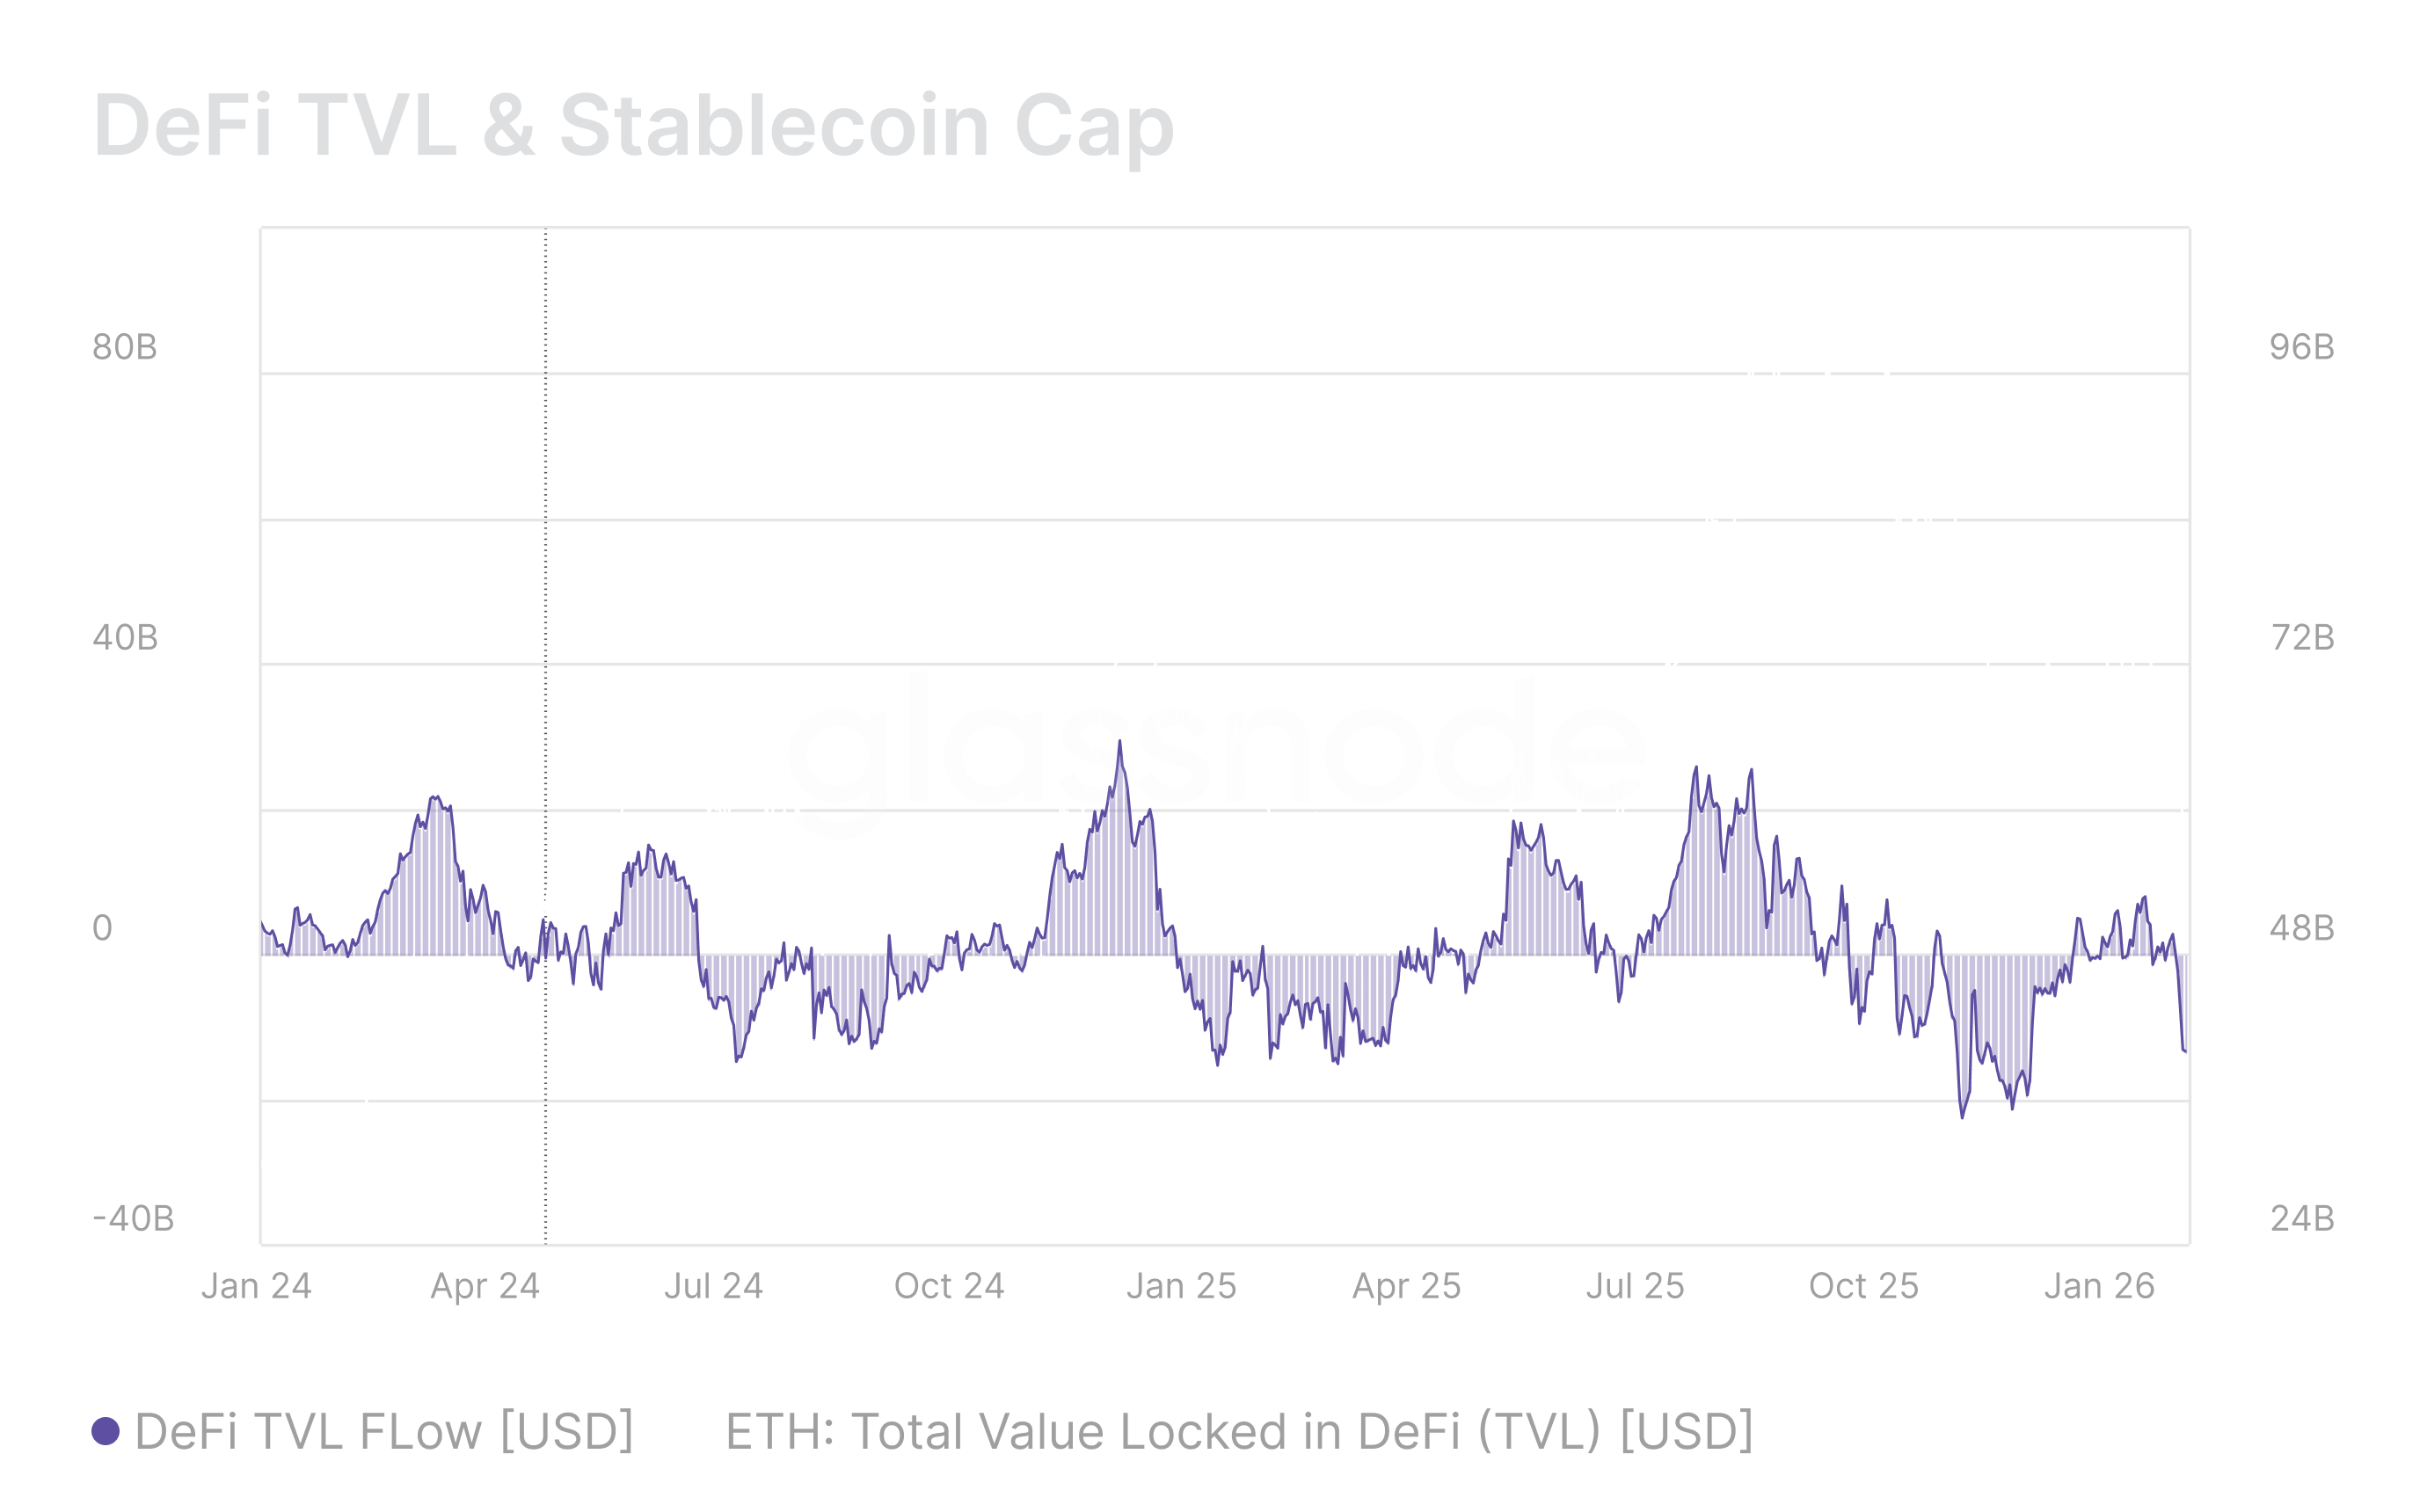
DeFi TVL & Stablecoin Cap
DeFi has served as another active playground for institutional capital through strategies such as liquidity provisioning, collateralized lending, and structured yield harvesting. Total Value Locked (TVL) on Ethereum, began to shrink from August 2025 onward, and is now declining at approximately –$15.3M per month. A contraction in TVL implies that larger allocators are withdrawing from on-chain financial services, reducing liquidity depth and signalling softer conviction in DeFi yield and risk-adjusted returns relative to alternative venues.
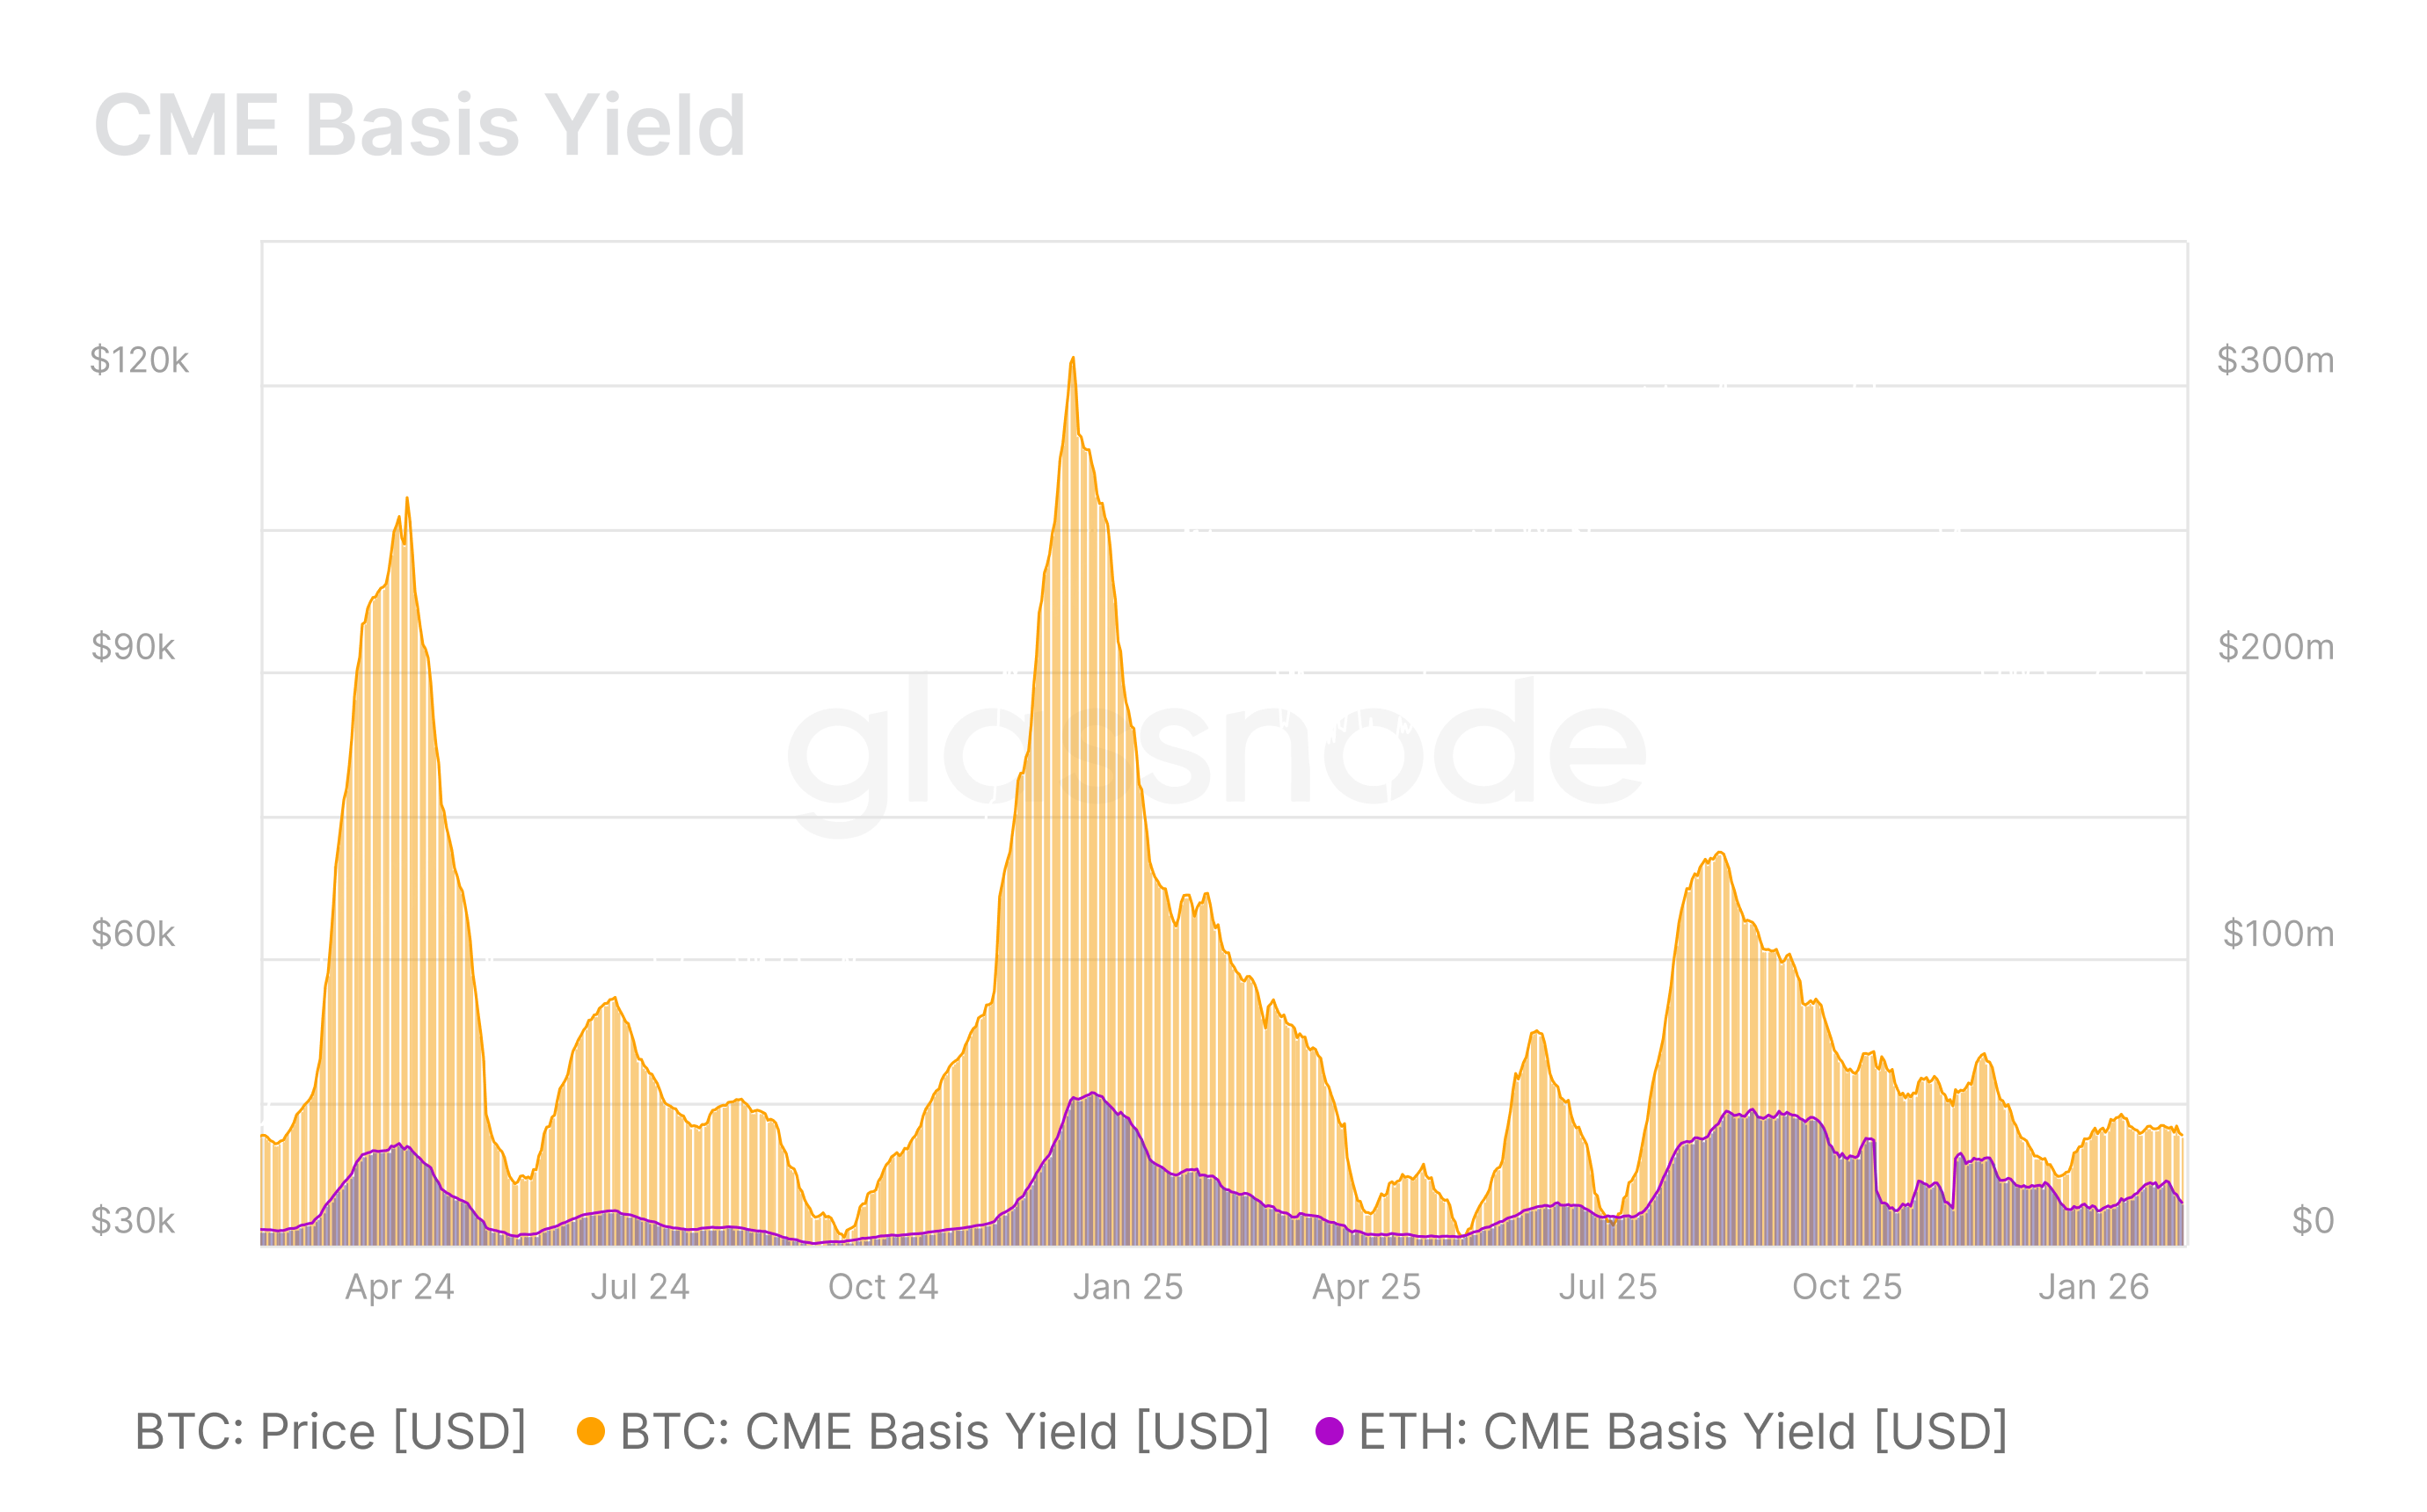
CME Basis Yield
Another key dimension of institutional engagement is the CME Basis Yield, which estimates the monthly dollar value earned by institutions from cash-and-carry strategies, capturing the premium between spot prices and CME calendar futures. Since August 2025, both Bitcoin and Ethereum have seen a sharp compression in this yield, with Bitcoin declining from approximately $136.6M to $38.6M per month, and Ethereum from $47.5M to $14.8M per month. This contraction rreflects reduced leverage deployment, softer futures demand, and a broader pullback in balance-sheet commitment amid tightening liquidity conditions.

Want to feature in the next edition of Strategy Watch? Share your updates on recent launches or milestones.
Disclaimer: This report does not provide any investment advice. All data is provided for information and educational purposes only. No investment decision shall be based on the information provided here and you are solely responsible for your own investment decisions. Exchange balances presented are derived from Glassnode’s comprehensive database of address labels, which are amassed through both officially published exchange information and proprietary clustering algorithms. While we strive to ensure the utmost accuracy in representing exchange balances, it is important to note that these figures might not always encapsulate the entirety of an exchange’s reserves, particularly when exchanges refrain from disclosing their official addresses. We urge users to exercise caution and discretion when utilizing these metrics. Glassnode shall not be held responsible for any discrepancies or potential inaccuracies. Please read our Transparency Notice when using exchange data.