The Week On-chain (Week 17, 2021)
Bitcoin price continues to slide lower as on-chain signals weak hands are being shaken out, and strong hands are holding strong.


Bitcoin Market Overview
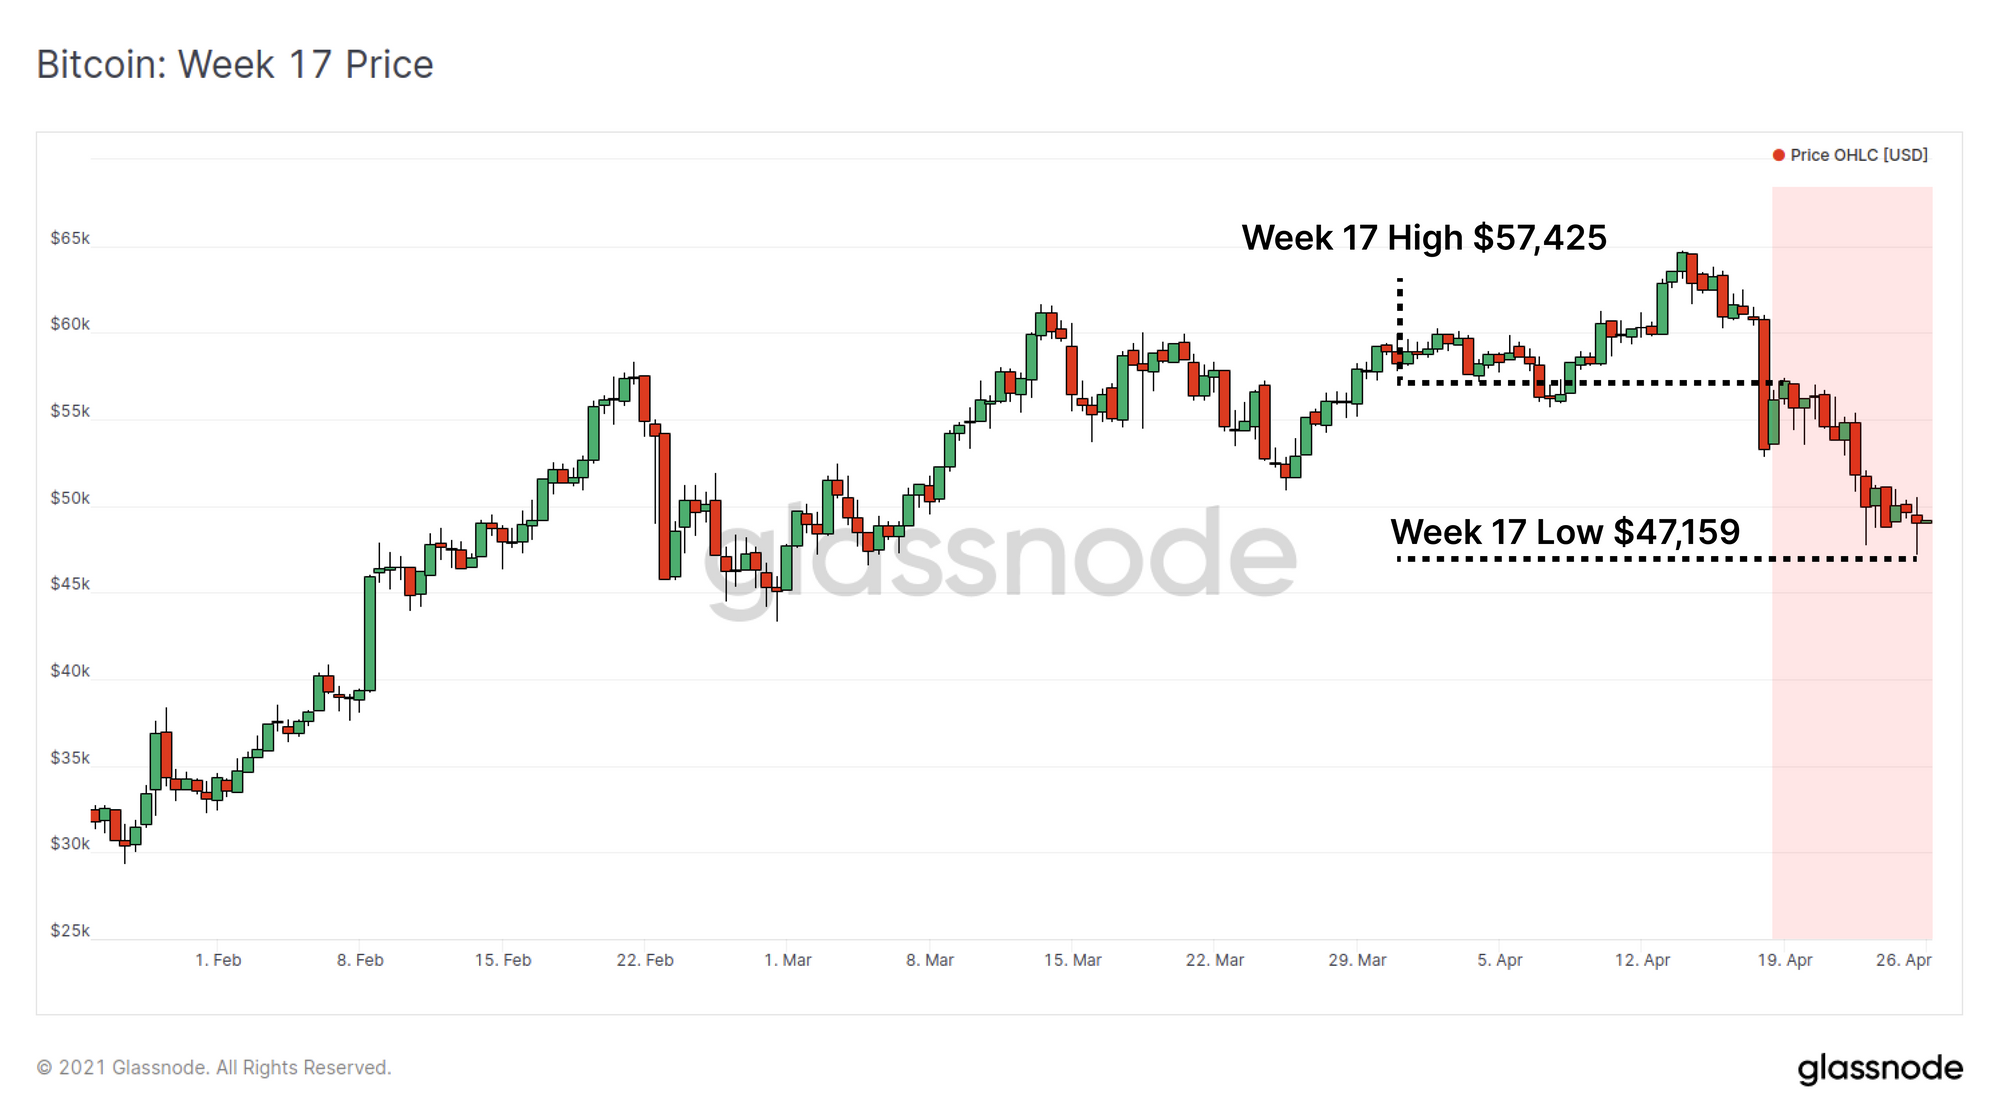
Bitcoin price continued to slide this week, opening at a high of $57,425 and trading down to an intra-day low of $47,159 over the weekend. Despite weak price performance, on-chain data indicates old coins remain tightly held, miners have recommenced accumulation and the majority of transaction demand is coming from short term holders.
Both on-chain transaction volume and fees peaked to new all-time highs this week whilst the typical age of spent coins has fallen back to levels not seen since price was below $20k. Overall this suggests this correction has largely affected relatively newer entrants to the market and strong hands remain strong.
On-chain Activity Peaks
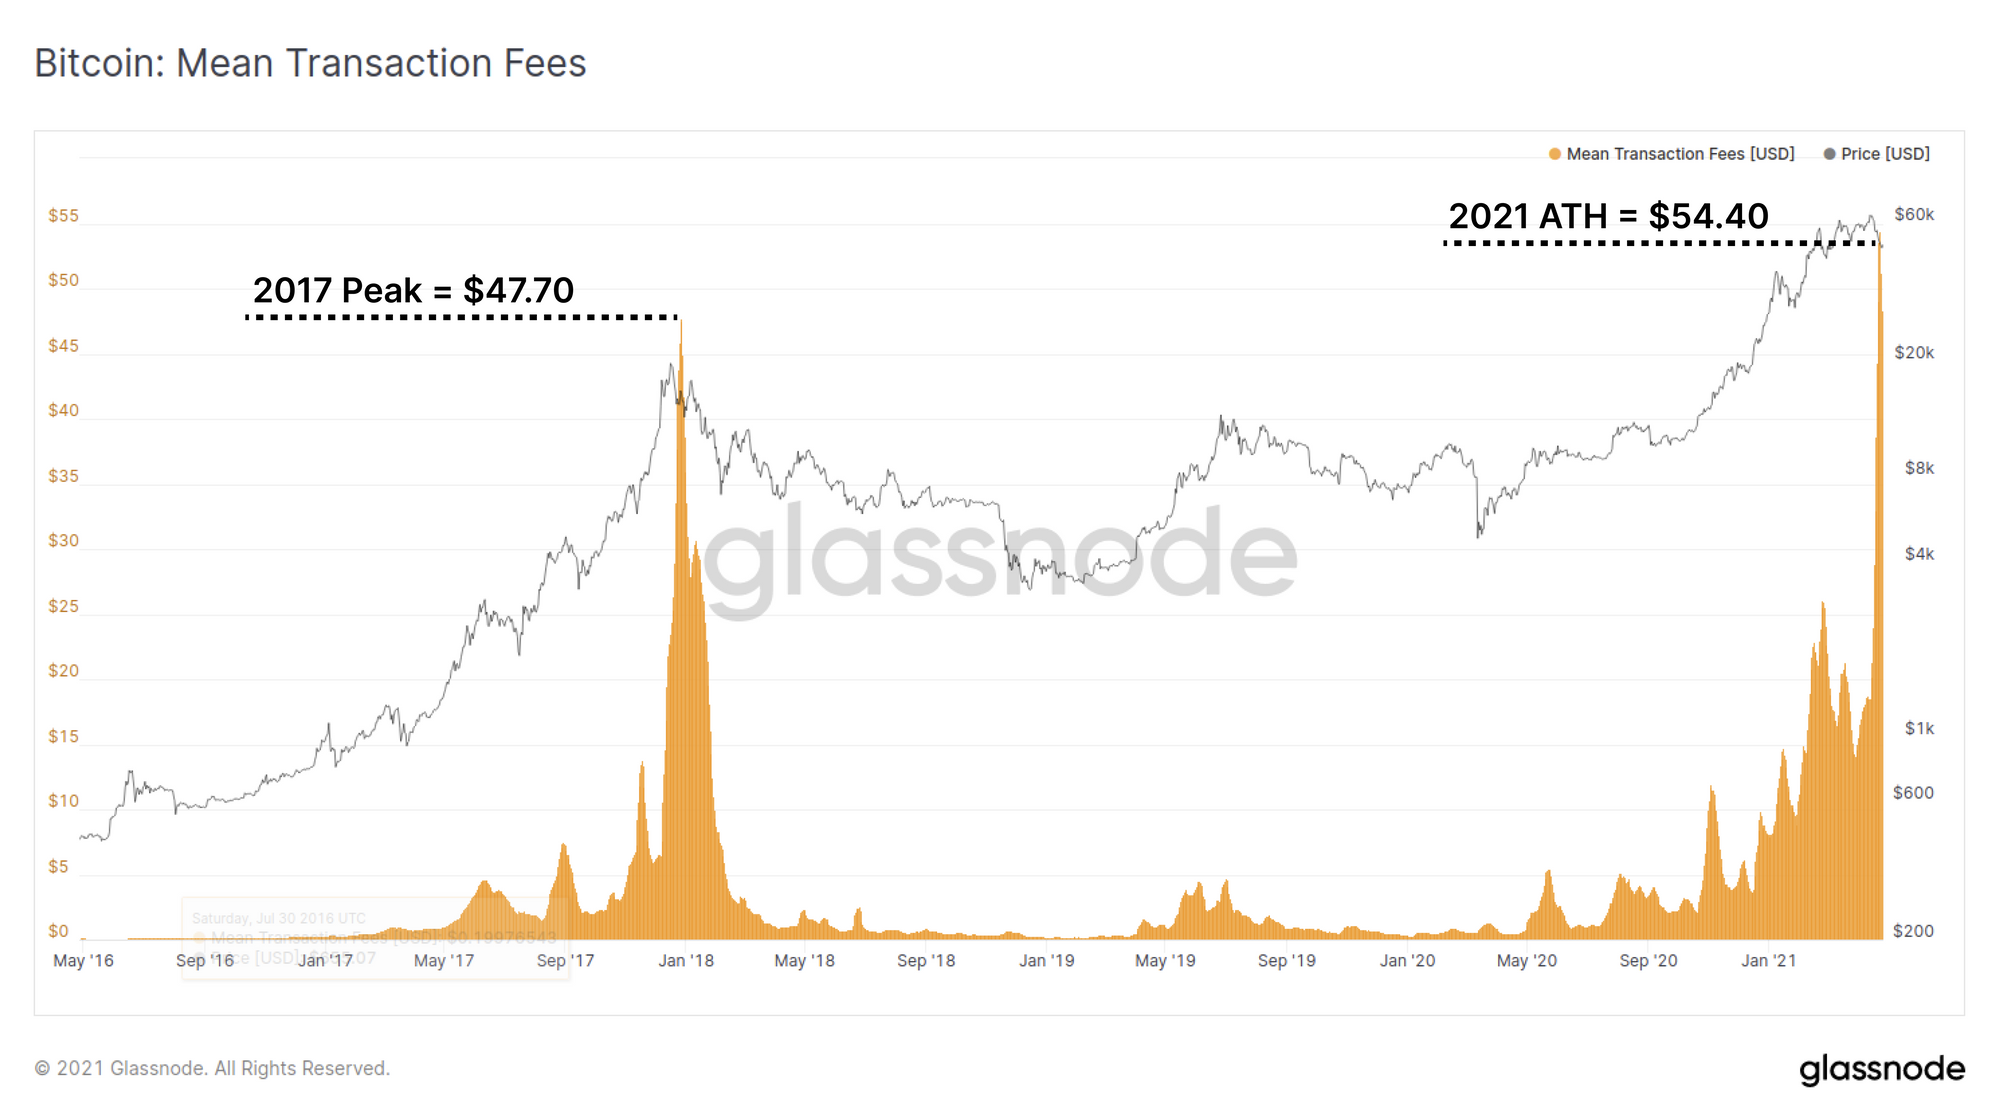
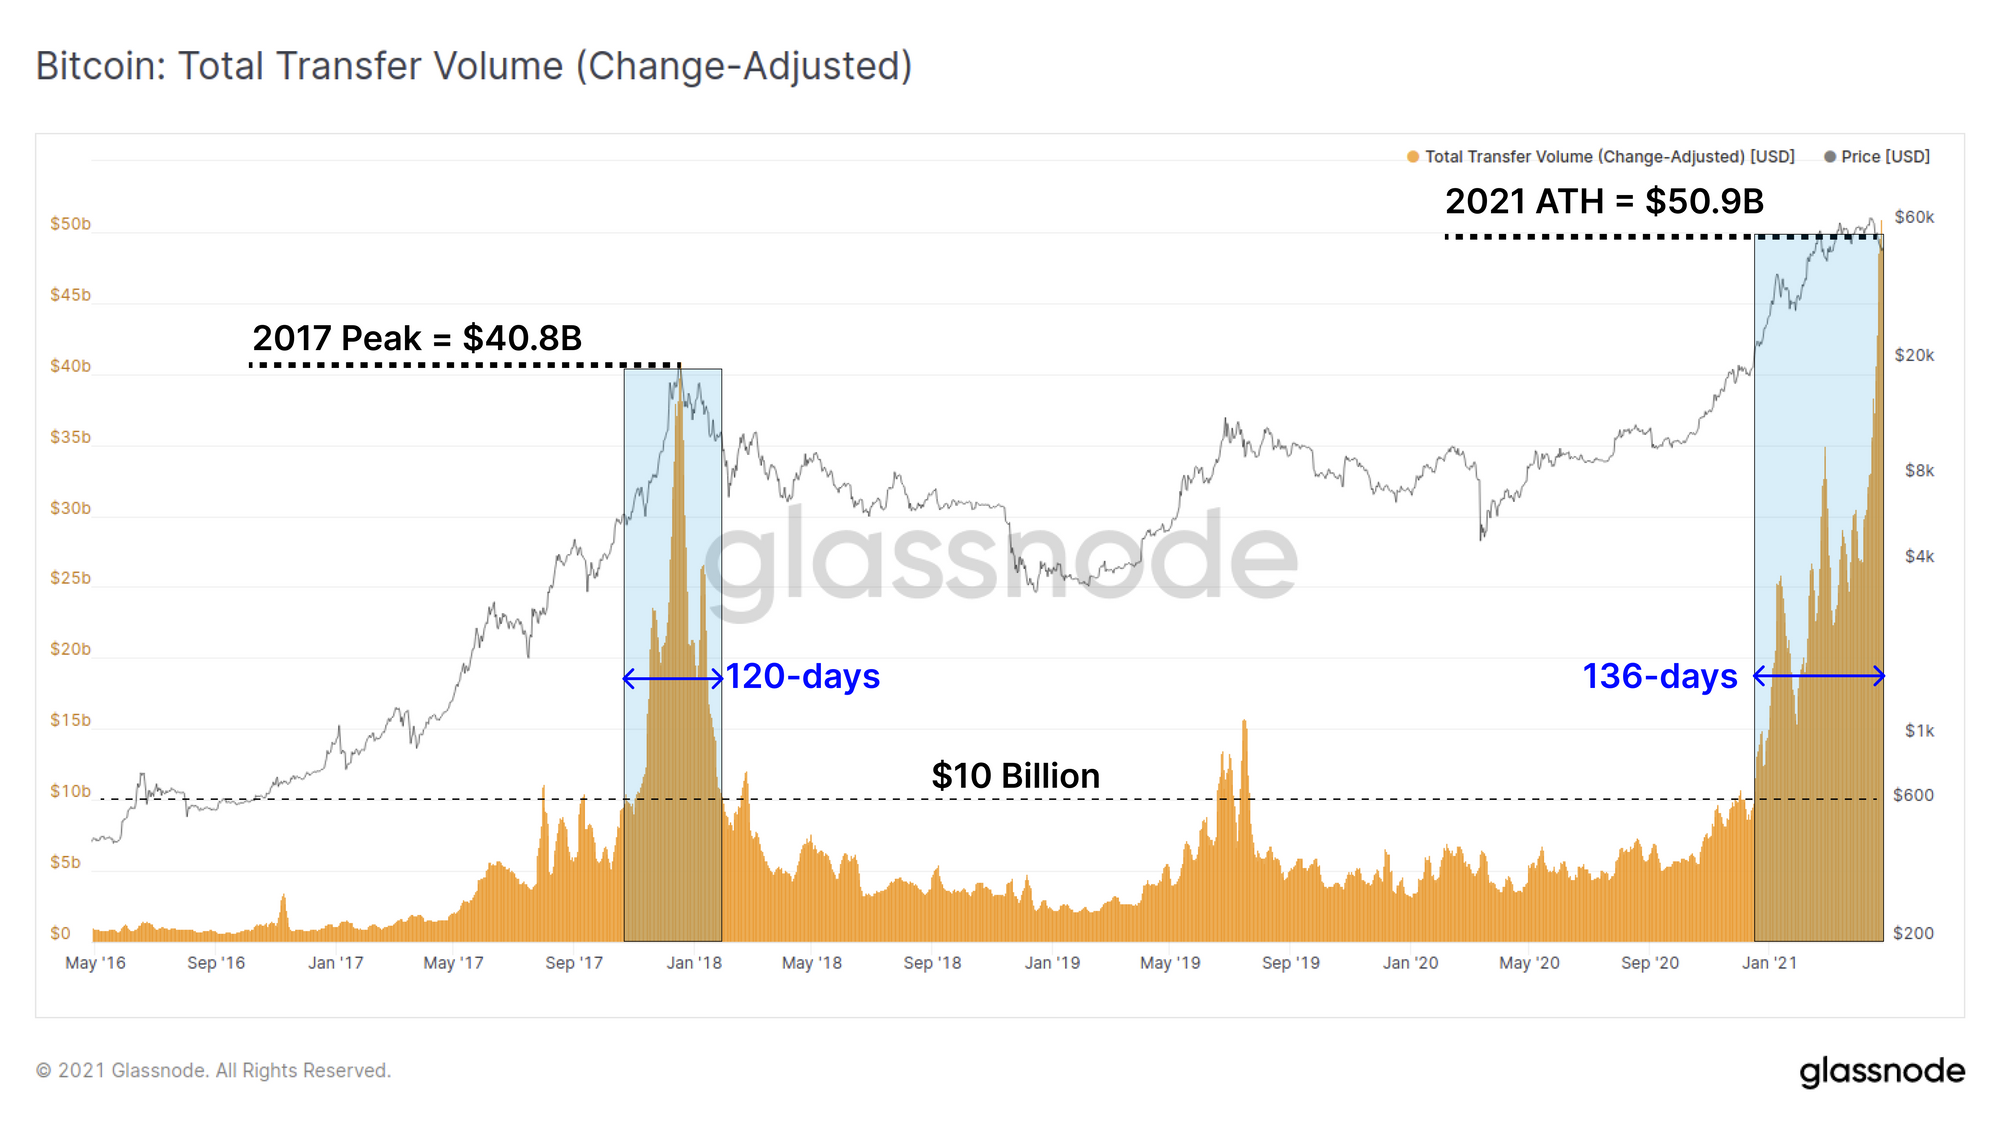
The Bitcoin network has been working through mempool congestion resulting from last weeks drop in hash-rate, coupled with increased demand for block-space during this price correction. This week, both on-chain transfer volume and average transaction fees hit new all time highs, eclipsing the peaks set in December 2017.
Network congestion pushed the average USD denominated transaction fee to a new high of $54.40 this week.
The 7-day moving average of transfer volume (change adjusted) reached new highs of over $50.9 Billion settled on a daily basis, almost 25% higher than the previous ATH. The network has now consistently settled more than $10B in transfer volume per day for a 136-day period, exceeding the peak duration observed in the 2017 bull market.
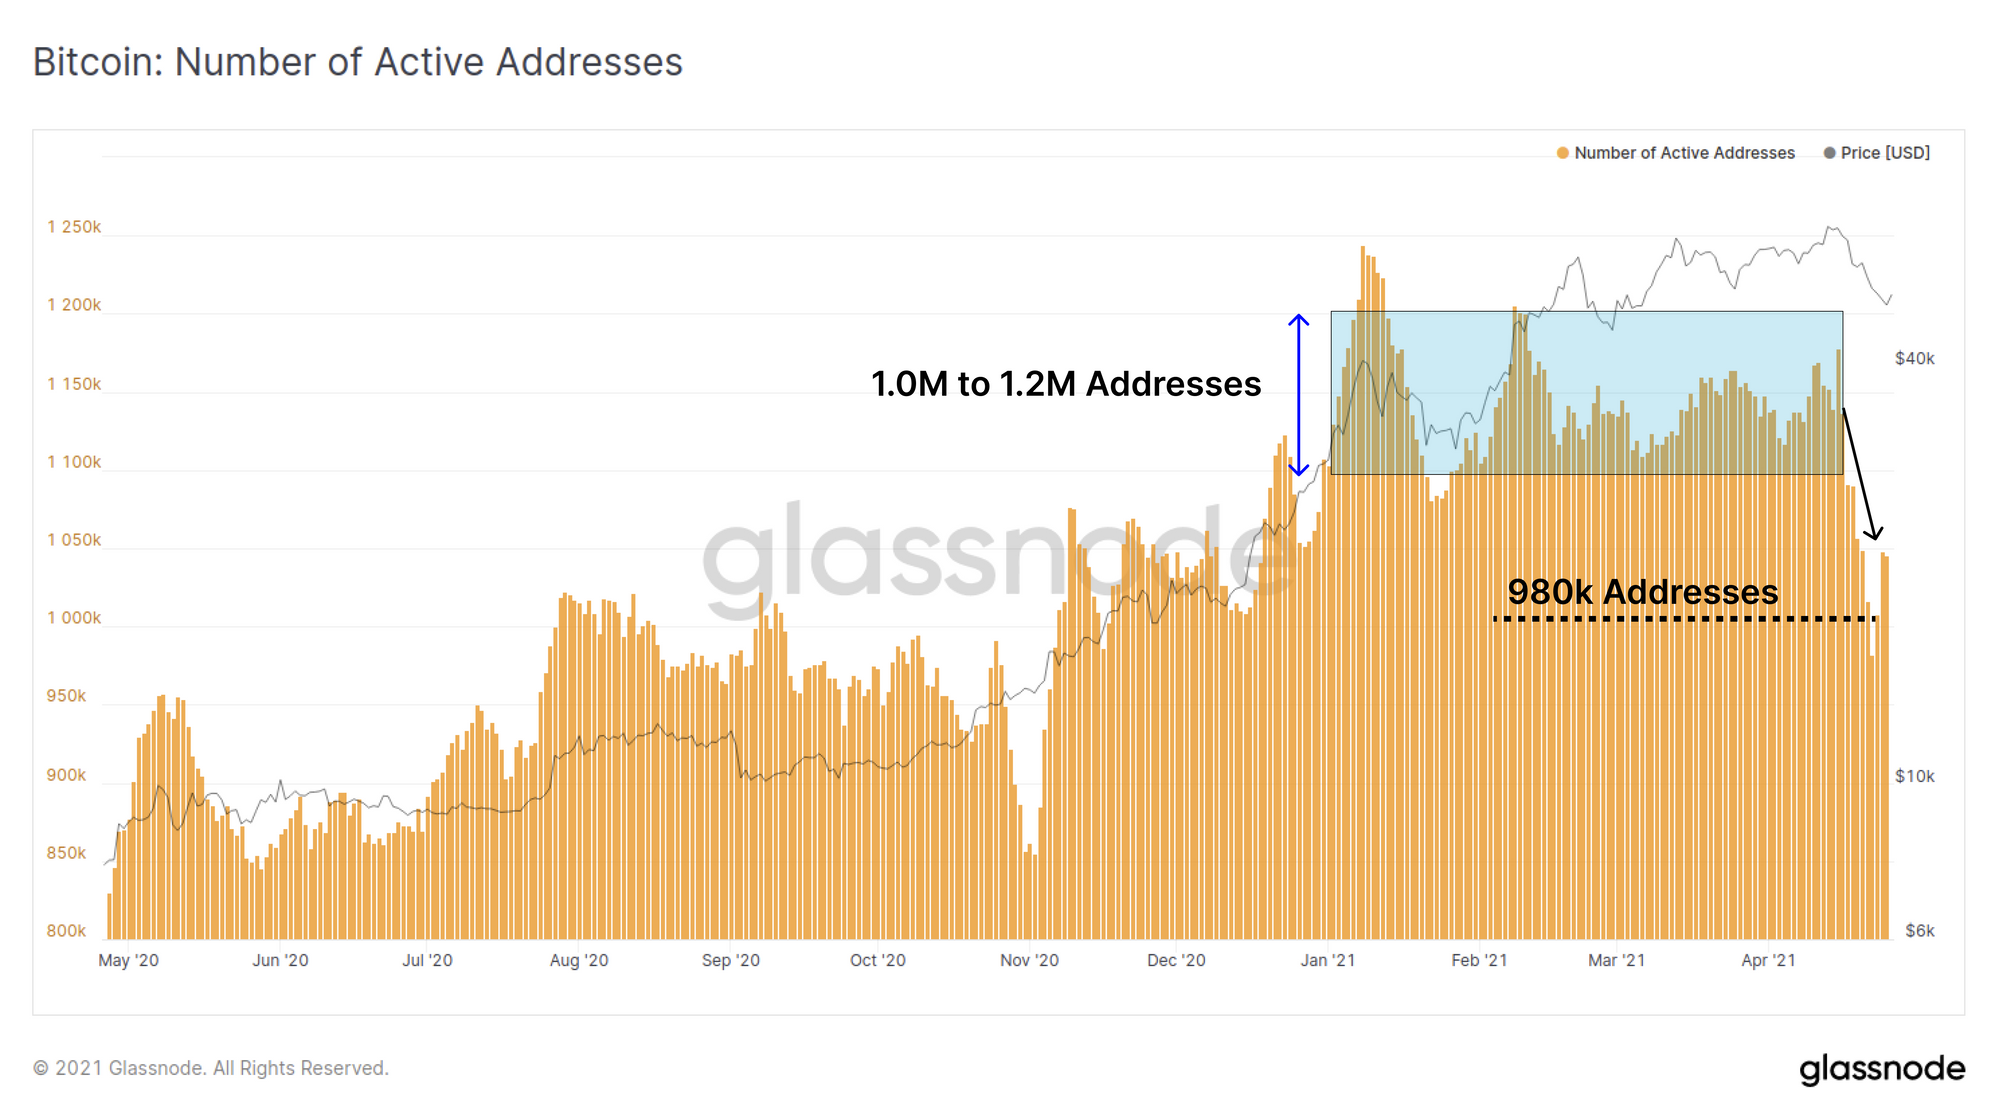
In likely response to high on-chain fees, the number of daily active addresses declined by around 10% this week, from the typical range of 1.0M to 1.2M seen throughout this bull market to approximately 980k addresses.
New Holders are Shaken Out
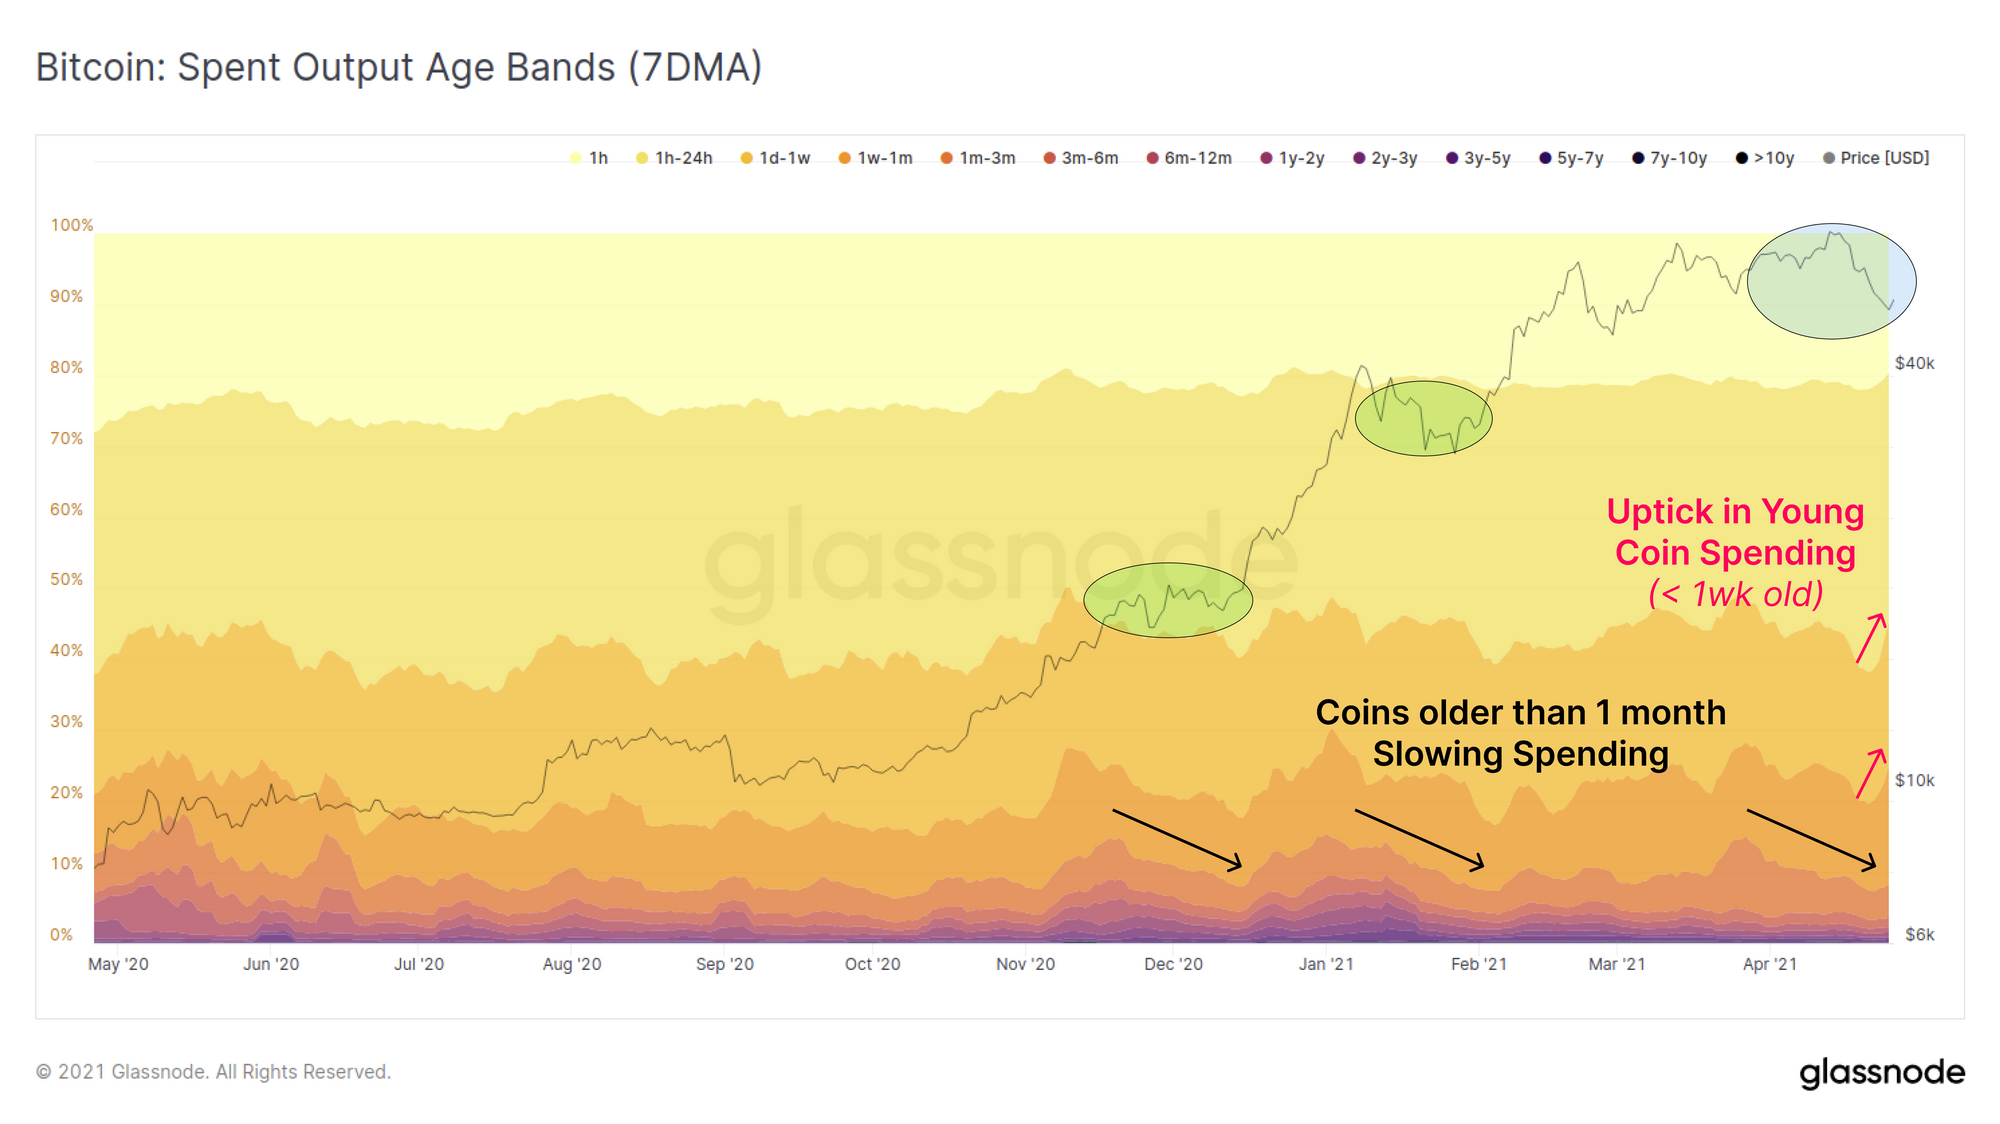
Investigating the Spent Output Age bands, we can establish a view on the typical age brackets for coins spent this week. It can be seen that coins older than 1-month represent a very small and declining proportion of the total transaction flow. Conversely, the number of young coins (< 1-week old) being spent have seen an uptick towards the end of the week suggesting newer market entrants were shaken out during this correction.
Notably, coins older than 6-months (purple colours) have not seen a meaningful increase in spending since the correction back in February. Previous instances of similar spending behaviour was observed during the December 2020 consolidation, just before breaking to new ATHs, and during the first bull market correction in January.
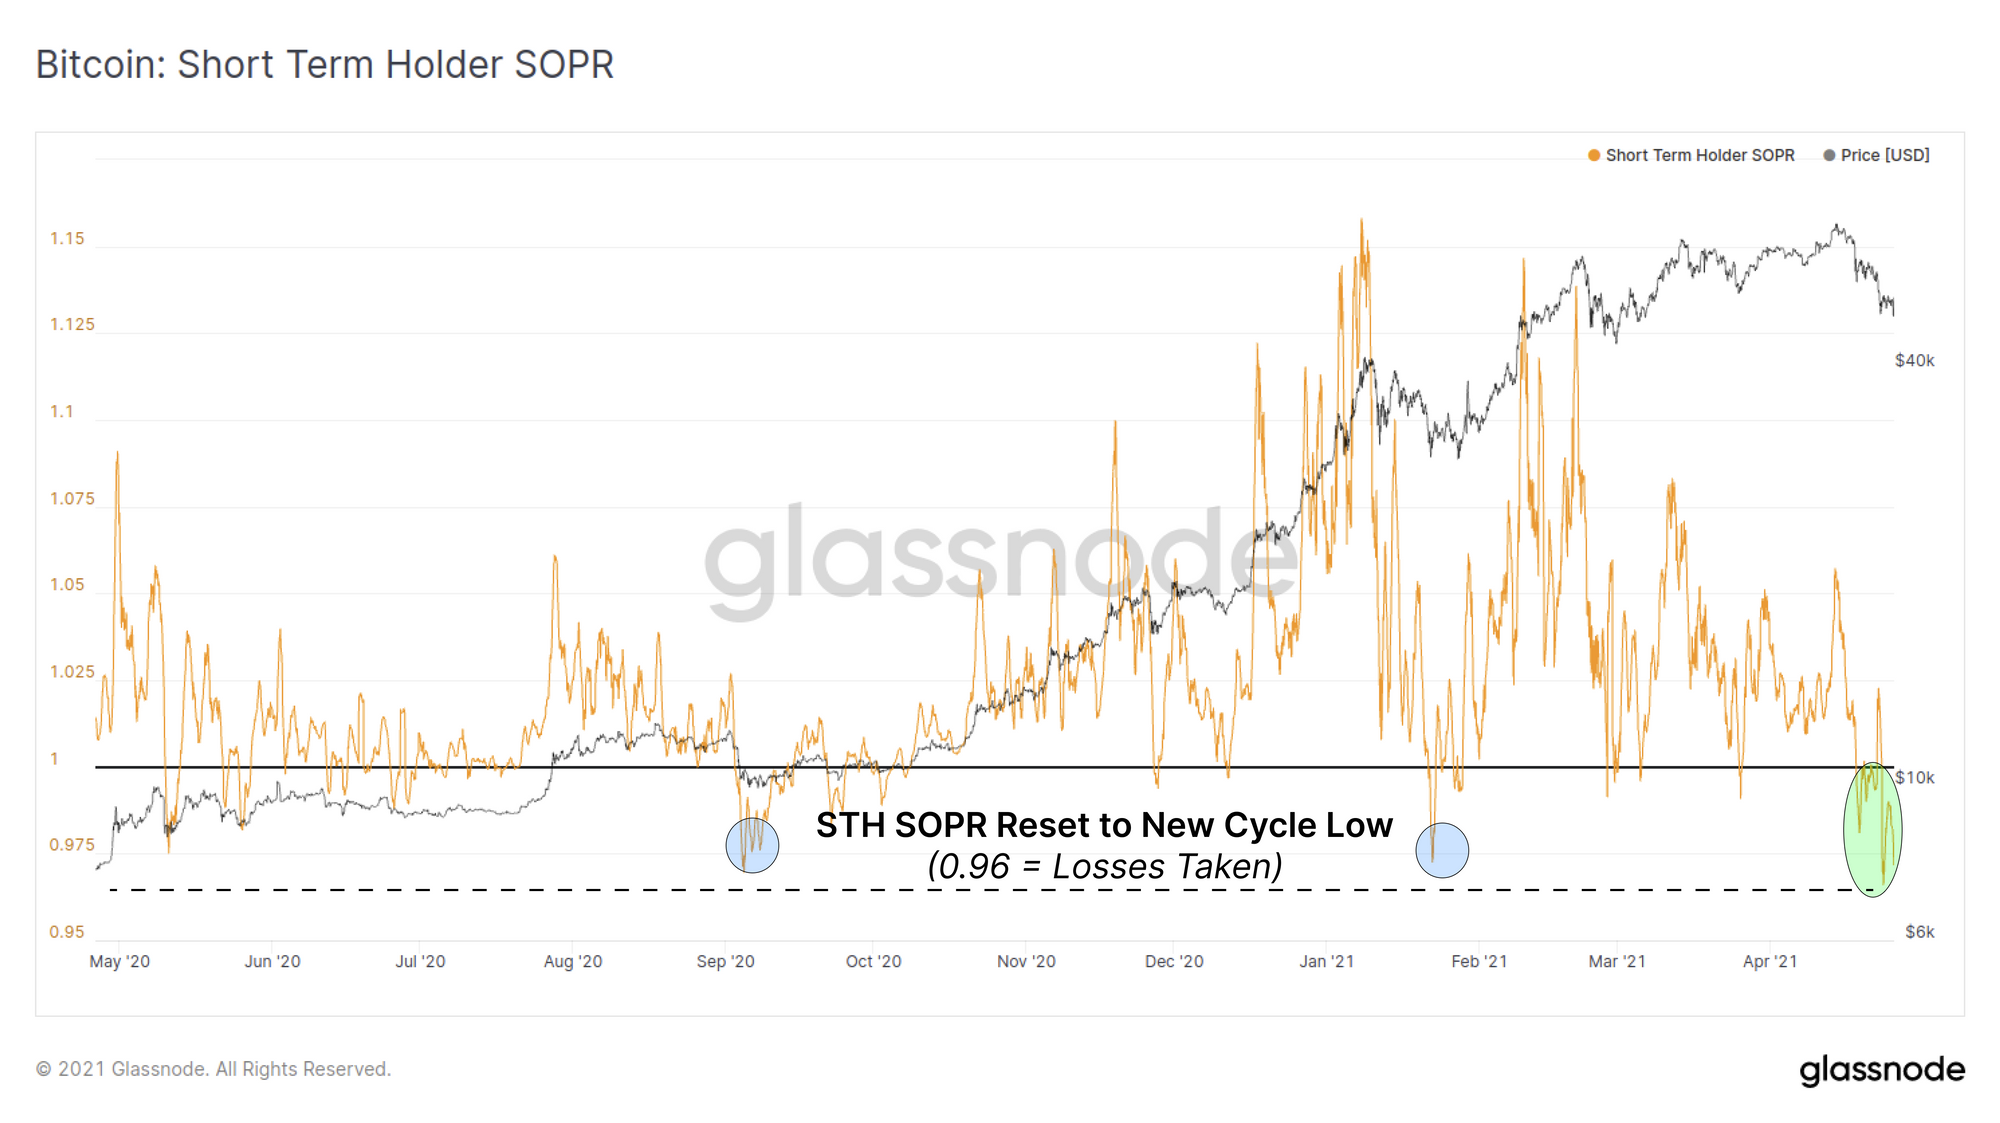
The Short Term Holder SOPR metric has also fallen to the lowest value seen during this bull market. This indicates that coins spent this week were at an aggregate loss relative to prices when they last moved. This metric provides further evidence that short term holders who purchased coins at higher prices have been shaken out during this correction. Deep and lengthy retraces of the SOPR metric has historically been constructive for price in a bull market, as panic sellers are exhausted and coins are transferred to stronger hands.
Old Hands Hold Strong
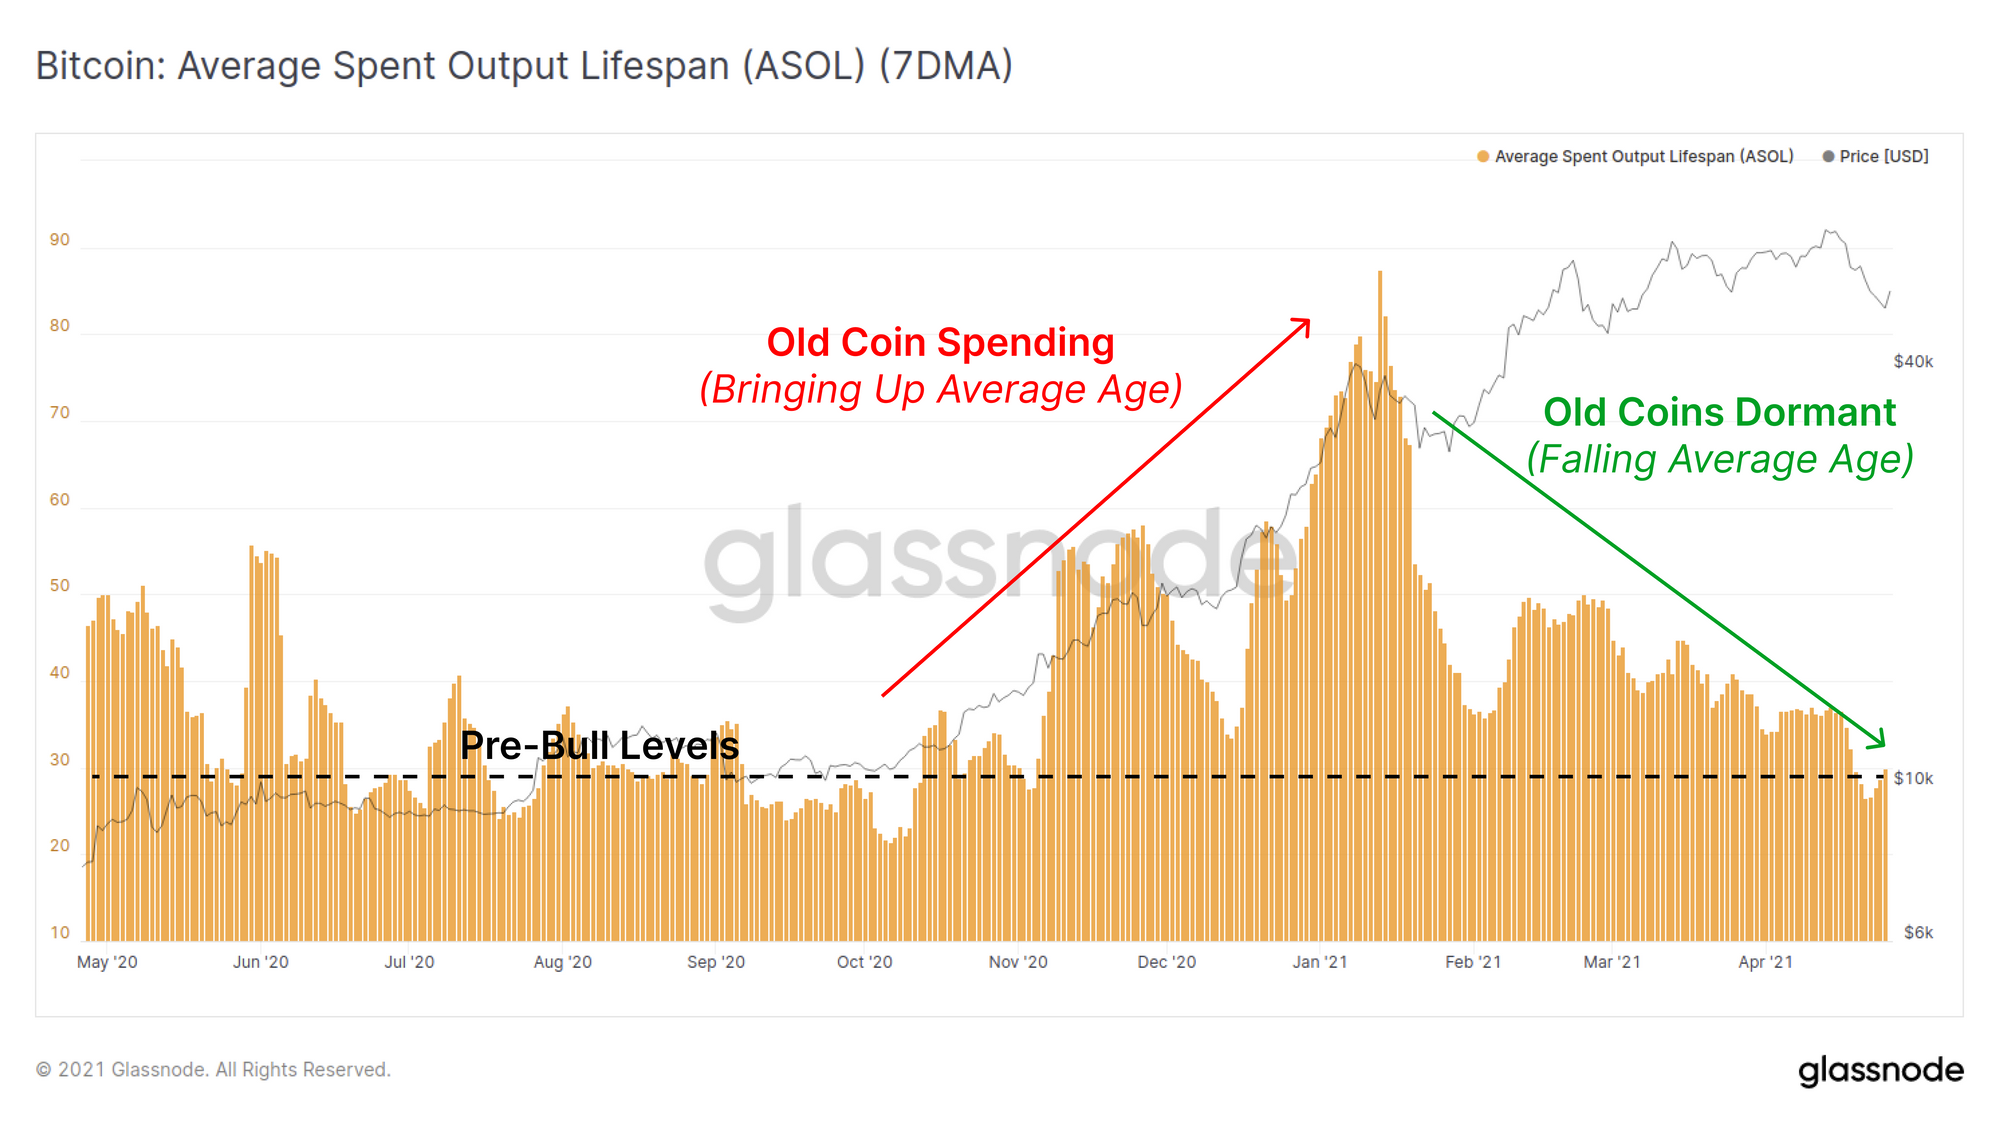
The Average Spent Output Lifespan (ASOL) metric provides a view on the aggregate age of coins spent each day. This week, the average coin age has fallen back to between 25 and 30-days. These are levels that have not been seen since the early-bull market in 2020. This downtrend in ASOL has persisted since mid-January suggesting that old hands remain confident despite volatility and higher prices creating incentive to take profits.
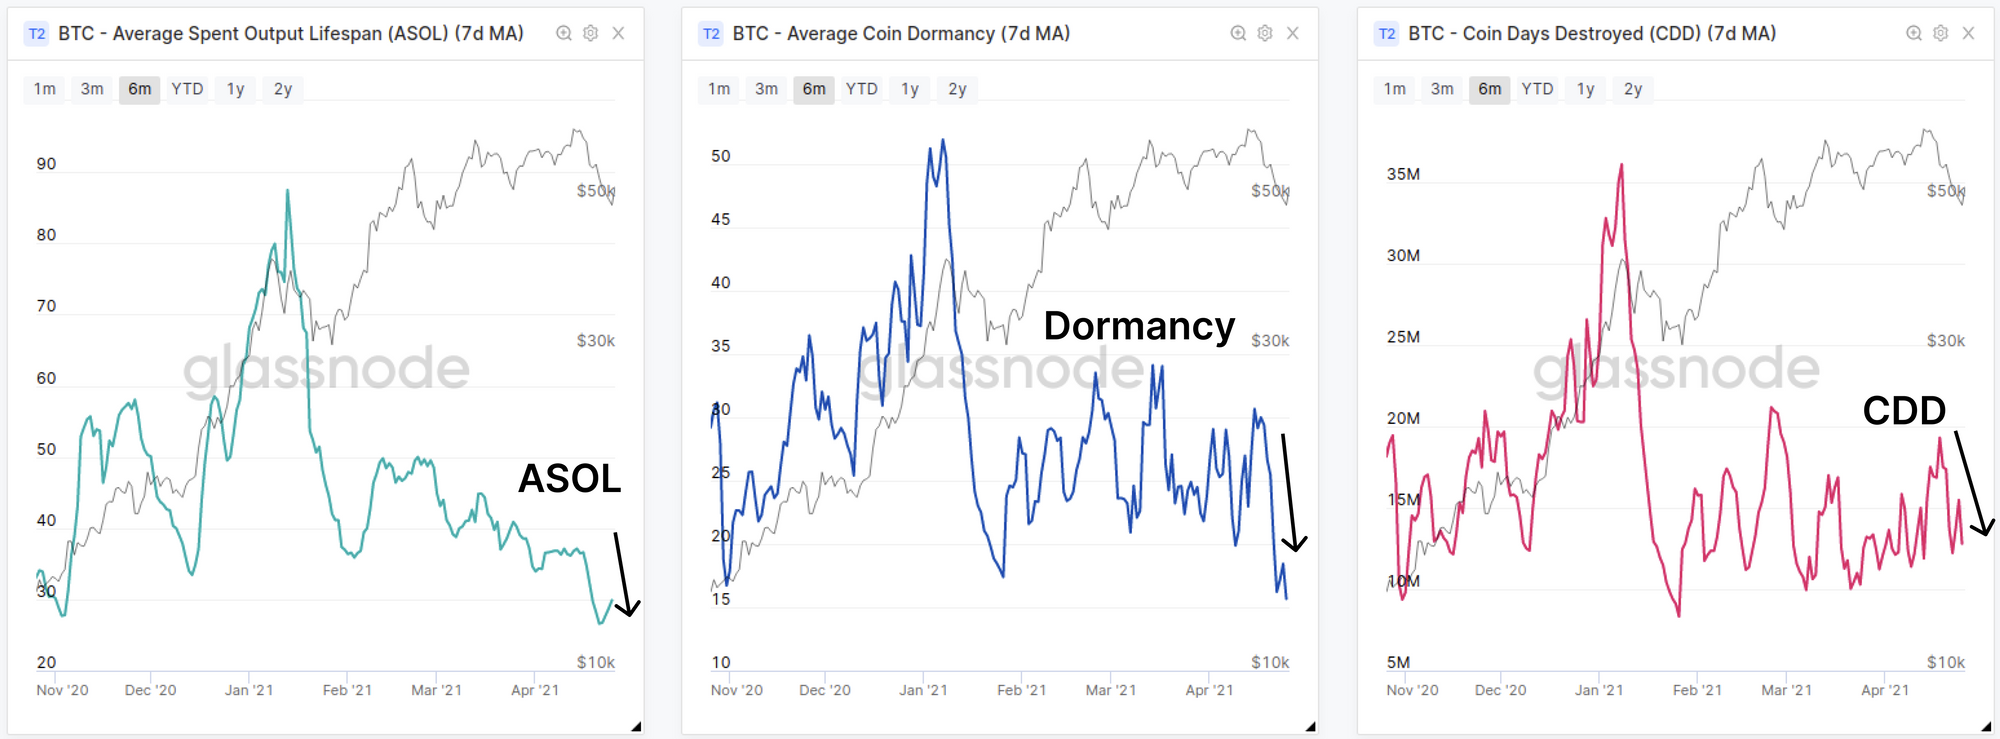
In fact, if we analyse a number of lifespan metrics, we can see a consistent trend of old coins remaining largely dormant leading to downtrends across all metrics. The charts below present three different lifespan metrics telling this cohesive story:
- ASOL represents the average age of all spent UTXOs (i.e. average age per transaction)
- Dormancy represents the average age per unit of BTC moved (i.e. average age per 1 BTC)
- CDD represents the total volume of coin-days destroyed (i.e. global total of lifespan spent that day)
As all three metrics are breaking down this week, it means the aggregate age of coins spent are younger than prior weeks. This reinforces the case that old hands are not spending their coins and this correction has largely affected newer market entrants.
Be sure to check out these metrics in the Week On-chain Newsletter dashboard.
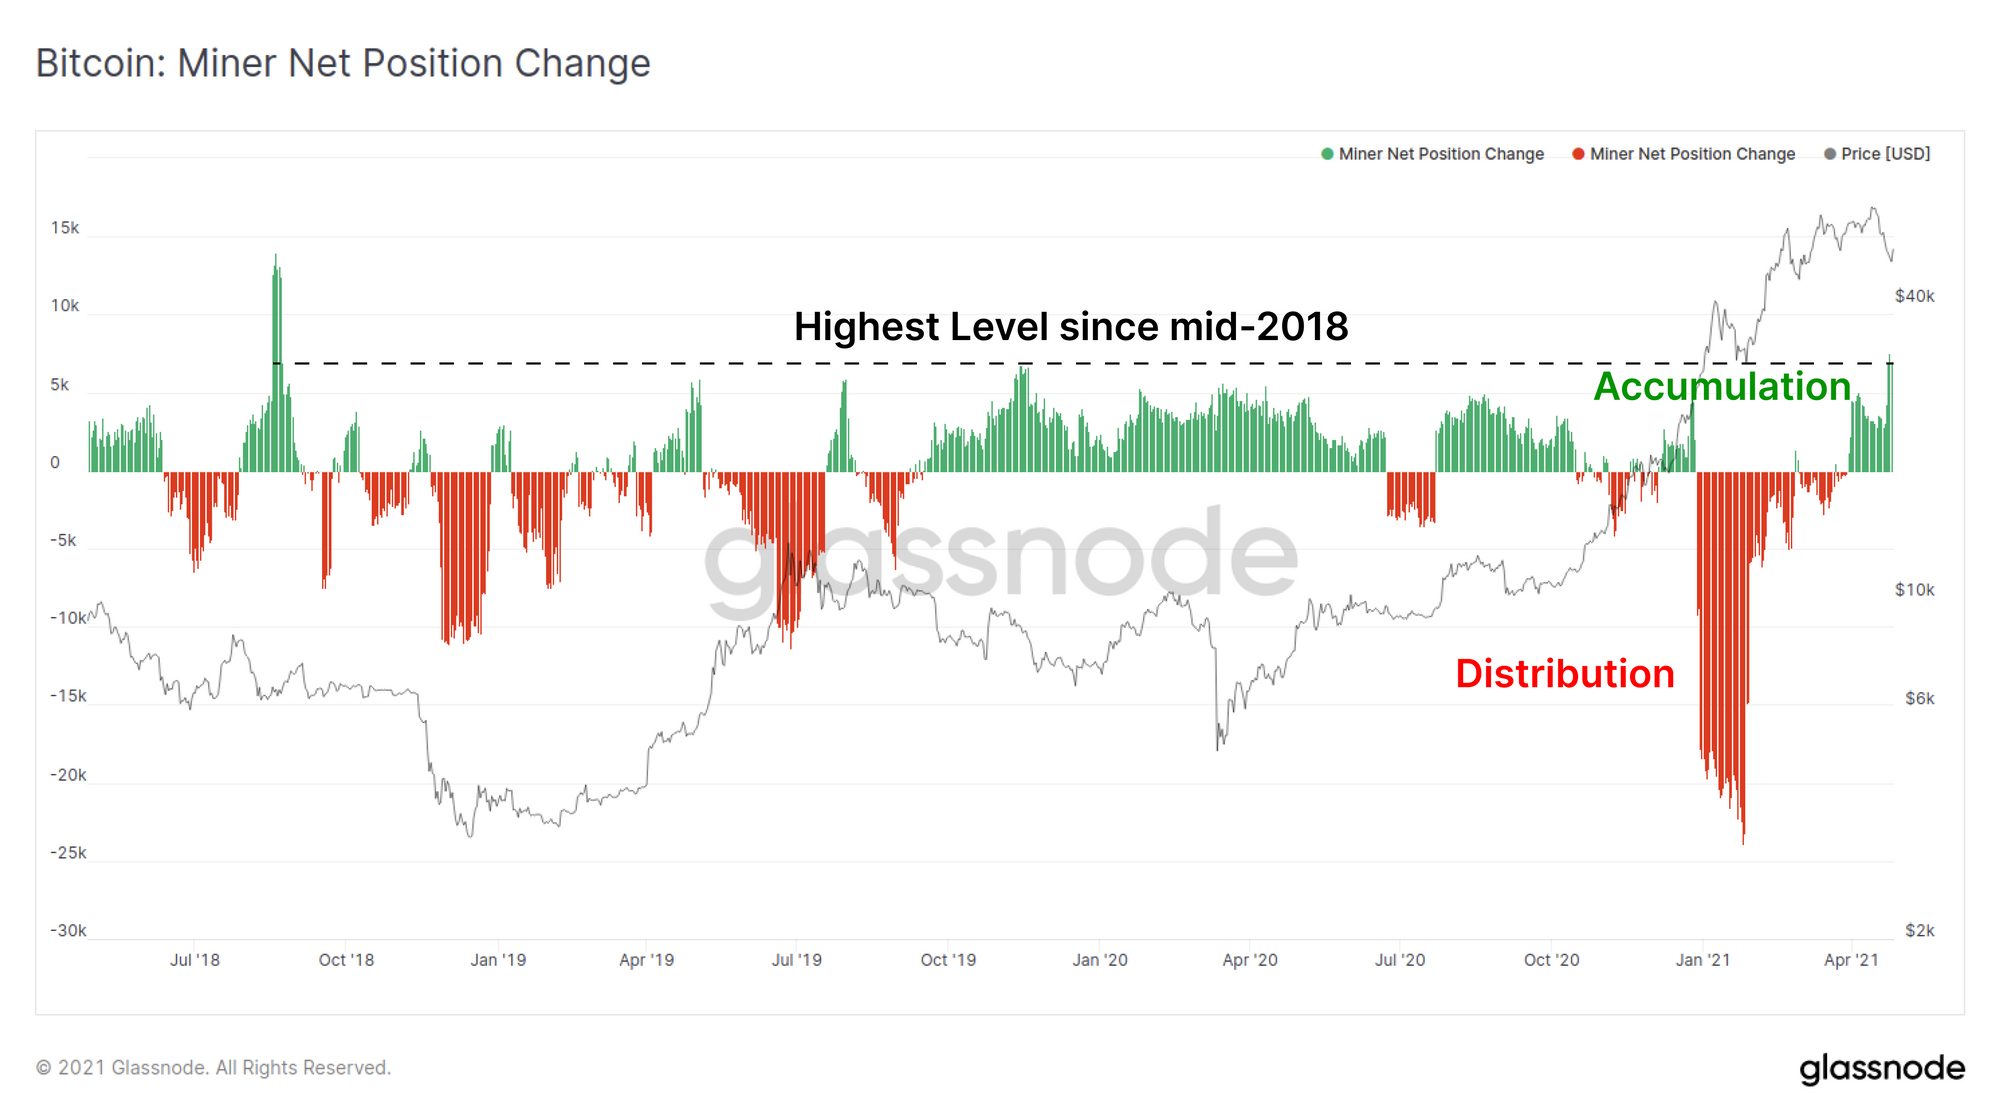
Miners Resume Accumulation
Miners have returned to accumulation mode with their net position change reaching highs not seen since mid-2018. This is even more impressive given coin issuance was higher prior to the halving event in 2020. This may also reflect market maturity and the increase in opportunities for miners to finance their operations without selling coins via collateralised loans and other debt instruments.
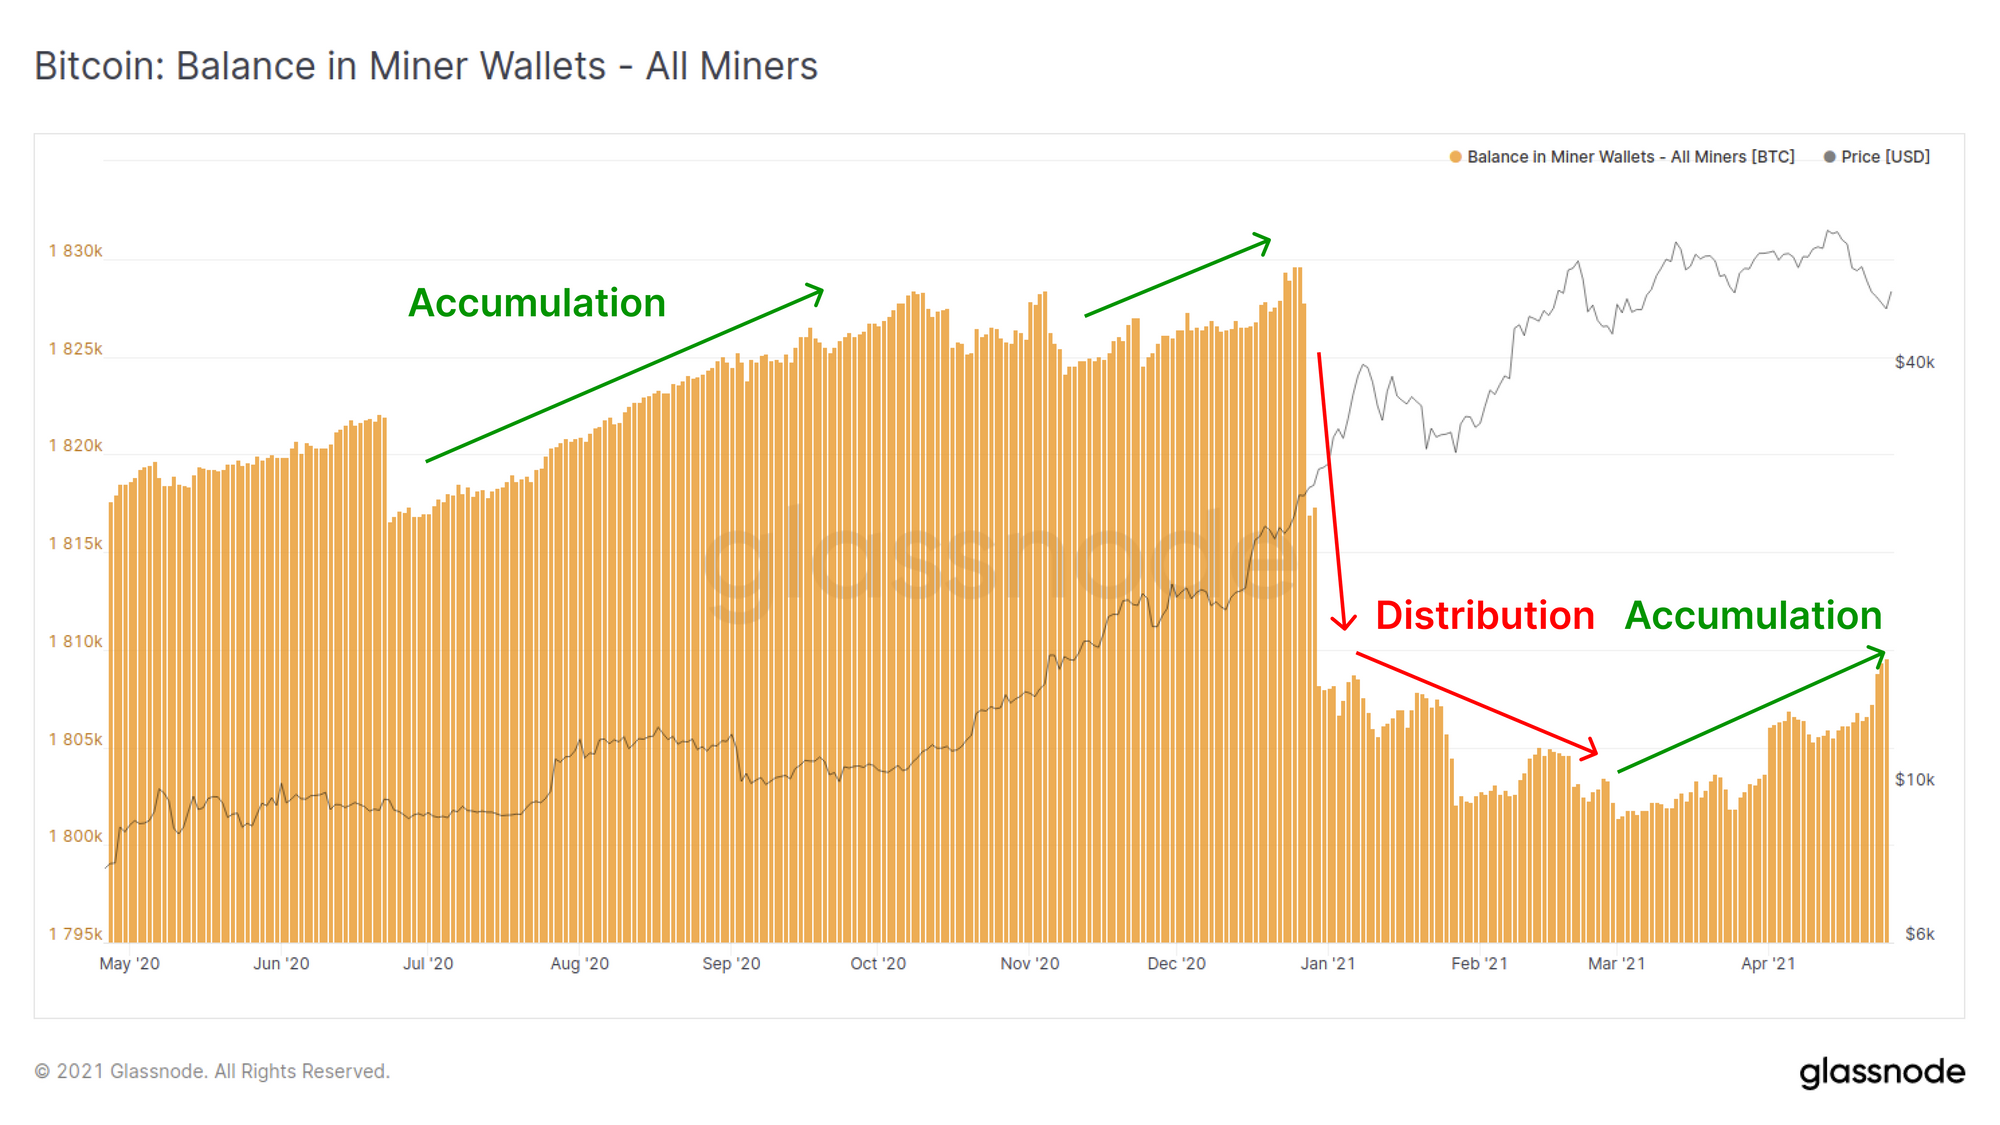
The total unspent miner supply also demonstrates how miners have returned to accumulation throughout March and April. Unspent supply is now over 1.8M BTC (note, this total includes Satoshi's unspent coins).
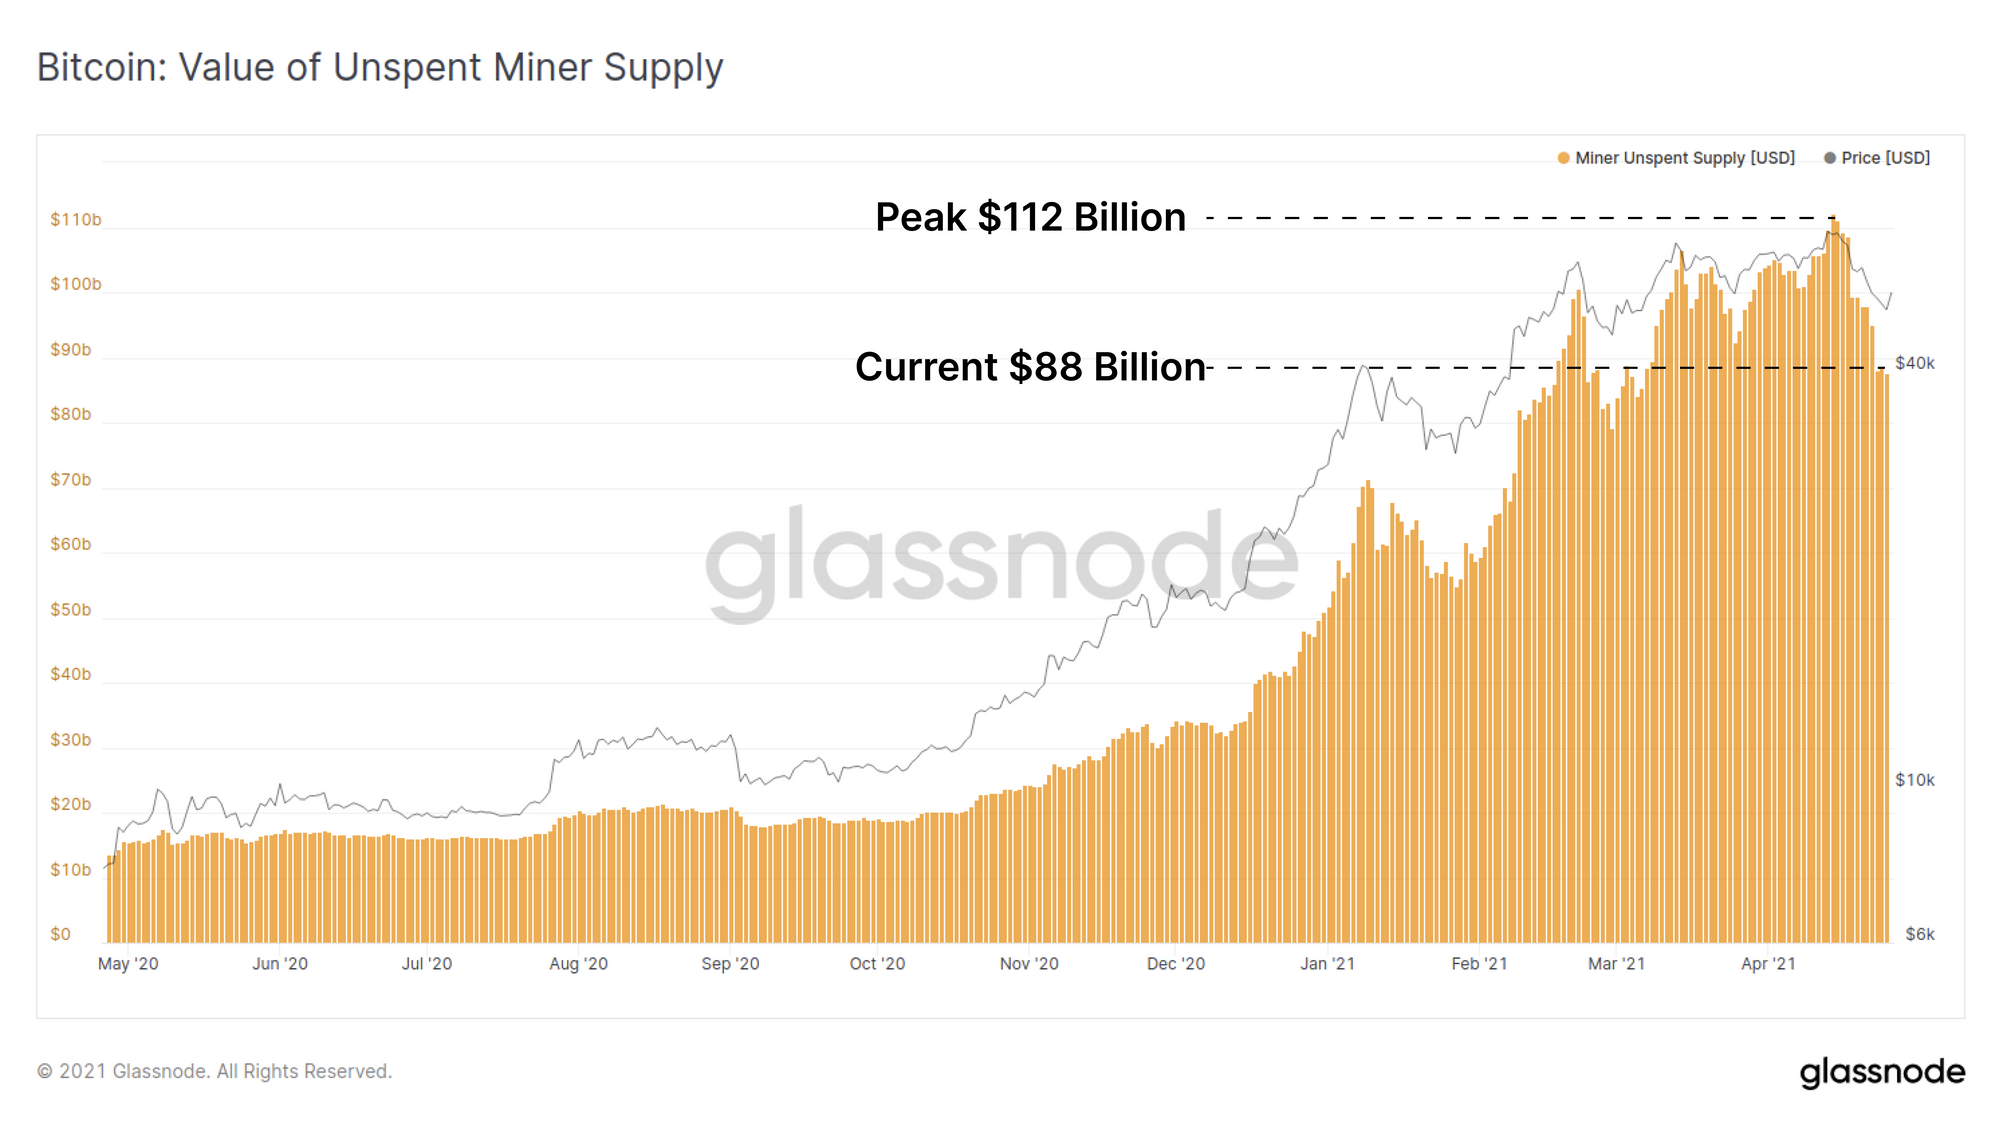
In USD terms, unspent miner supply is currently valued at $88 Billion after hitting an all time high of $112 Billion prior to this price correction.
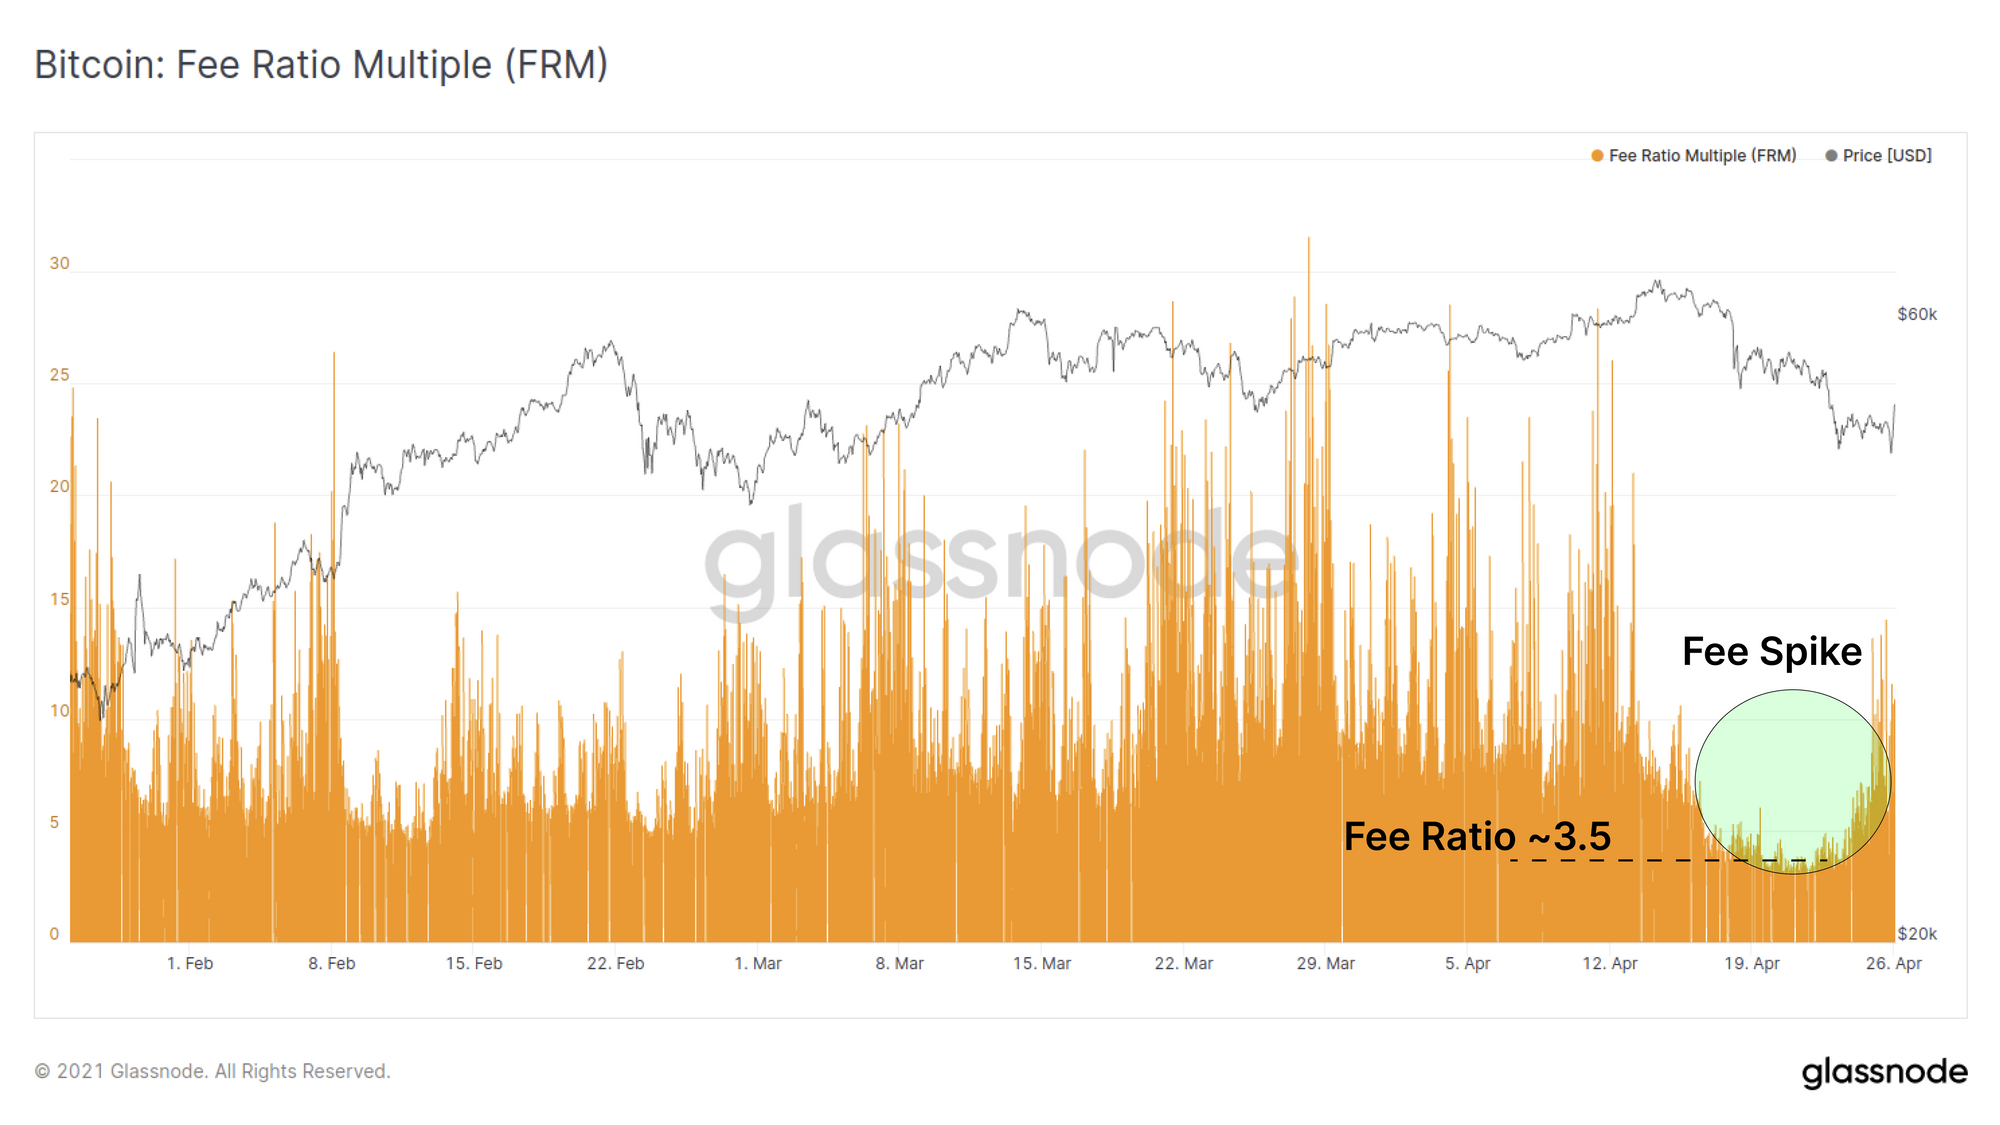
Finally, as a result of high Bitcoin transaction fees over the past weeks, the Fee Ratio Multiple dropped to around 3.5 as fees made up an increasingly large share of the total block reward. A declining Fee Ratio Multiple is a positive signal for network security as it suggests that fees are gradually taking over a bigger role in the security budget. The Bitcoin Fee Ratio Multiple has persisted at values around 7 to 8 throughout this bull market indicating fees account for around 12% to 15% of the total block reward.
Week On-chain Dashboard
The Week On-chain Newsletter now has a live dashboard for all featured charts here.
Weekly Feature: Uniswap and Gas Fees
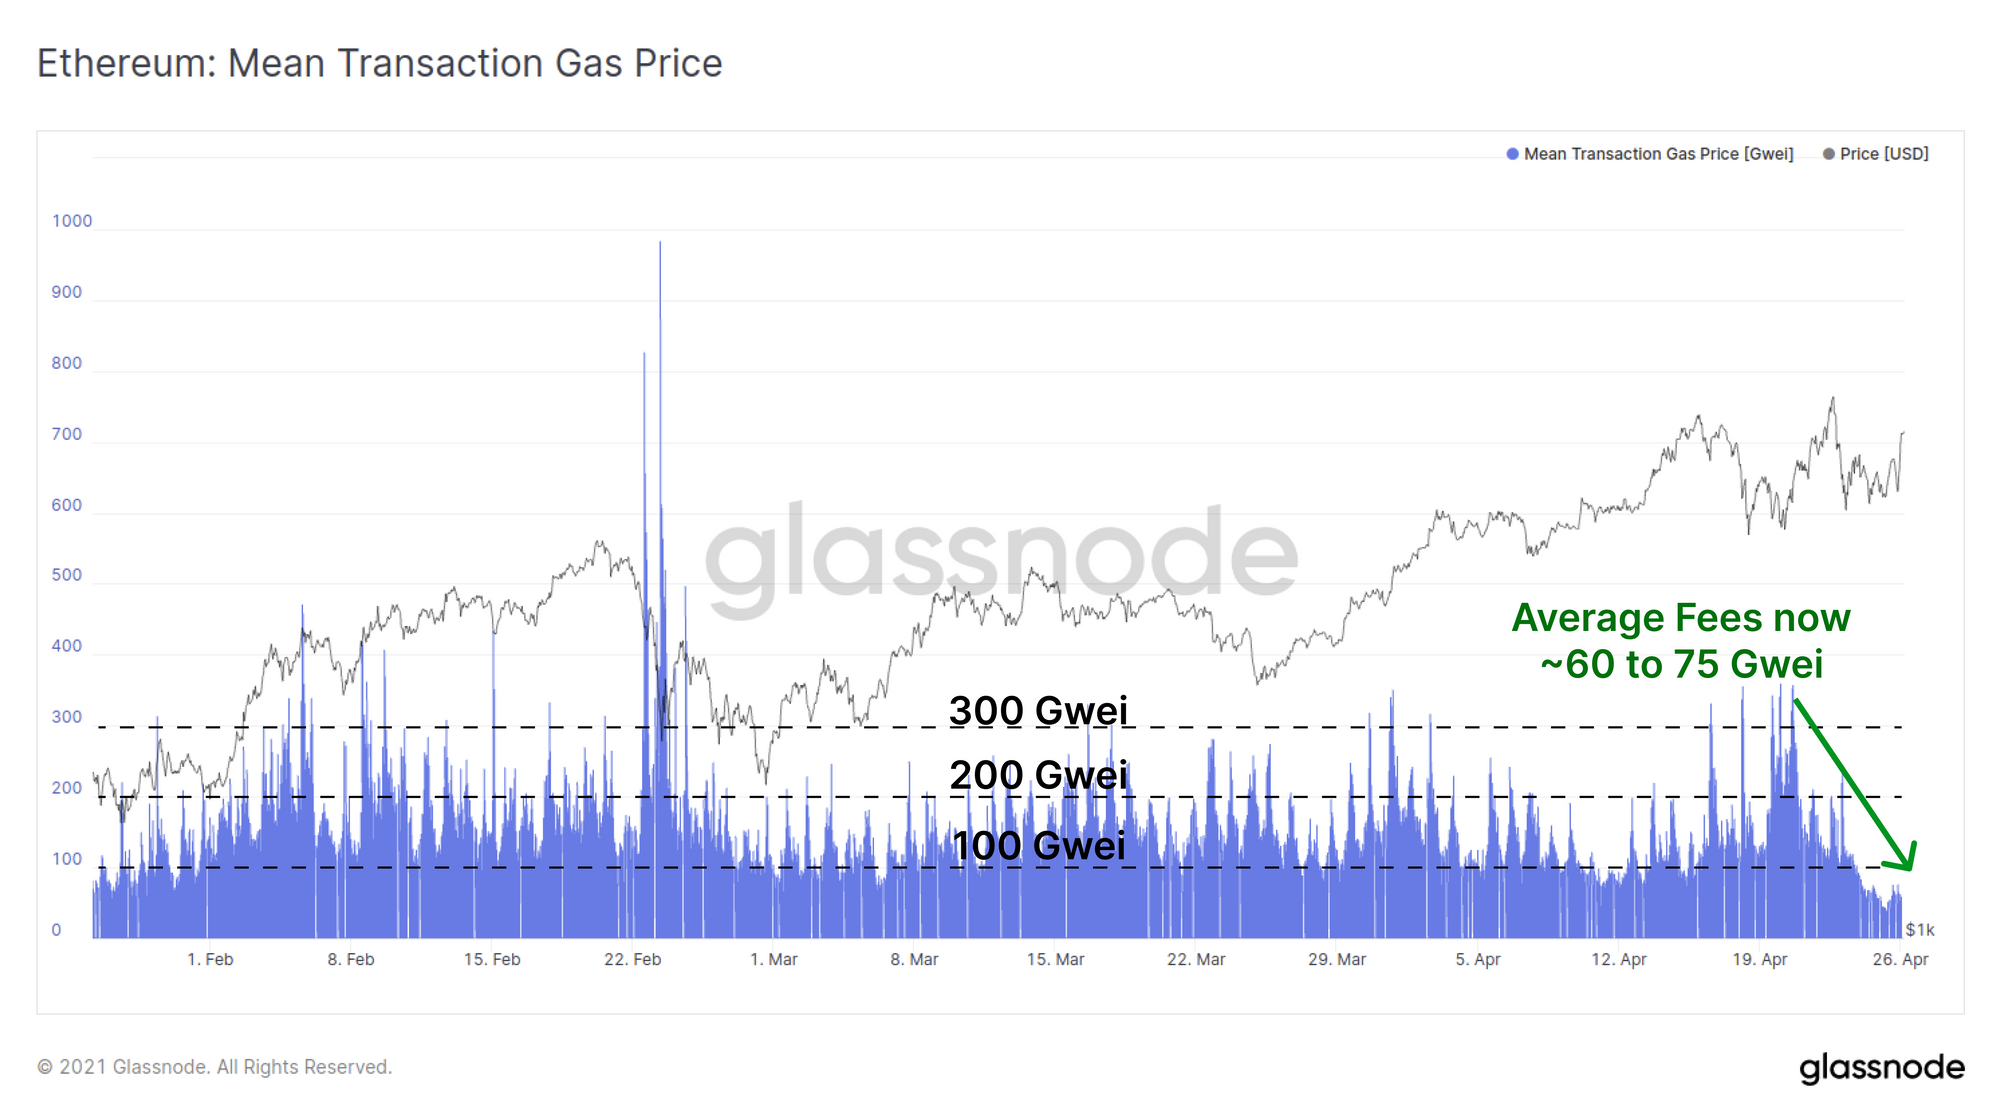
Transaction fees on Ethereum have come down substantially this week after a sustained period of average gas fees well above 100 Gwei. The average gas fees are currently around 60 to 75 Gwei representing a welcome reduction of transaction costs for Ethereum users. The primary driver for reduced fees is the increased the gas limit from 12.5M to 15.0M by miners, effectively allowing more transactions per block.
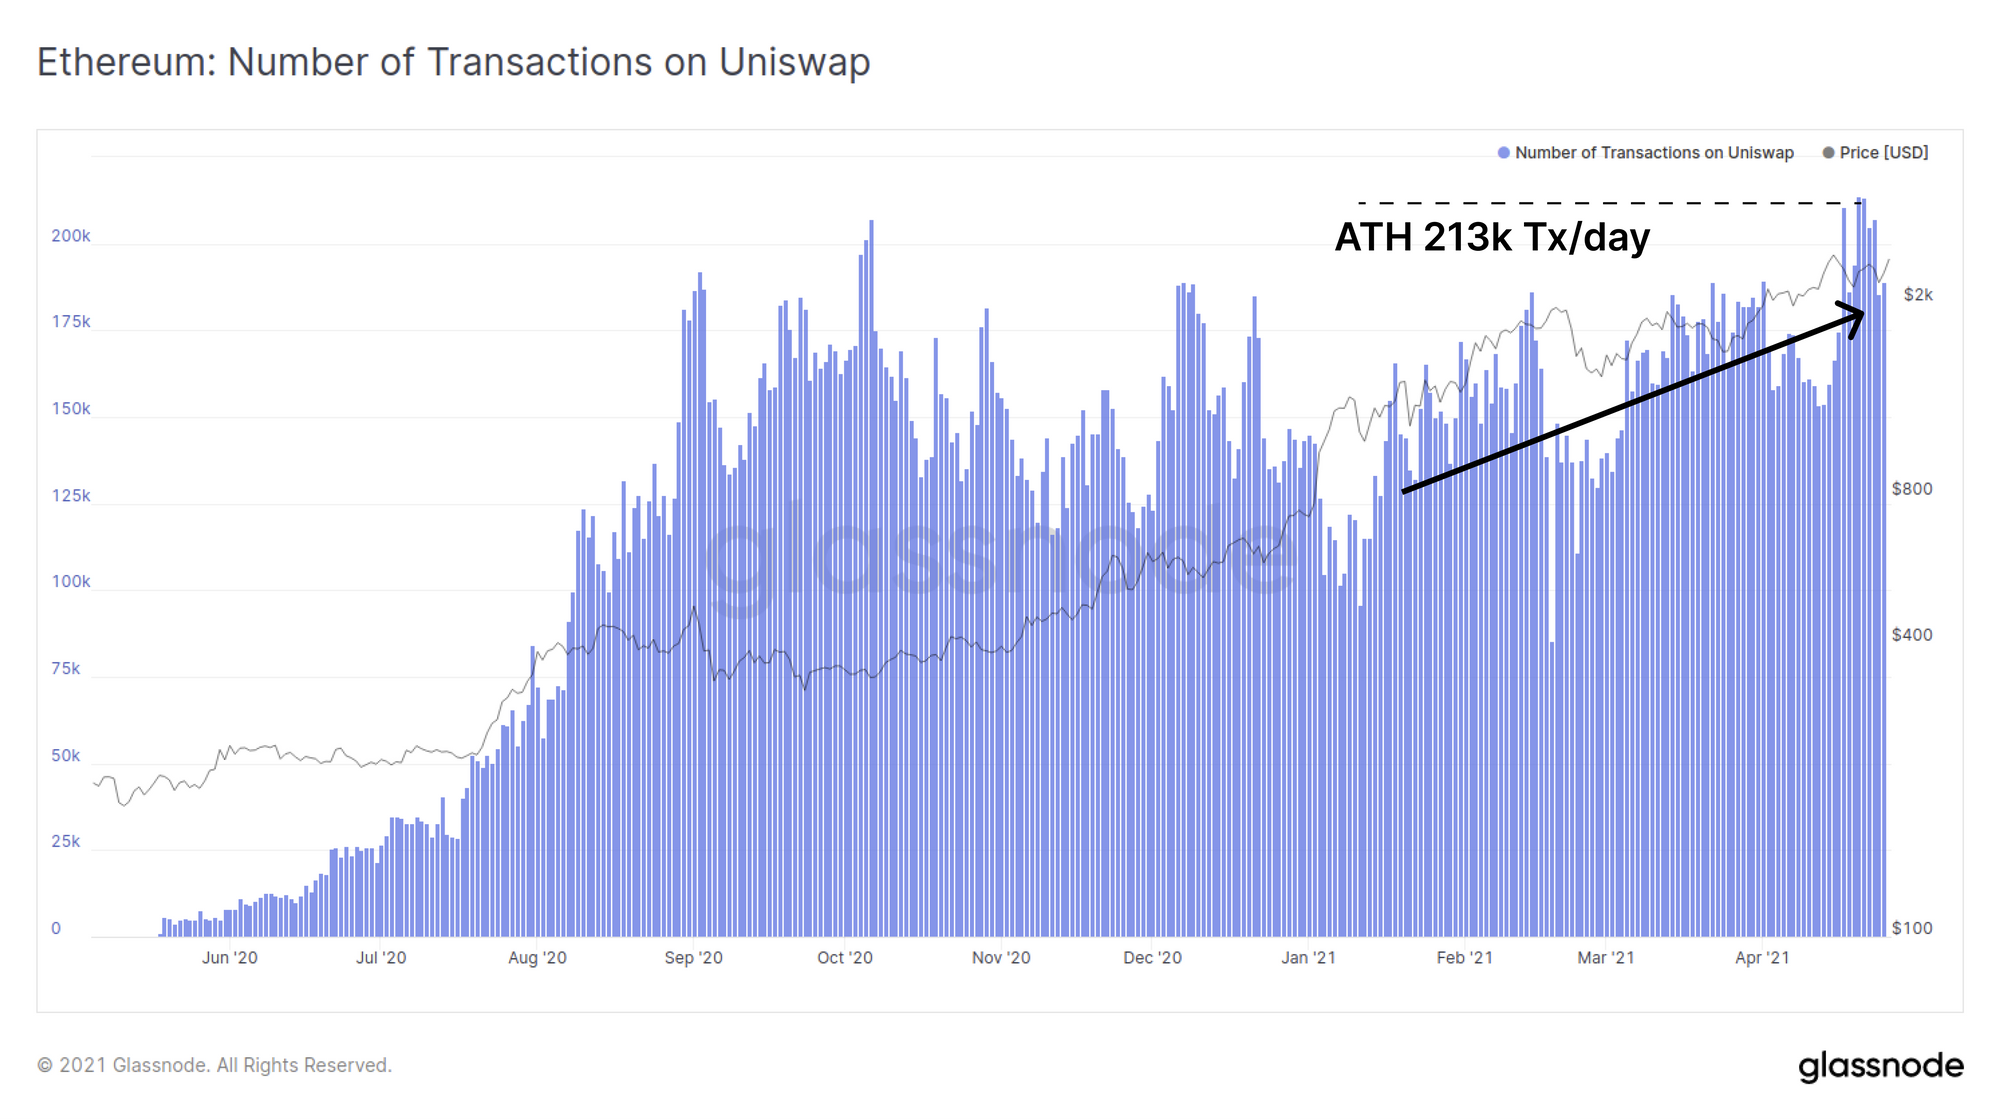
Traders on Uniswap have clearly welcomed these reduced gas fees as transaction counts spiked to a new all-time-high of 213k trades per day this week. This continues a steady uptrend that has been in play for much of 2021.
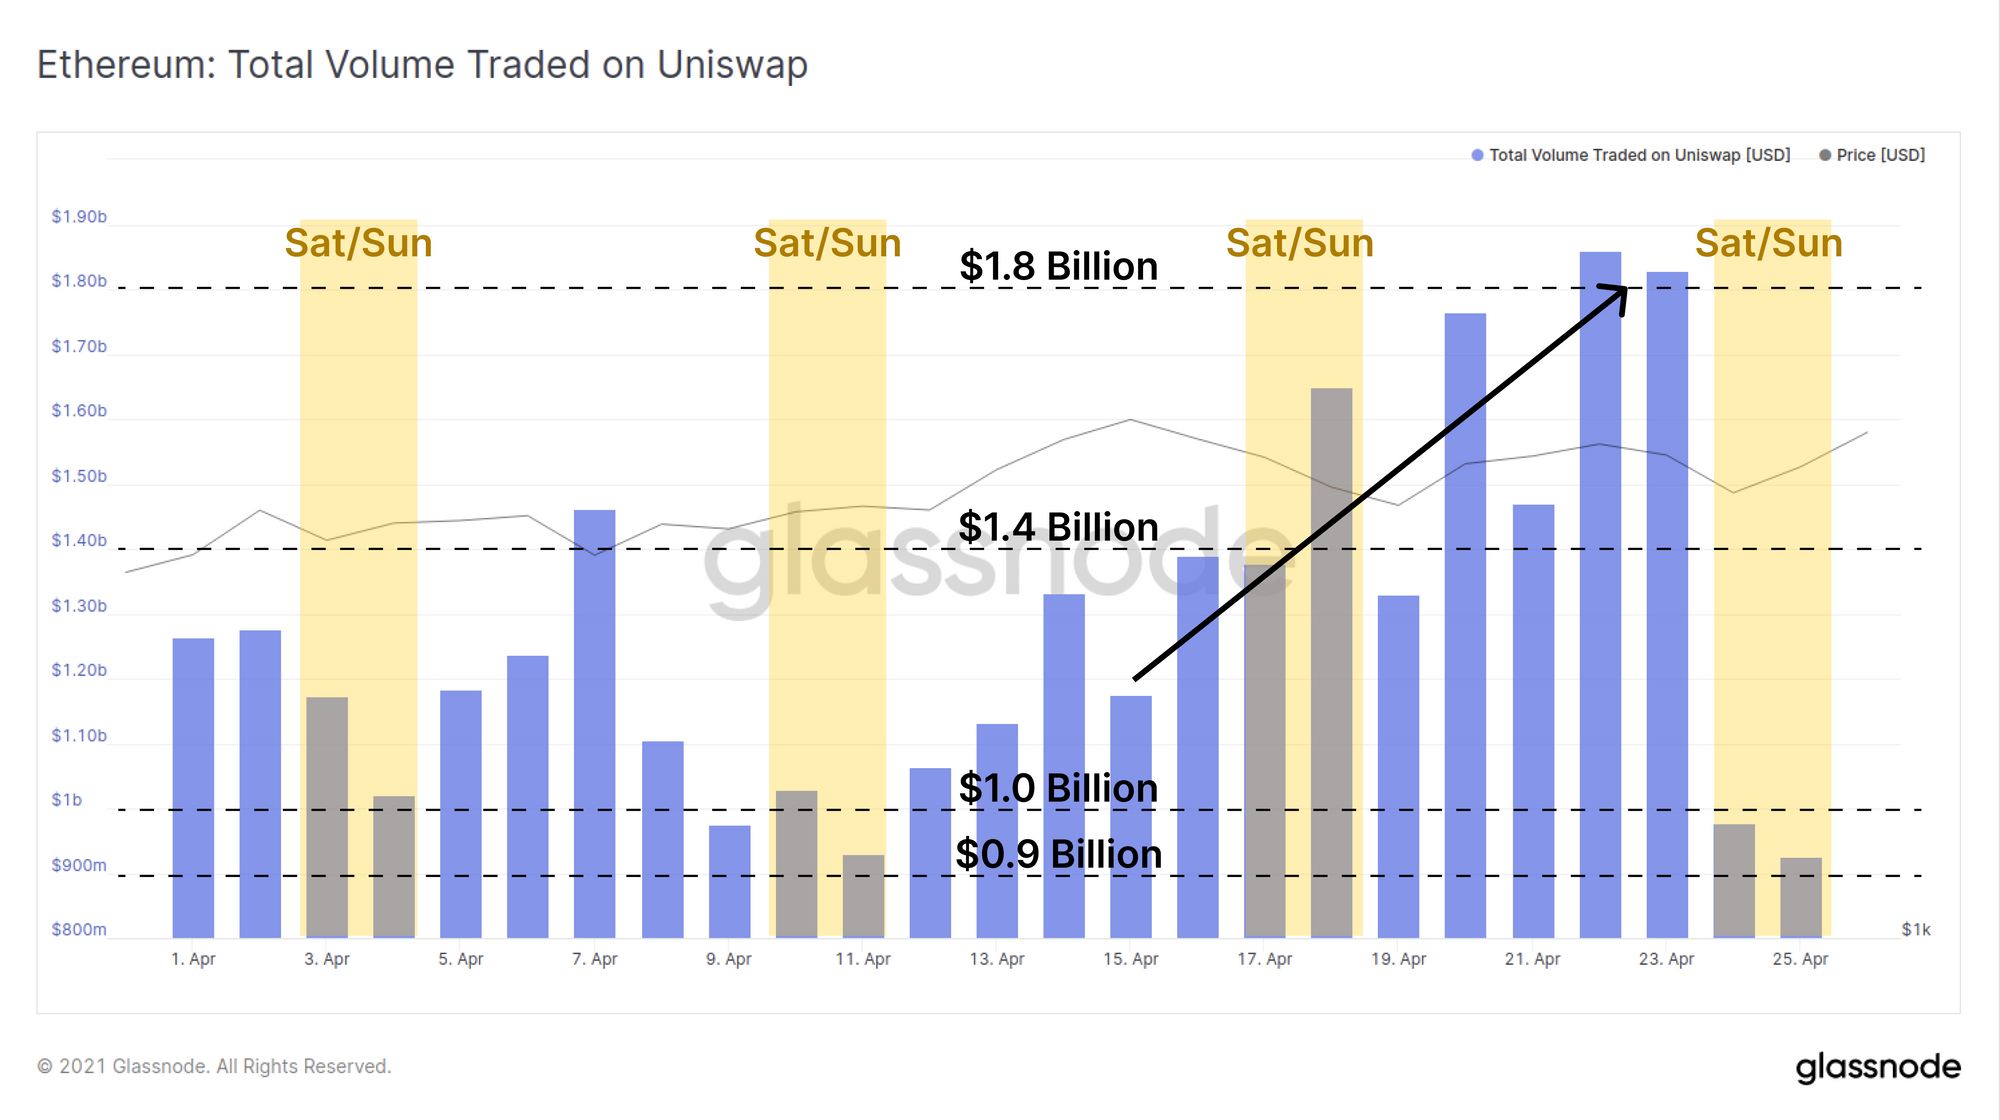
Uniswap trading volume has also continued trending higher this week, peaking above $1.8 Billion late last week. The reduced gas fees alongside correcting prices are clearly providing fresh opportunities for Uniswap traders.
New Glassnode Content
Bitcoin On-Chain Exchange Metrics: The Good, The Bad, The Ugly
Last week we released a deep dive into our framework for tracking exchange balances and flows. This article explores the advantages, challenges and uncertainties associated with the tracking dynamic exchange wallets. This is a very nuanced and complex side to on-chain analytics and a sound appreciation of the good, the bad and the ugly is important.
Be sure to check out the article here.
Our Latest Newsletter: Uncharted
Check out our bi-weekly newsletter,