The Week On-chain (Week 27, 2021)
The Great Hash-power Migration is underway as an estimated 50% of Bitcoin miners are offline and on the move. We assess the magnitude of this event observed in the on-chain data.


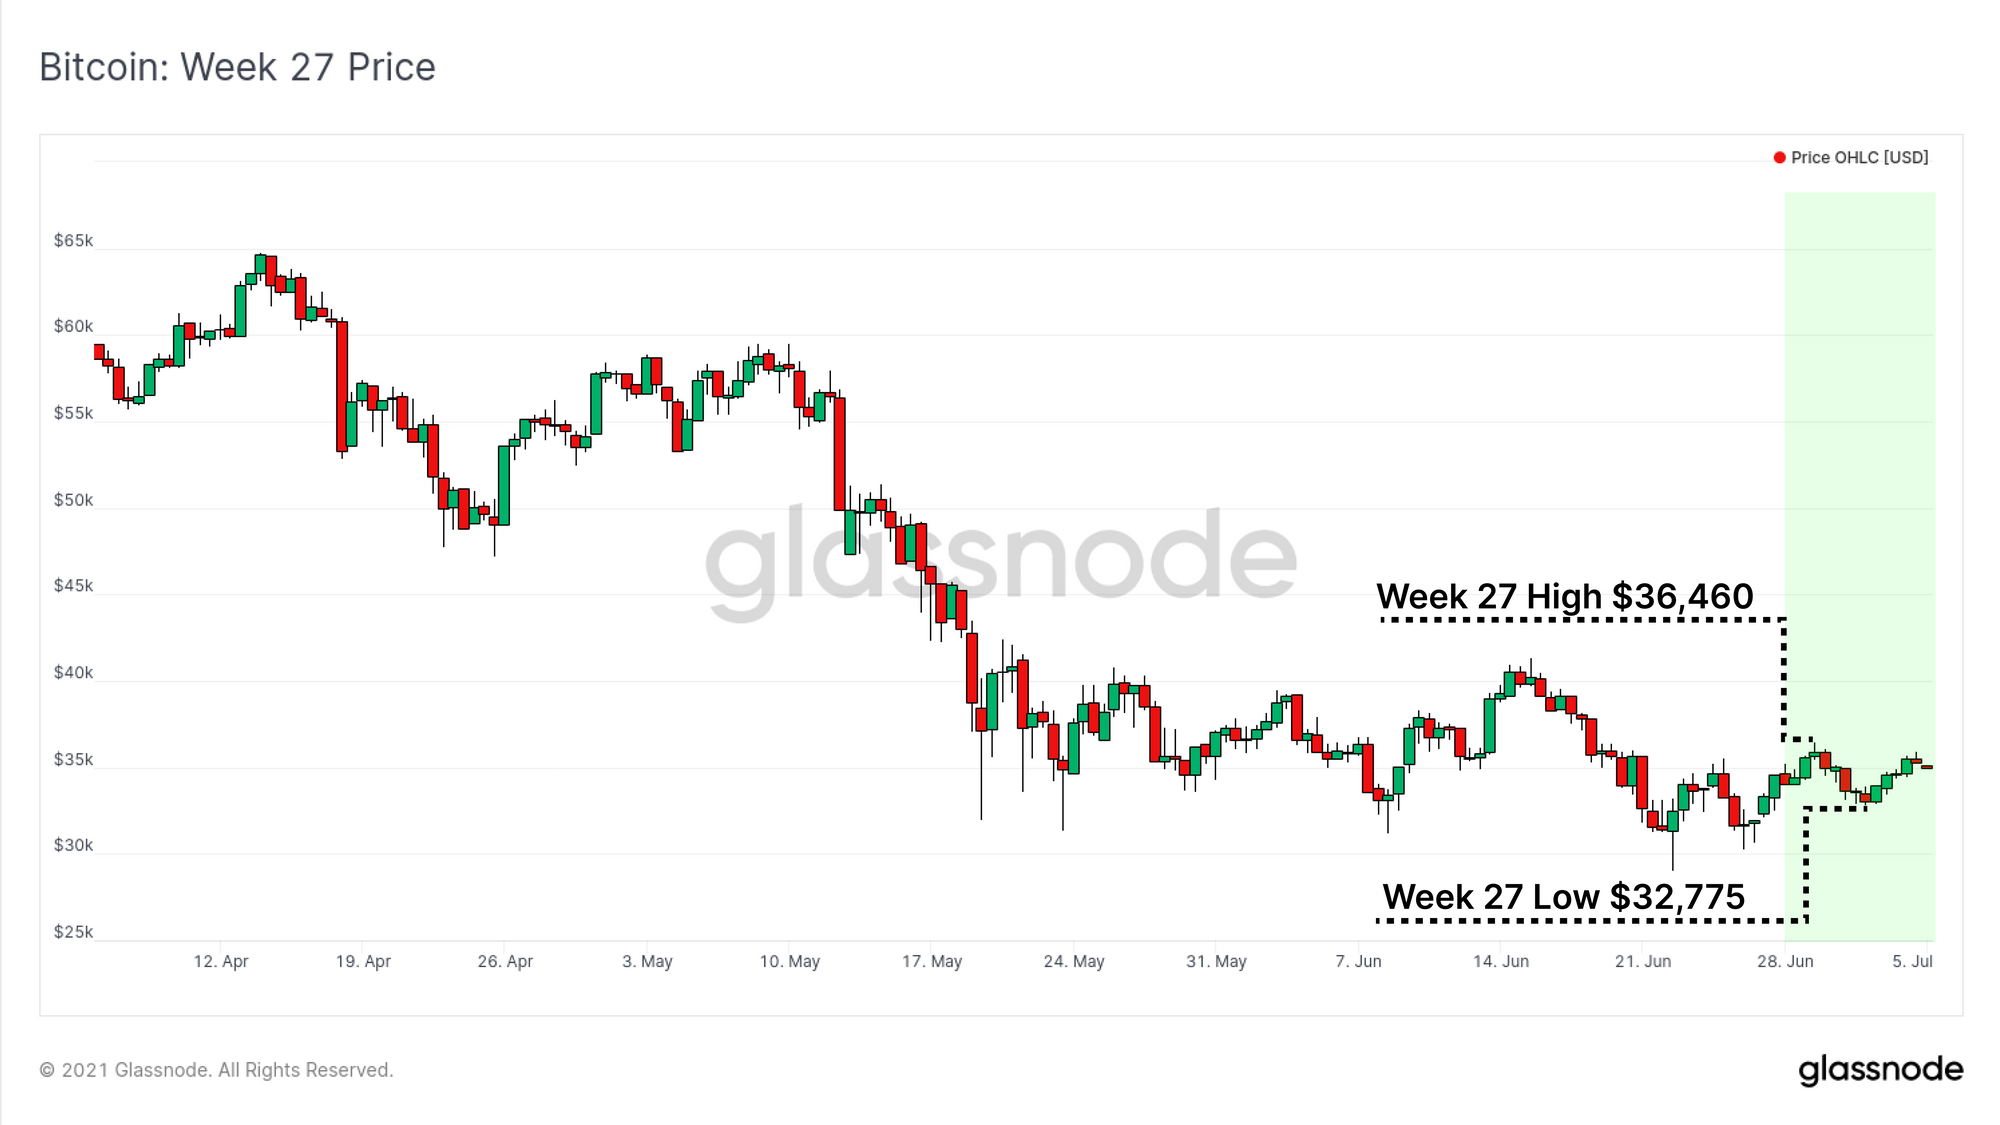
The Bitcoin market has traded slightly higher this week, albeit still within the trading range established since mid-May. Price traded between the weekly high of $36,460 and a low of 32,775, as volatility declines whilst price consolidates.
As volatility seeps out of the Bitcoin price, it has notably ramped up in the mining industry, as the Bitcoin network adjusts to an incredible decline in hash-power during the Great Migration. This week the protocol experienced the largest difficulty adjustment in history, adjusting down 27.94%.
The resilience of the Bitcoin protocol is remarkable. This week, blocks continued to be mined, transactions continued to be settled, all whilst ~50% if its industrial base relocates, and reallocates capital to new jurisdictions. This week we will focus on a number of on-chain mining metrics that help characterise and gauge the magnitude of this incredible shift that is underway.
Sizing Up the Mining Shift
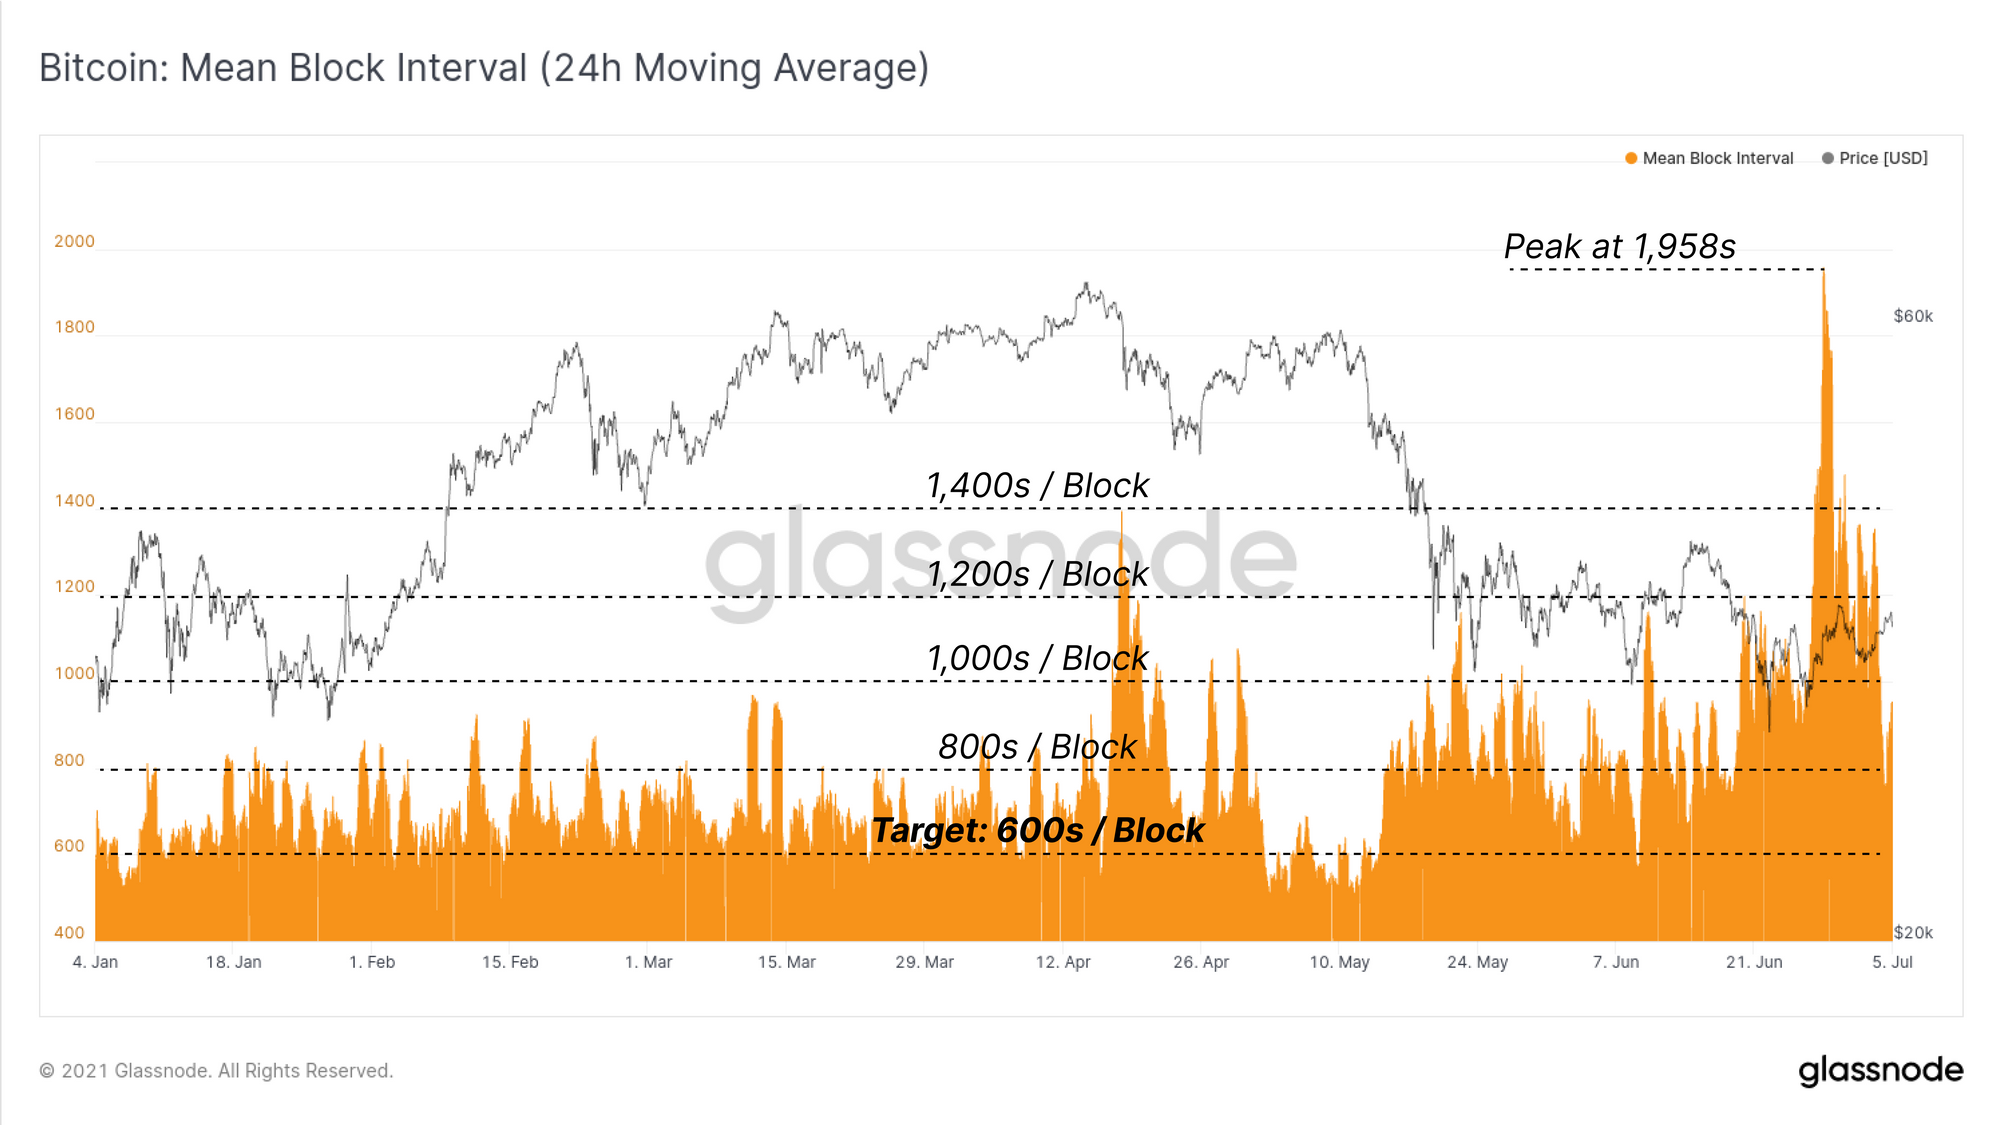
This week we saw plenty of volatility coming into in mining metrics, as the impact of the mining ban in China reaches full swing. When a significant proportion of hash-power comes offline, blocks will be mined at a slower pace until the difficulty adjusts downwards. This realigns the complexity of the mining puzzle to the average hash-power observed over the 2016 block difficulty window (~14-days).
This week, the average block interval on a 24-hr average basis spiked to a short term high of 1,958s (32.6mins), over 226% longer than the 600s target block-time. This event was only temporary on 28-June, with average block-times since recovering to an average between 800s to 900s.
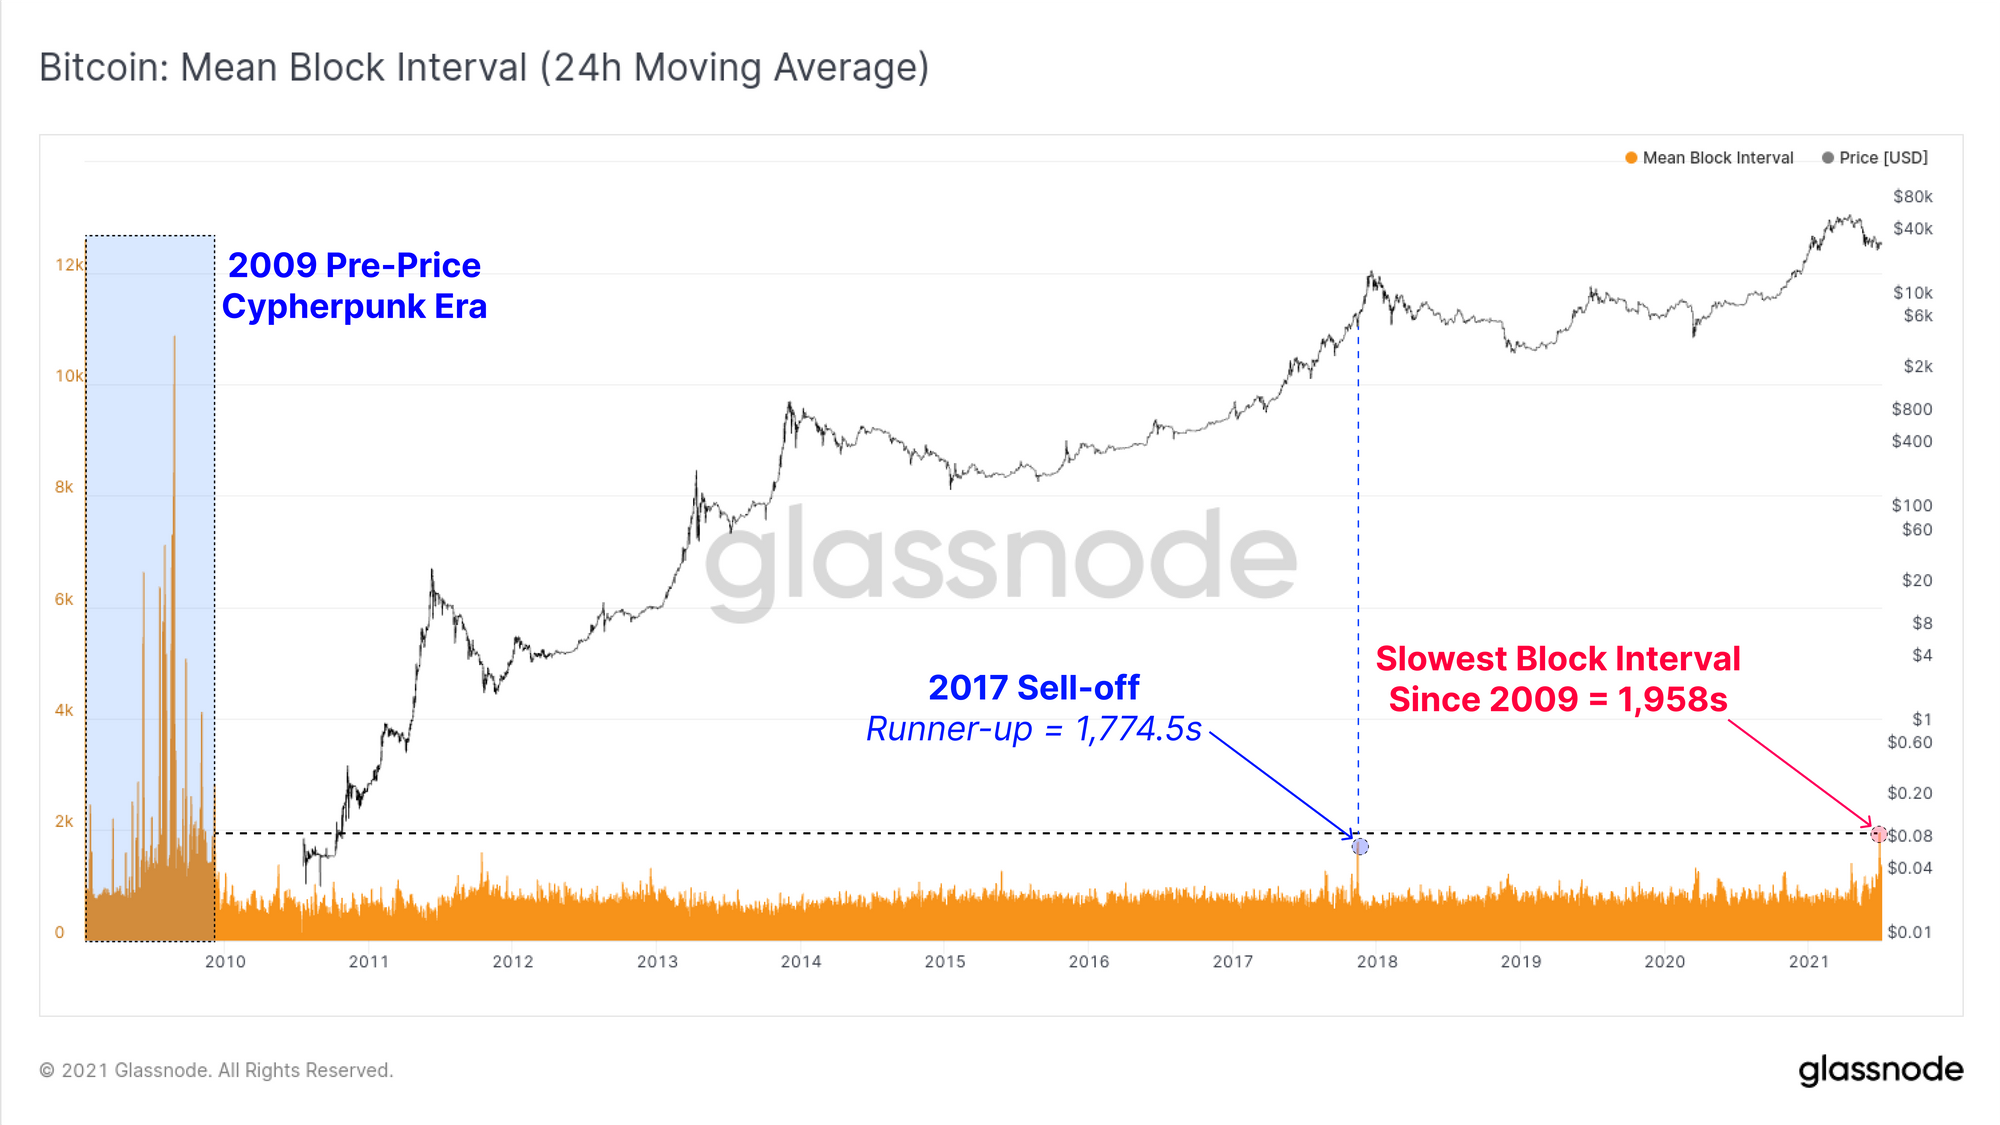
If we zoom out, we can see that this was the slowest average block-time since the 2009 cypherpunk era where Bitcoin did not even have a market price. The previous longest average block-time of 1,774.5s occurred at the bottom of the final pull-back before the 2017 blow-off top.
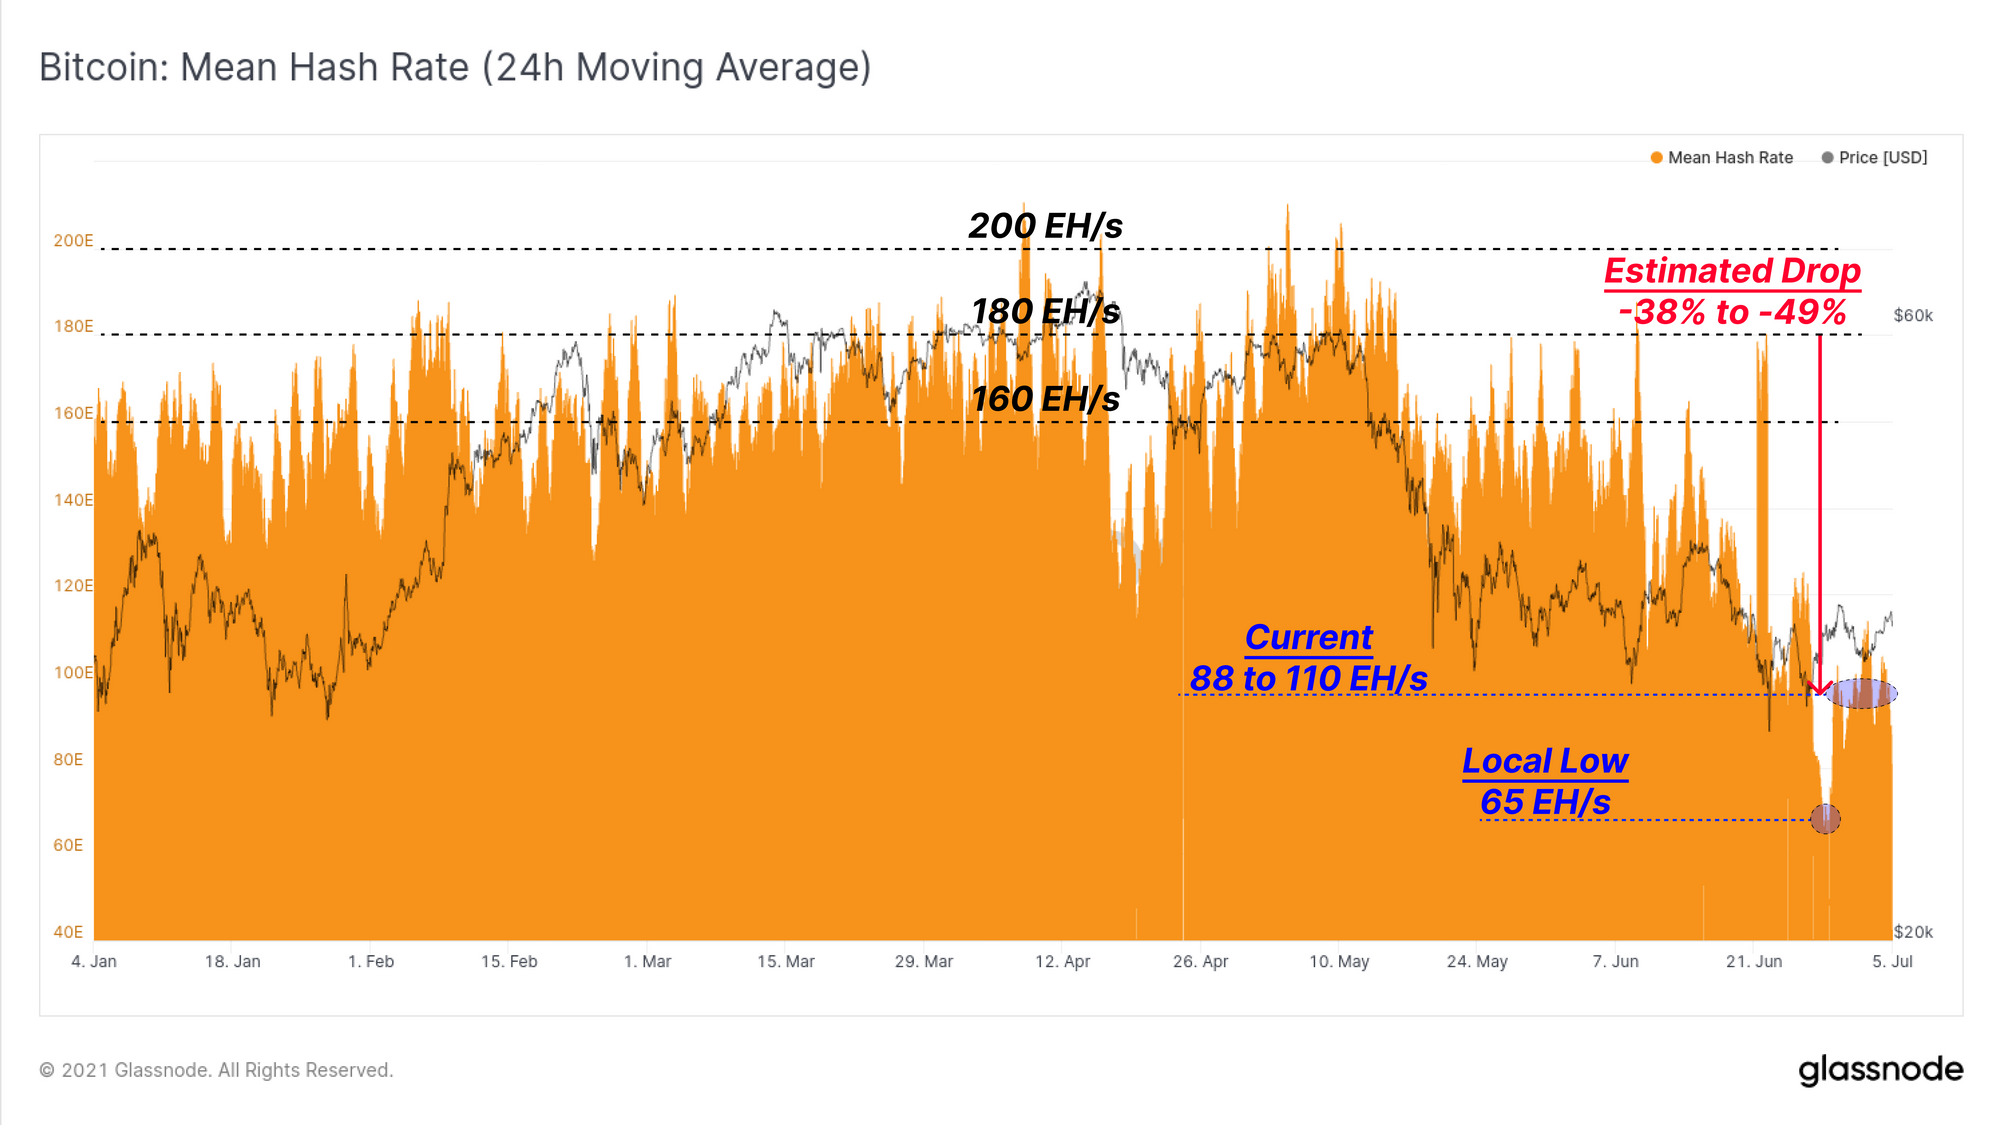
To estimate the magnitude of the hash-power shift underway, we can consider the change in estimated hash-rate since the stable peak observed in April to early May 2021. Note that hash-rate is estimated as a derivative of block-time and difficulty, and here we have used a 24-hr moving average to smooth out some of the natural variability.
Hash-rate on the network was typically around 180 EH/s at the peak, and fell off to a local low of 65 EH/s (aligned with the 1,958s average block-time on 28-June).
Hash-rate has since recovered and stabilised around the 88 to 110 EH/s range, reflecting an overall decline of 38% to 49% of hash-power. This provides a gauge on the proportion of the network that is currently offline and affected by the ban in China.
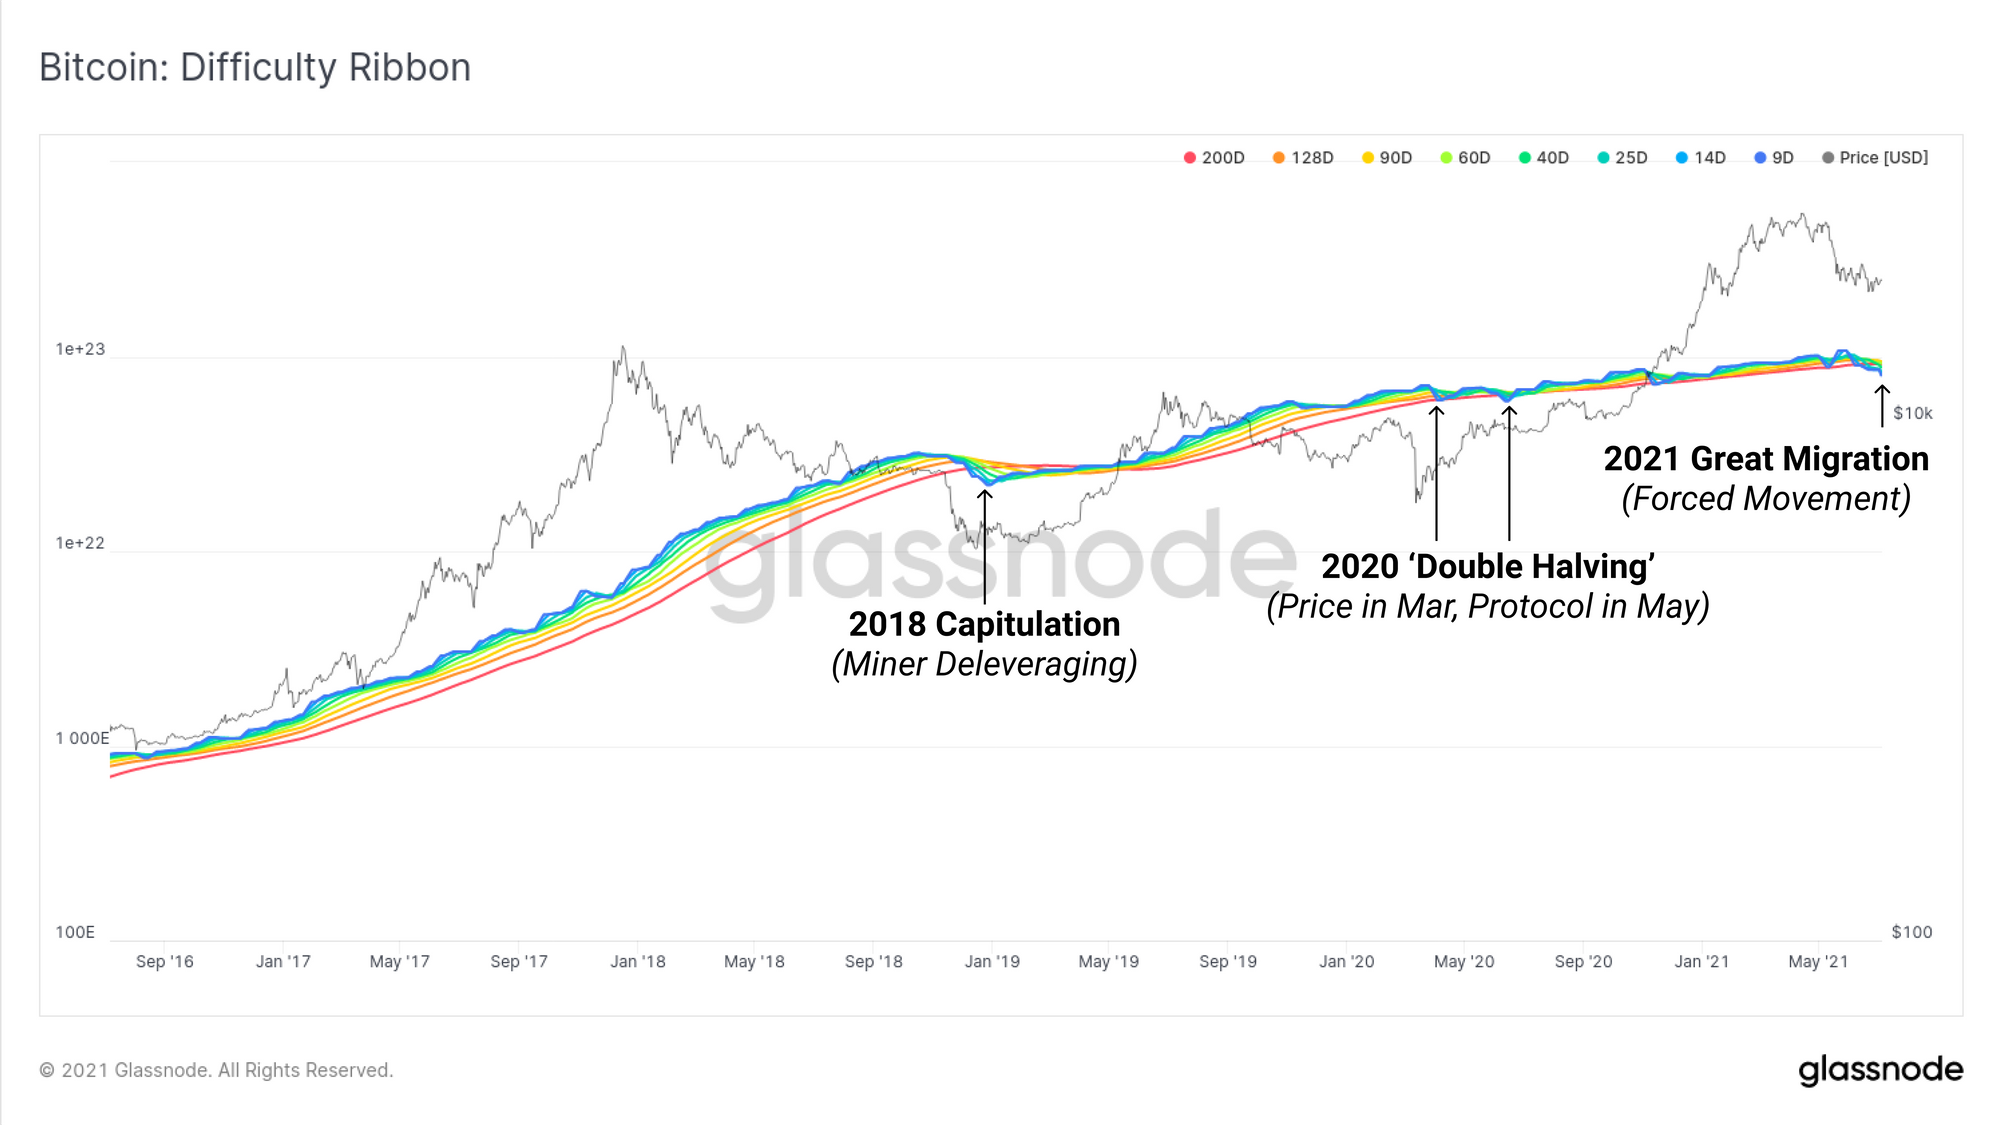
Now that protocol difficulty has adjusted down, we can see the Difficulty Ribbon has inverted to the deepest extent since the 2018 bear market capitulation. A difficulty ribbon inversion is an extremely uncommon event where the faster moving averages of difficulty (9D, 14D etc) fall below the longer term moving average (128D, 200D).
A difficulty ribbon inversion typically represent a miner capitulation event, usually observed at the end of bear markets, or after halving events when miner incomes are squeezed, and profitability takes a hit. It is a result of miners switching off the machines that are costing more than they are making, and has historically correlated with strong bullish market reversals.
Miner Revenues Get a Boost
Whilst difficulty ribbon inversions are historically bullish events, in this instance, the huge logistical costs incurred by Chinese miners may necessitate spending of accumulated BTC treasuries, creating sell pressure. However, it is important to note that there is somewhat of a counter-balance in the uplift in revenues for the remaining ~50% of operational miners.
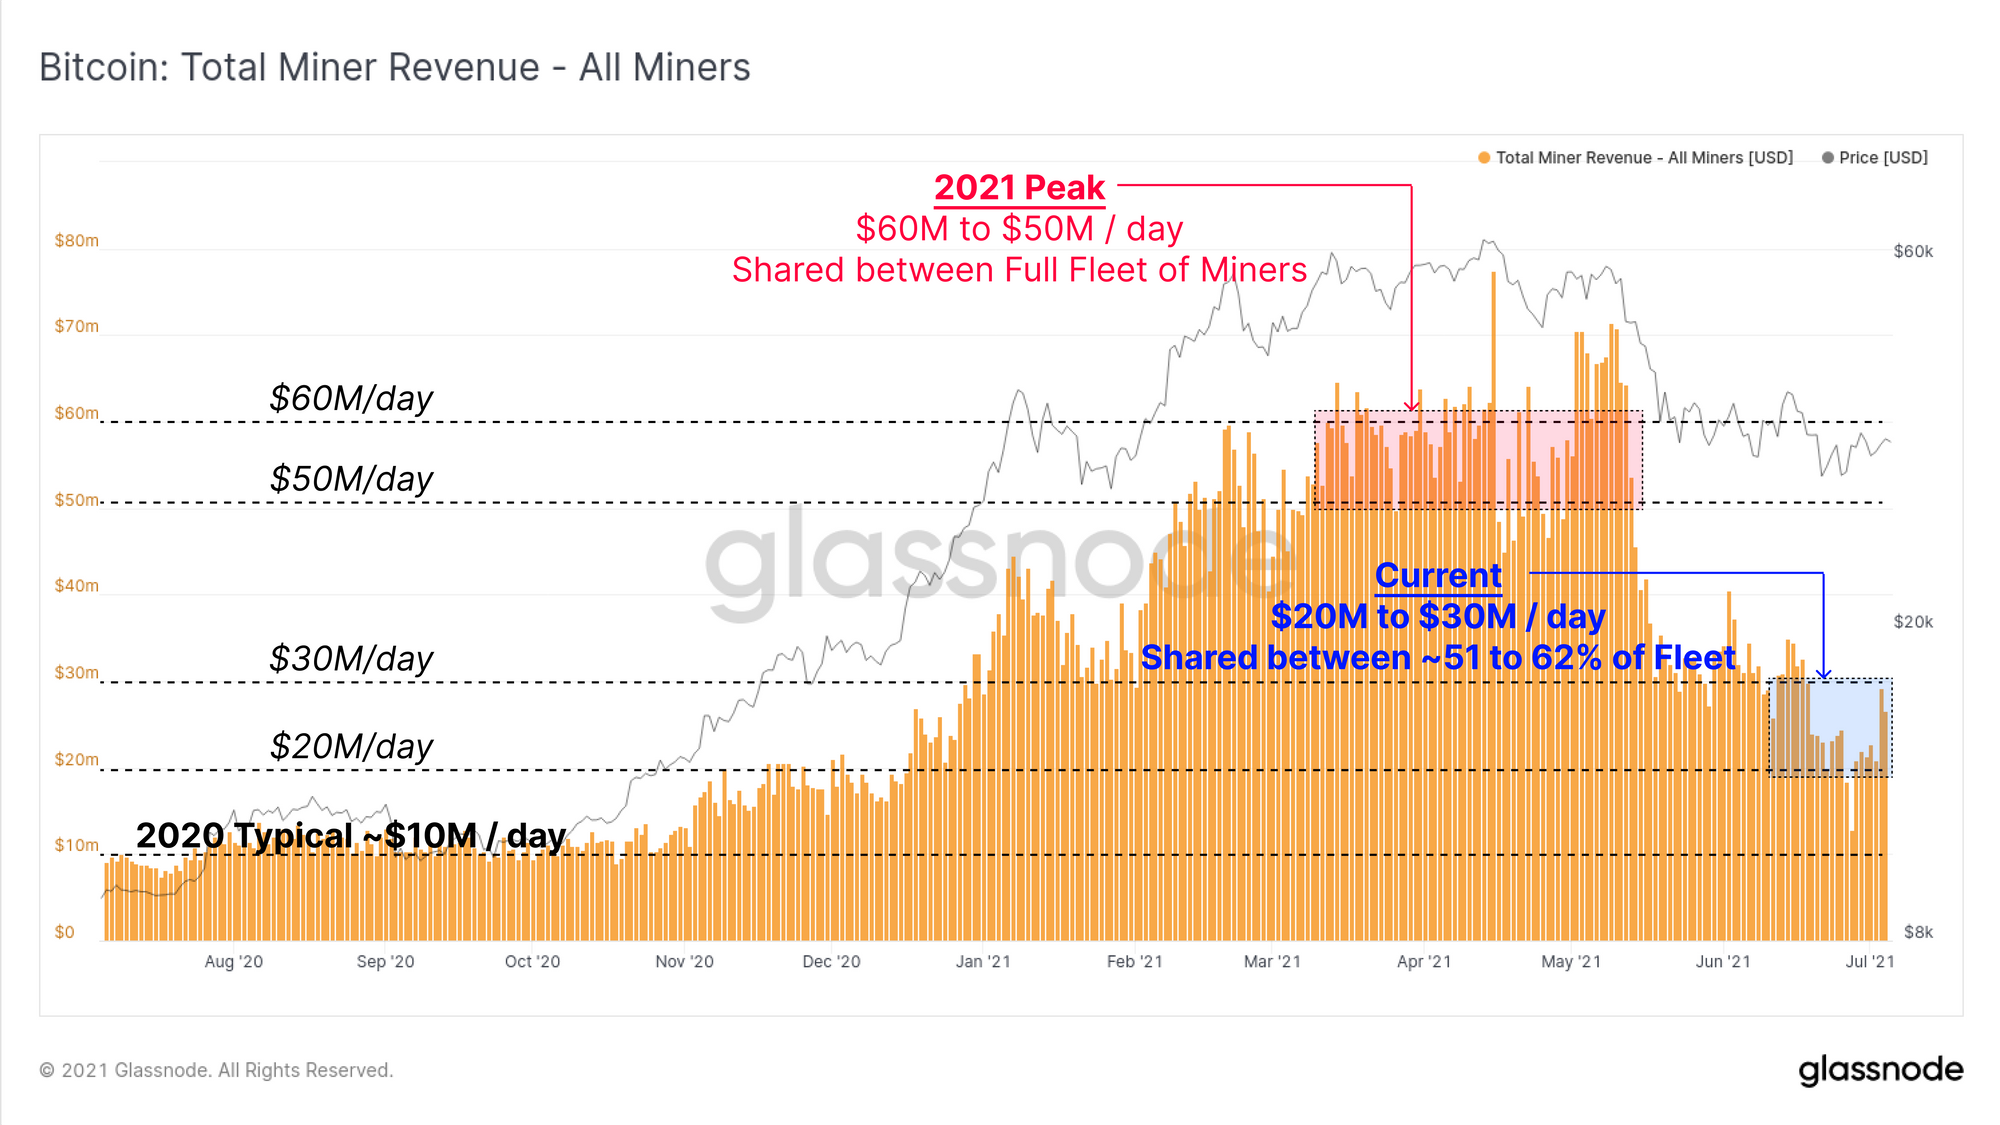
When Bitcoin was trading in the $50k to $60k range in April, hash-rate was at its peak, and the aggregate mining industry saw incomes of $50M to $60M per day. Whilst prices have since declined by around 50%, the miners who remain operational have just seen an estimated 38% to 49% of their competition switch off in the short-term.
The daily aggregate revenue now around $25M to $30M per day, but is shared amongst a smaller pool of miners. Same daily BTC issuance, fewer competitors to share the spoils.
This implies that following the latest difficulty adjustment, operational miners are incurring the same OPEX expense, but are seeing profitability rise almost 2x, approaching similar profitability levels to back in April.
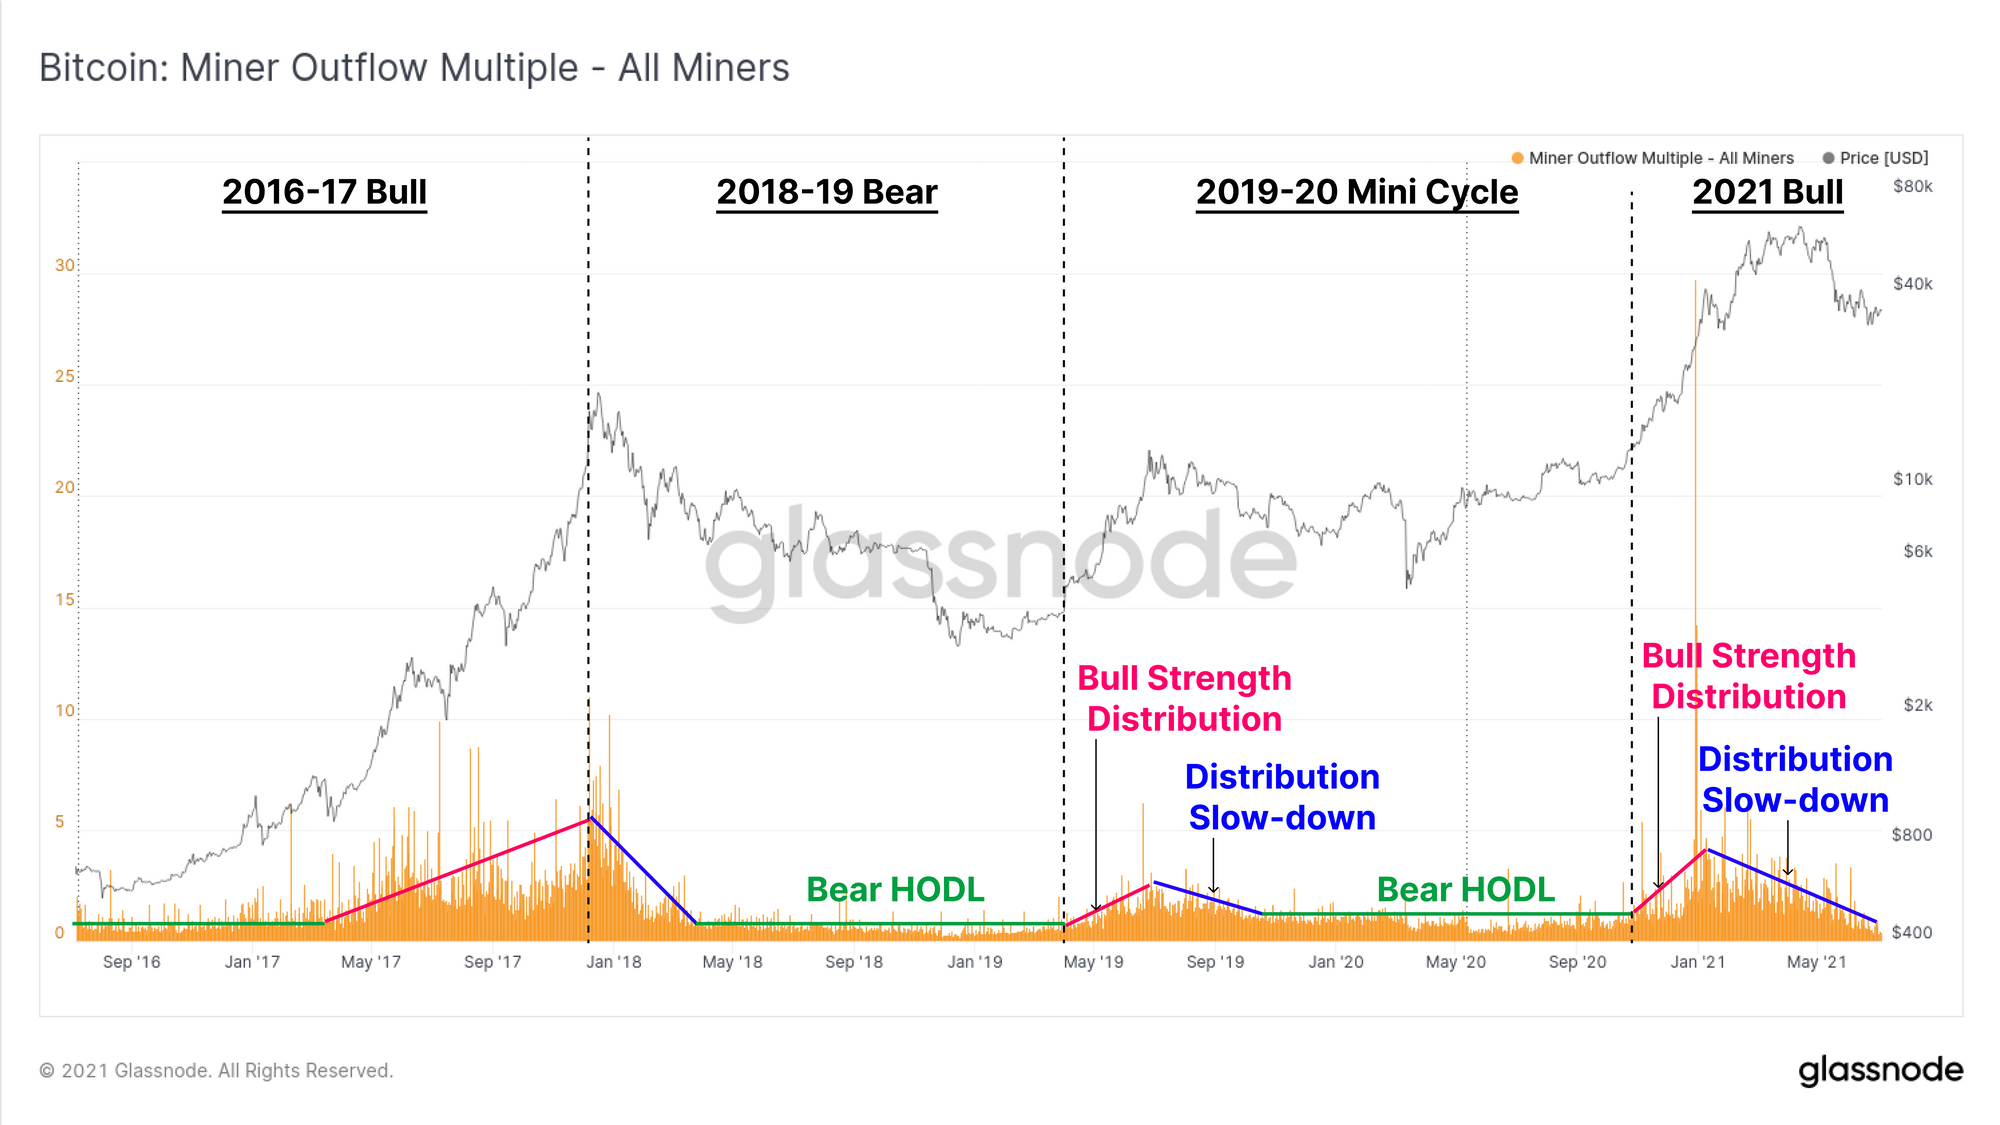
The Miner Outflow Multiple tracks the rate of miner spending relative to their yearly average. From this we can see miners have dramatically slowed their spending of late, even amidst the Great Migration. Historically, we have seen the following cyclical patterns in miner spending behaviour:
- HODLing in Bear Markets (green) where miners reach a stable steady distribution pattern (flat Outflow Multiple).
- Increased distribution in Bull Markets (red) as miners take advantage of bull market strength and sell at an accelerating pace (rising Outflow Multiple).
- Declining distribution after Market Tops (blue) as miners slow down their spending perhaps due to increasing conviction, or a desire to limit excessive the sell-pressure (declining Outflow Multiple).
Impressively, even during the Great Migration, we are yet to see a significant increase to miner spending behaviour. The speed of hash-rate recovery will provide further insight to this as:
- A quick hash-rate recovery indicates Chinese miners have successfully relocated, liquidated hardware, or otherwise recovered costs, reducing the risk of treasury BTC sales.
- A slow prolonged hash-rate recovery indicates the inverse, and increases the odds that costs are being carried, debts are accumulating, and thus creating a higher probability for miner BTC sales.
In fact since early 2020, the macro spending behaviour of miners has changed dramatically. For almost all of Bitcoins trading history, miners have consistently spent more coins than they accumulated such that unspent supply was in a structural downtrend.
This means that miners historically spent more coins than they accumulated.
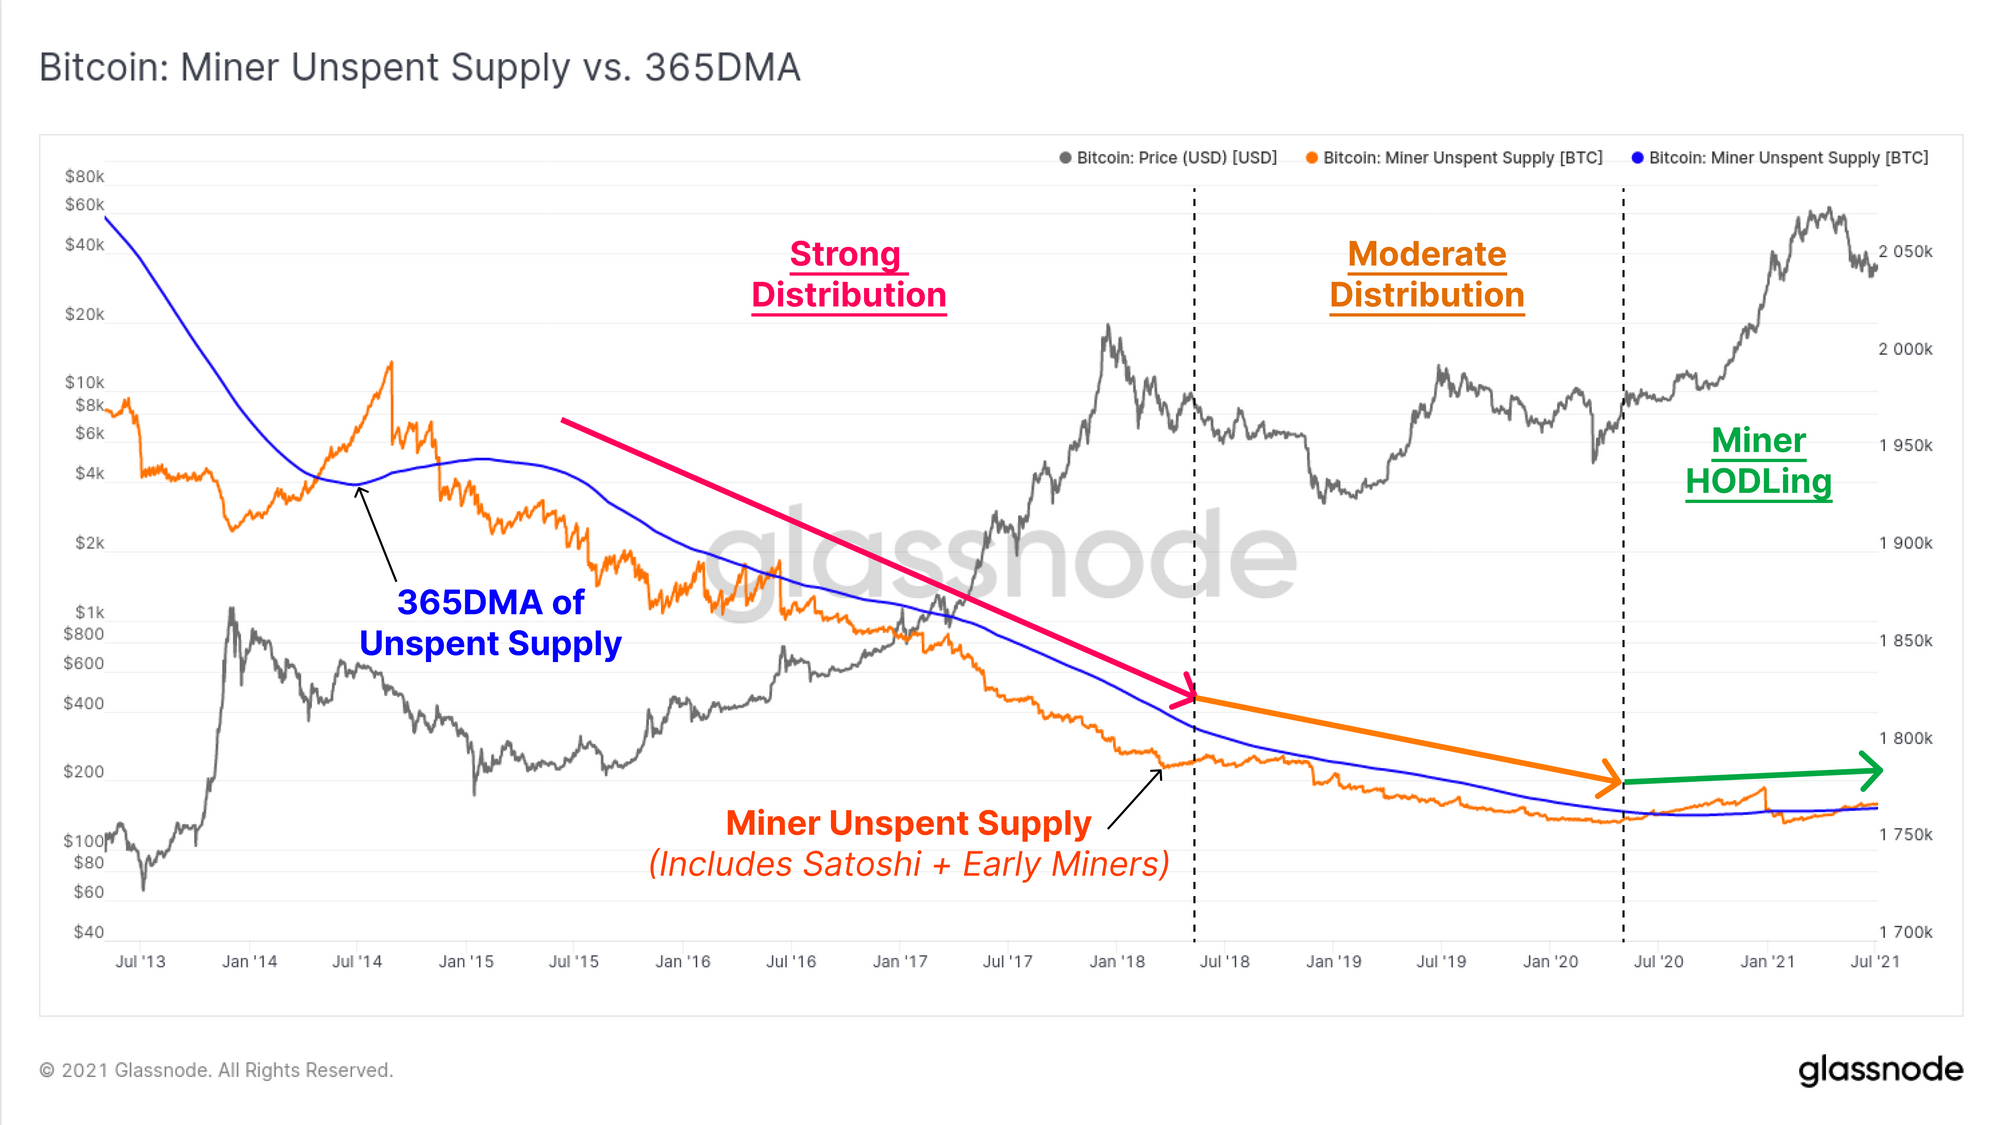
The chart below shows the unspent miner supply (i.e. coinbase transactions that have never moved) plotted against its 365-day moving average. From mid 2020, the structural downtrend in miner distribution, appears to have not only flattened out, but reversed. The unspent BTC in coinbase outputs is now above its yearly average.
This suggests that miners have begun accumulating in a way the market has not seen to date. Given the timing of this event, there are likely a number of factors to consider behind this:
- The macro monetary landscape supporting the case for Bitcoin became globally apparent in 2020, increasing miner conviction.
- Miners have access to vastly superior financing options such as coin collateralised debt, and liquid options and futures markets to hedge risk.
- Reduced ASIC miner production due to constraints on global chip fabrication capacity. As price rises, existing hash-power becomes increasingly profitable as little new competition can come to market.
As prices rallied in the bull market, BTC mining is likely to have been (and still be) particularly lucrative through this halving epoch.
Scarcer than Gold
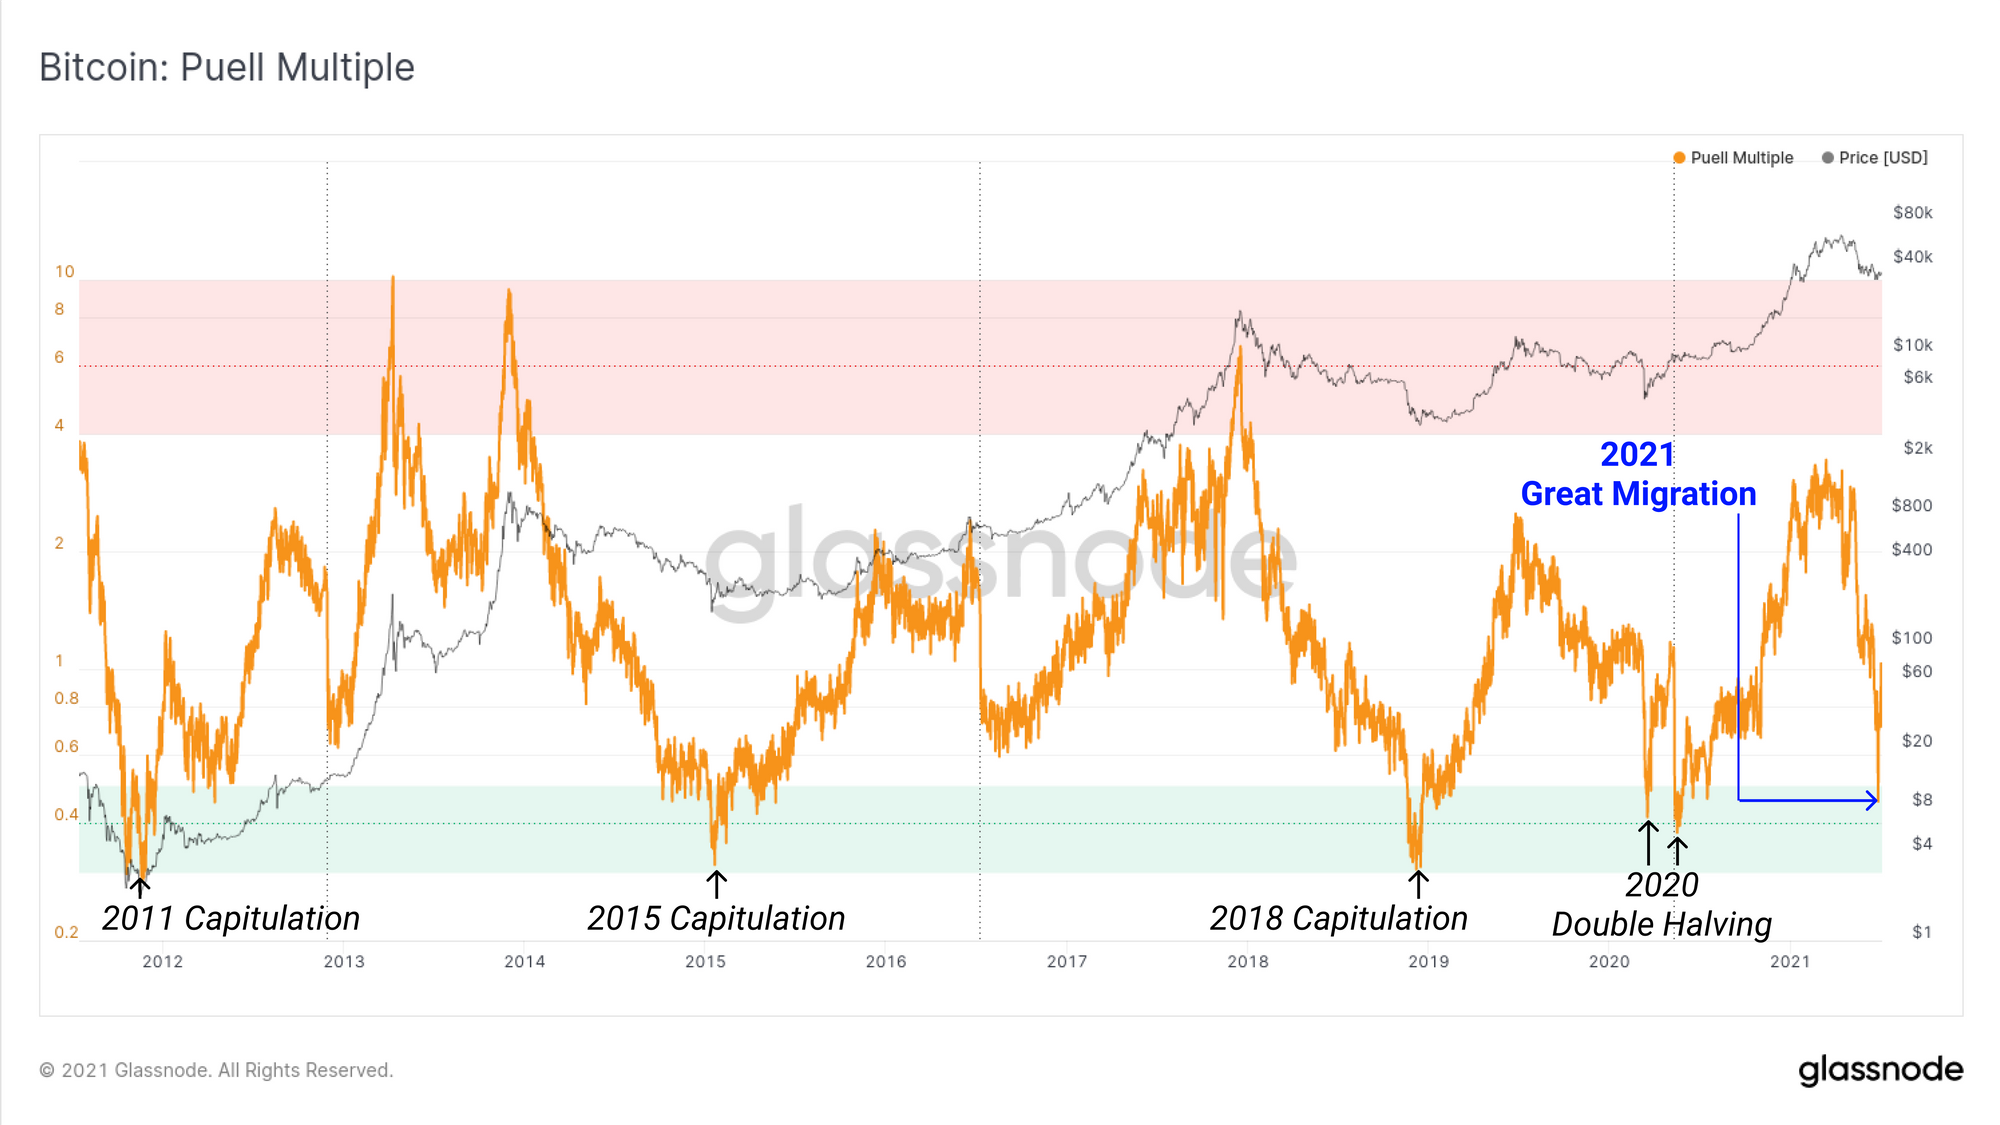
Many analysts have pointed out this week that the Puell Multiple, an indicator for miner profitability, also dropped into the 'undervalued zone'. The Puell Multiple is calculated by taking the ratio between daily aggregate USD miner revenue, and its 365-day moving average.
- High Puell Multiples indicate strong profitability and thus high incentives for miners to sell thus increasing liquid coin supply on the market.
- Low Puell Multiples indicate poor profitability, miner capitulation and the gaining in share of hash-power by stronger miners, eventually leading to a supply squeeze.
Like the Difficulty Ribbon inversion, this is a rare event, having happened only five times in history, usually during generational market capitulation events.
However, as is the case for many metrics, who doesn't love a little bit of nuance?
The principle reason the Puell Multiple dropped like a stone, (and then promptly reversed) is actually a technical one:
- Block-times slowed down by 226% on 28-June.
- This means only 58 of the target 144 blocks were mined that day (40%).
- As a result, only 40% of the expected BTC was issued that day making aggregate miner revenues fall by 60%.
- The difficulty adjustment has since corrected this.
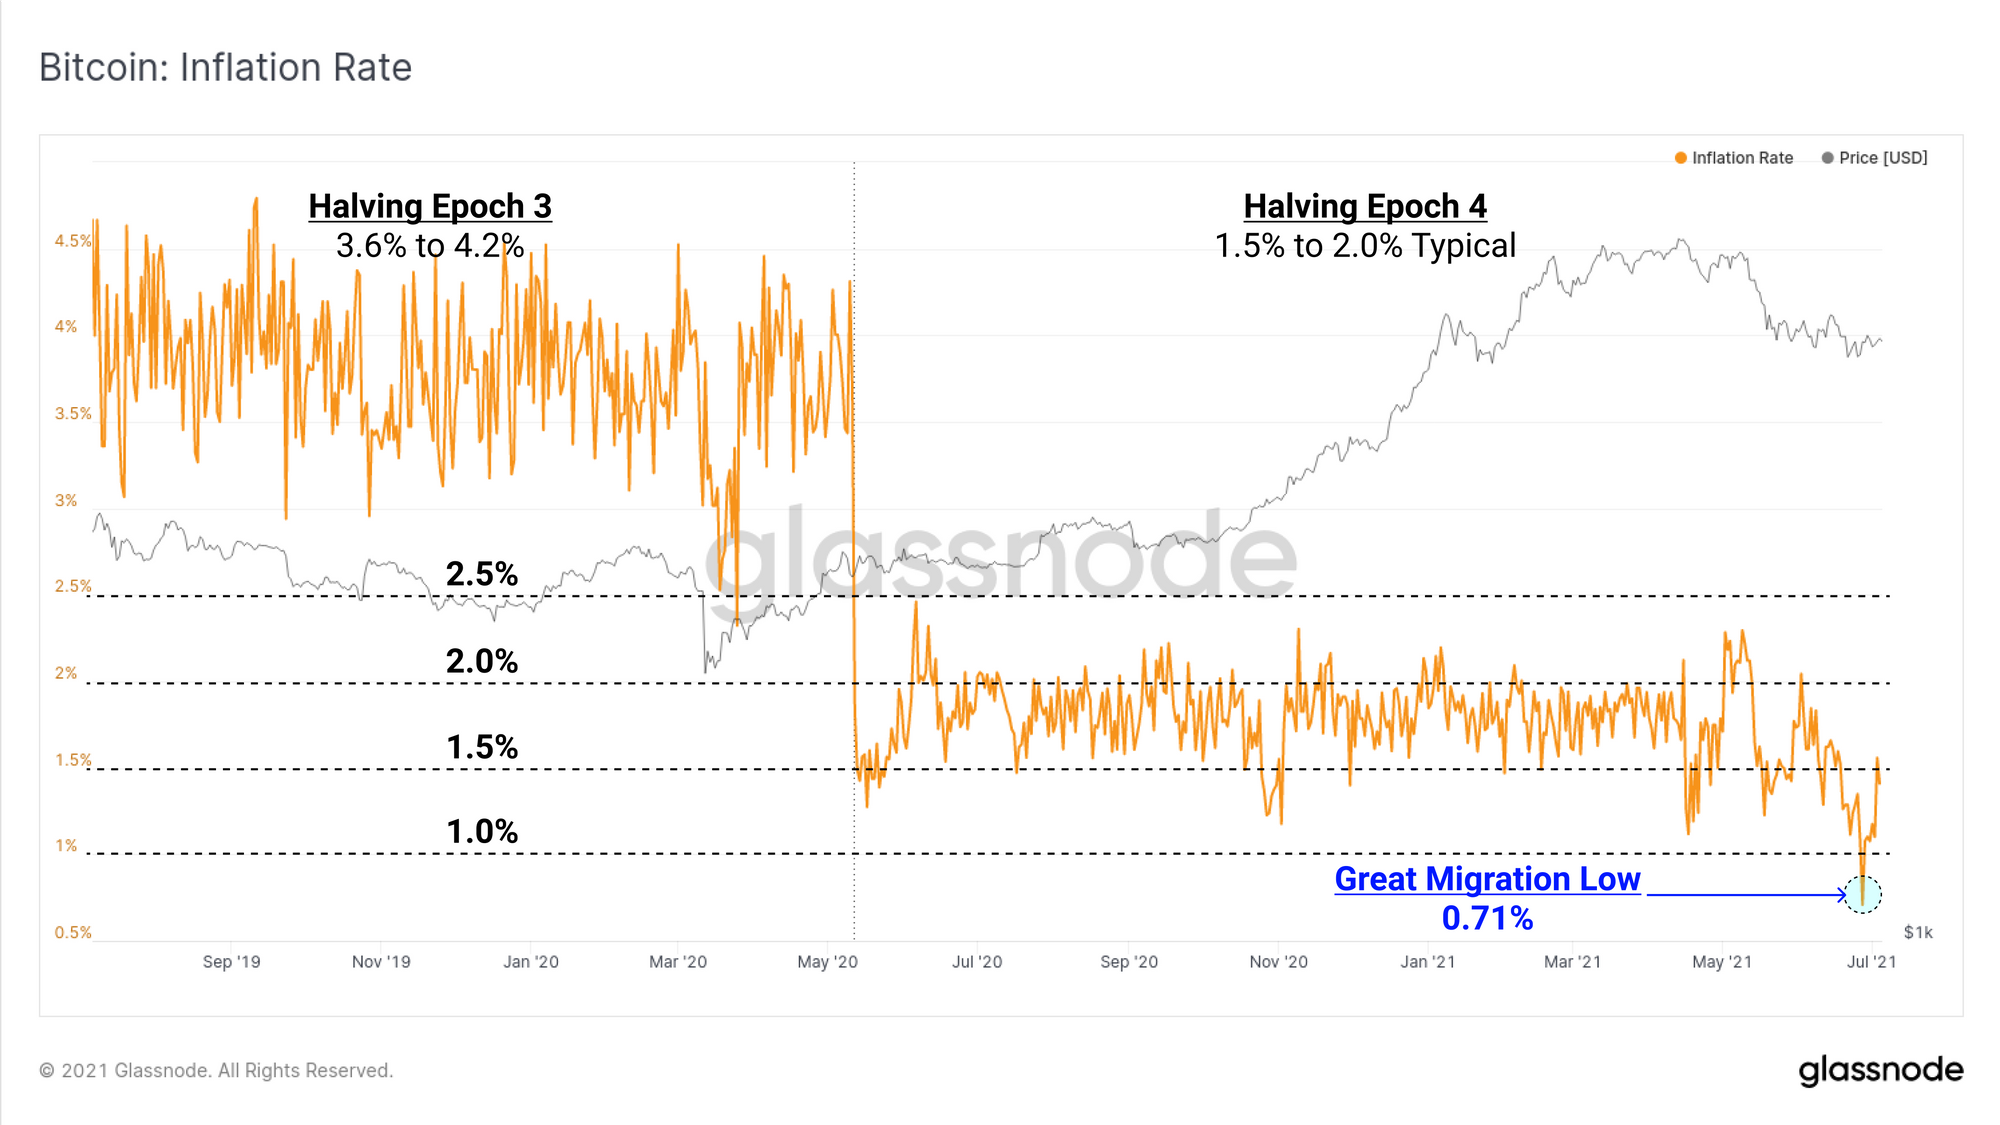
In fact the issuance rate of Bitcoin fell to an all time low of 0.71%, making for a stock-to-flow ratio of 140. Bitcoin was technically 2.37x scarcer than gold (S2F of 59)...if just for one day...
Week On-chain Dashboard
The Week On-chain Newsletter now has a live dashboard for all featured charts