The Week On-chain (Week 30, 2021)
The Bitcoin market has experienced a strong rally off the back of a short squeeze returning many coin holders to profitability.


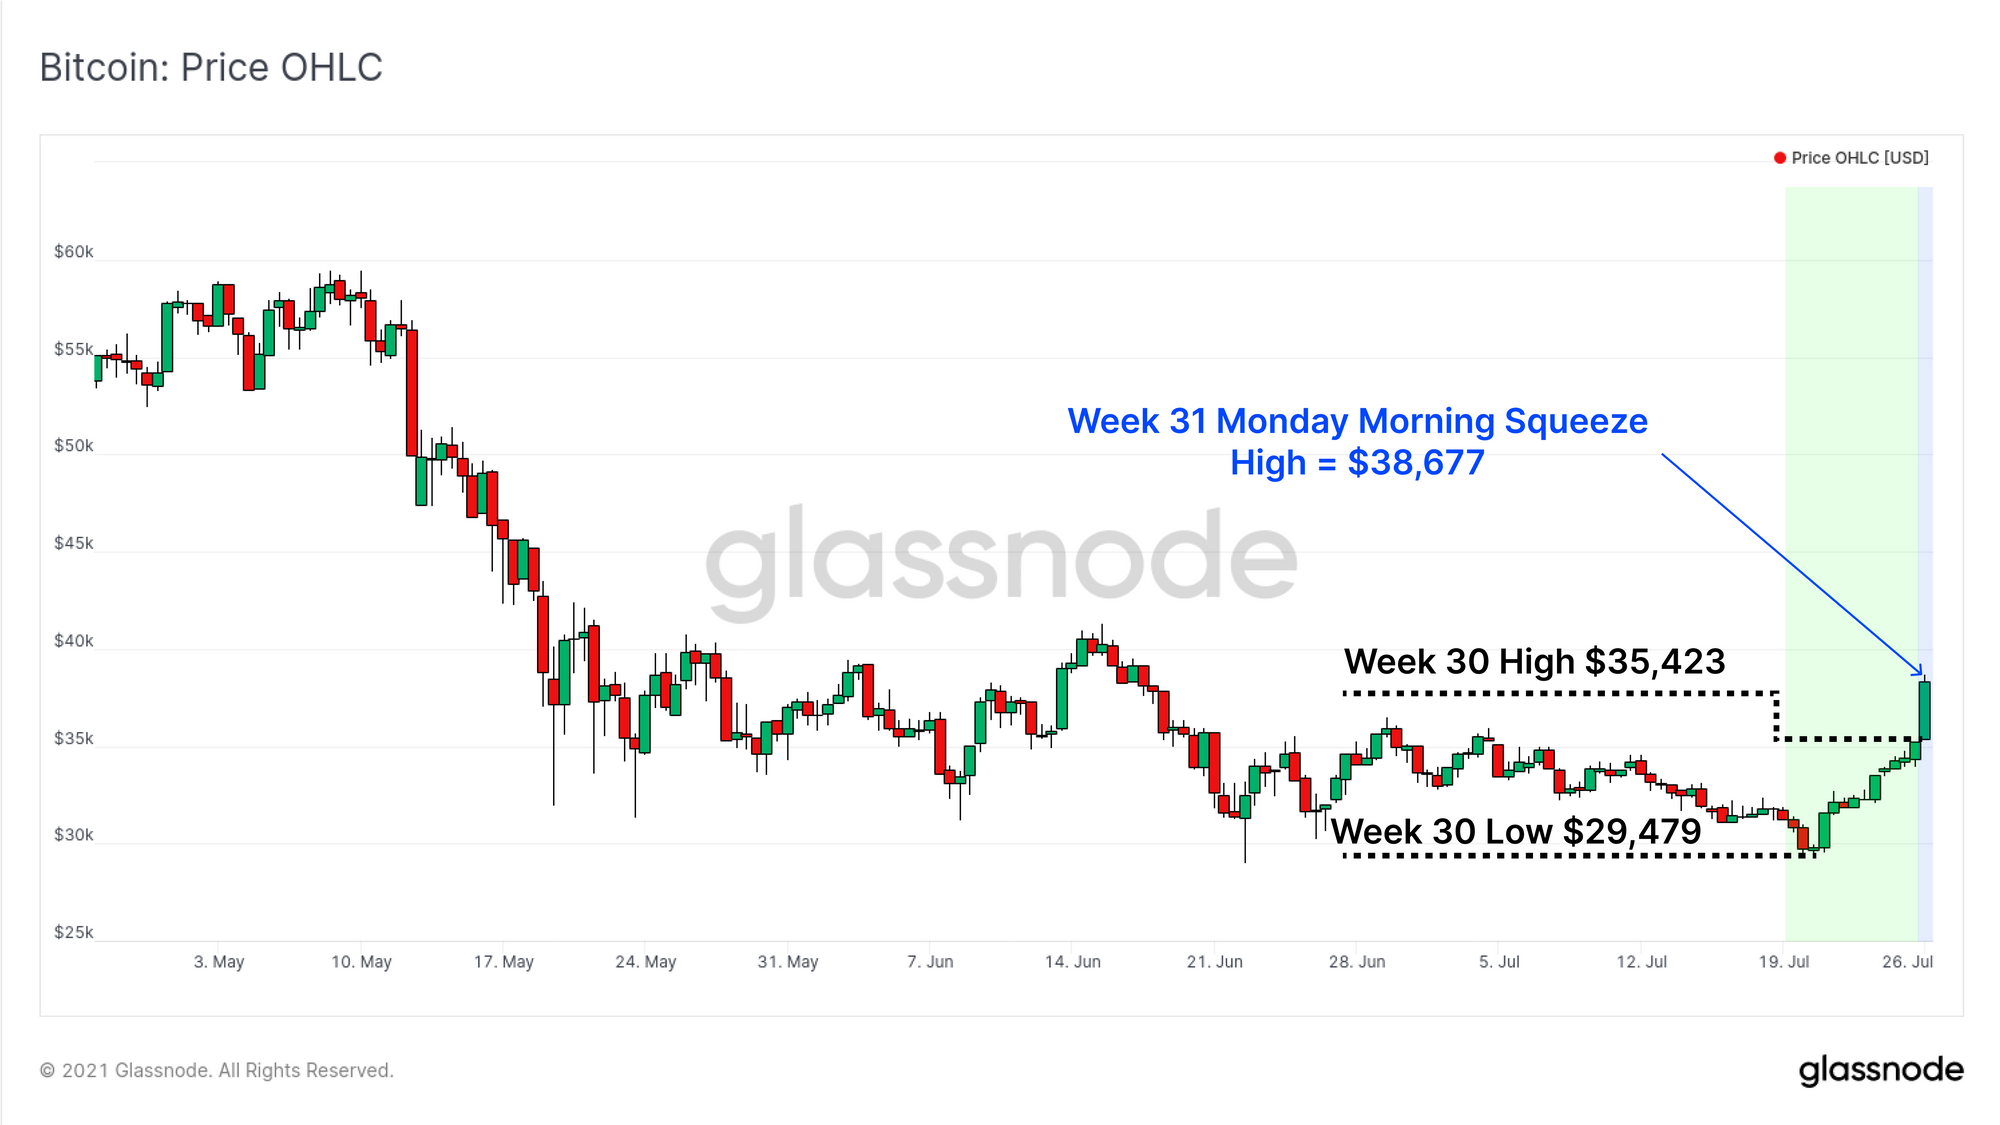
The Bitcoin market has experienced a strong break-out out this week, trading from the consolidation lows of $29,479, to a high of $35,423 on Sunday. Whilst technically an event for next weeks newsletter, at the time of writing, Bitcoin's price was ralling off the back of what appears to be a short squeeze, reaching a high of $38,677 early Monday morning.
This week we will review both the derivatives and on-chain market data to assess the lead into this short squeeze, and establish a basis for the profitability of the market. As investors return to profitability, it asks the question as to whether or not they will begin spending those coins into market strength if conviction to hold remains, or has it waned.
Shorts Squeezed Higher
With the growth and maturing of derivative markets, the interplay between spot and leveraged markets creates new dynamics in this market cycle that were not present in the past.
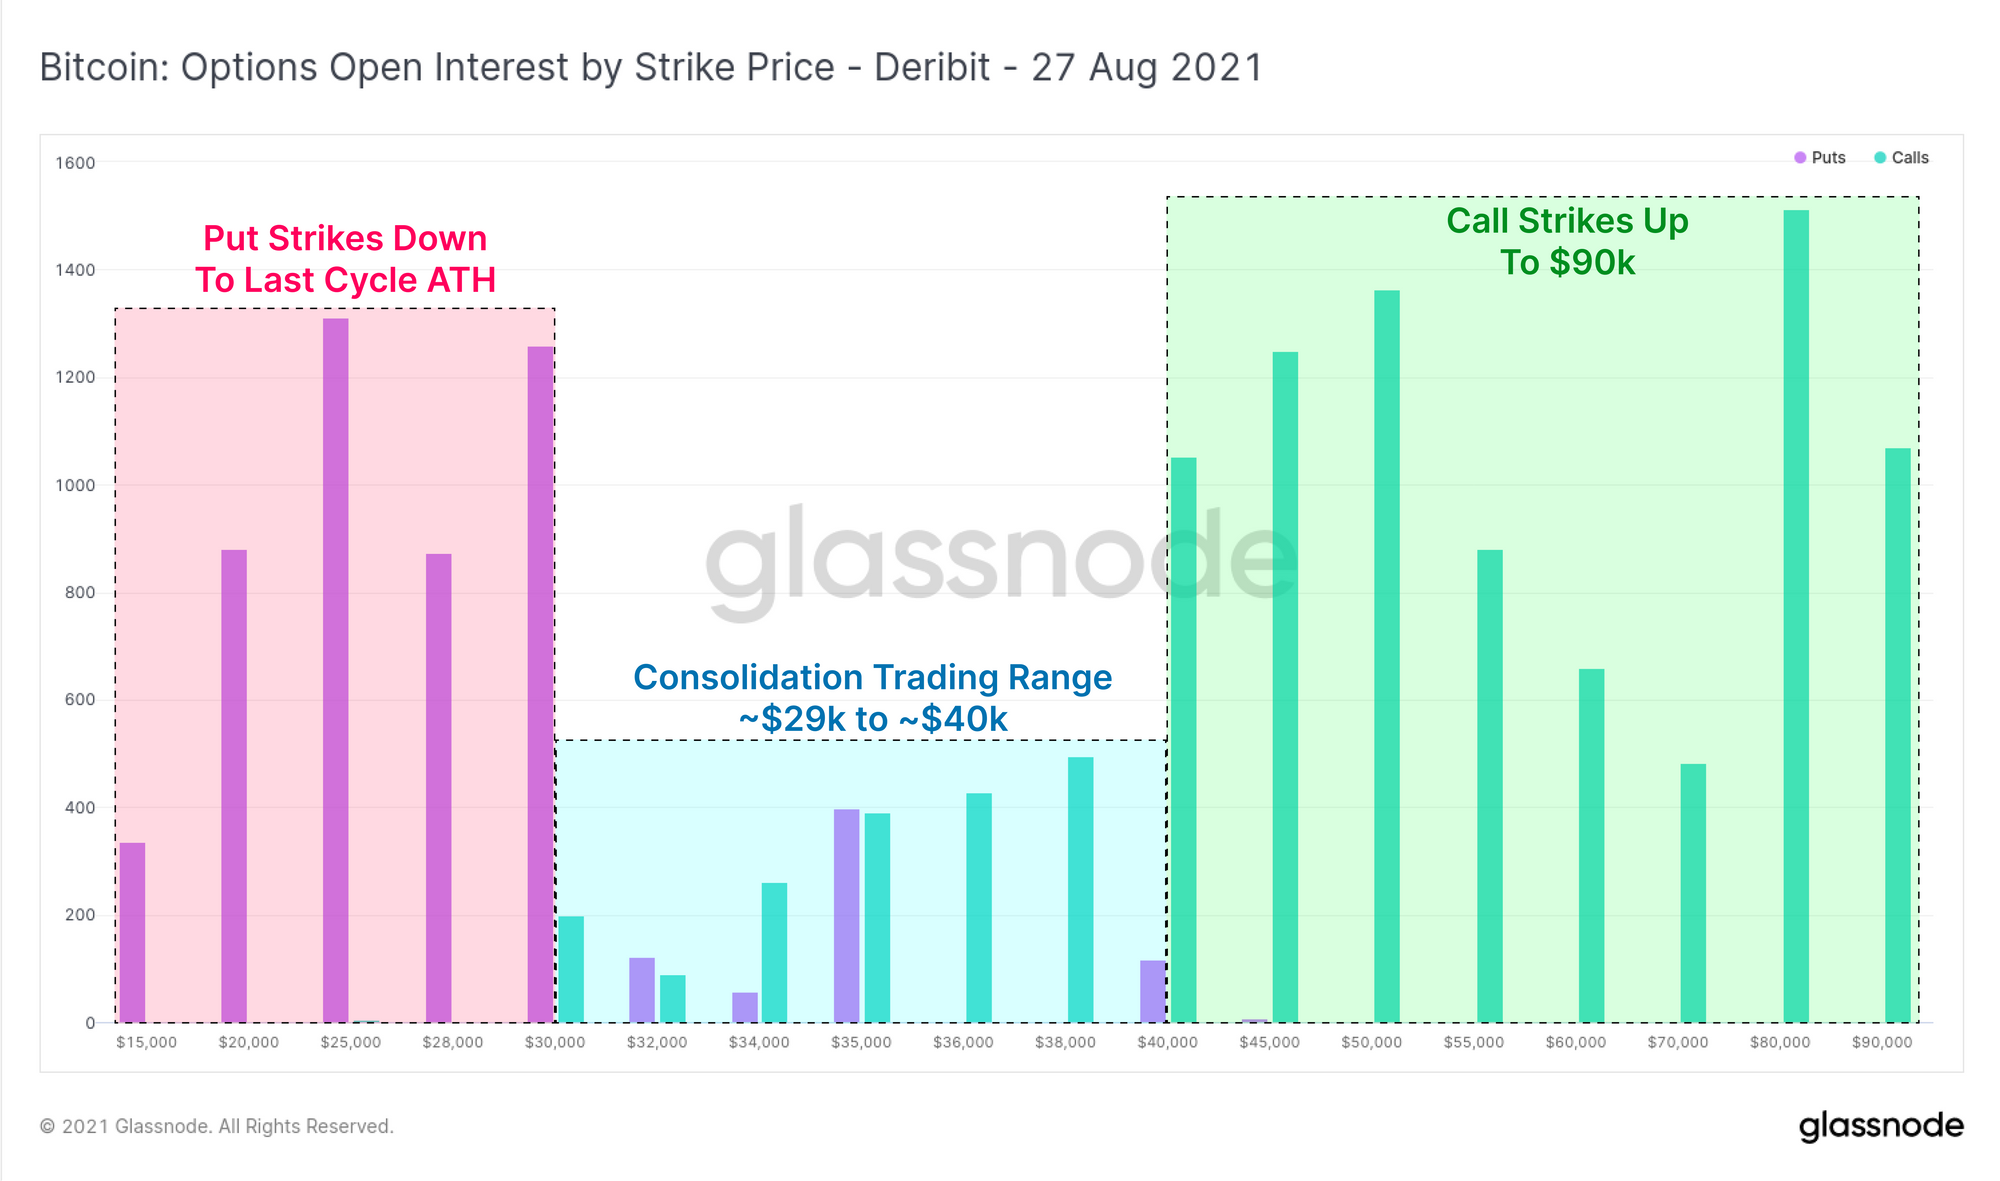
As we opened the week, open interest in the options markets suggested that volatility was expected. Open interest by strike price one month out (27-August contracts) shows a notable preference for strikes well outside the current consolidation range. The strike prices with the most open interest for 27-Aug on Deribit are:
- $25k for Puts with 1,388 BTC in open interest.
- $80k for Calls with 1,513 BTC in open interest.
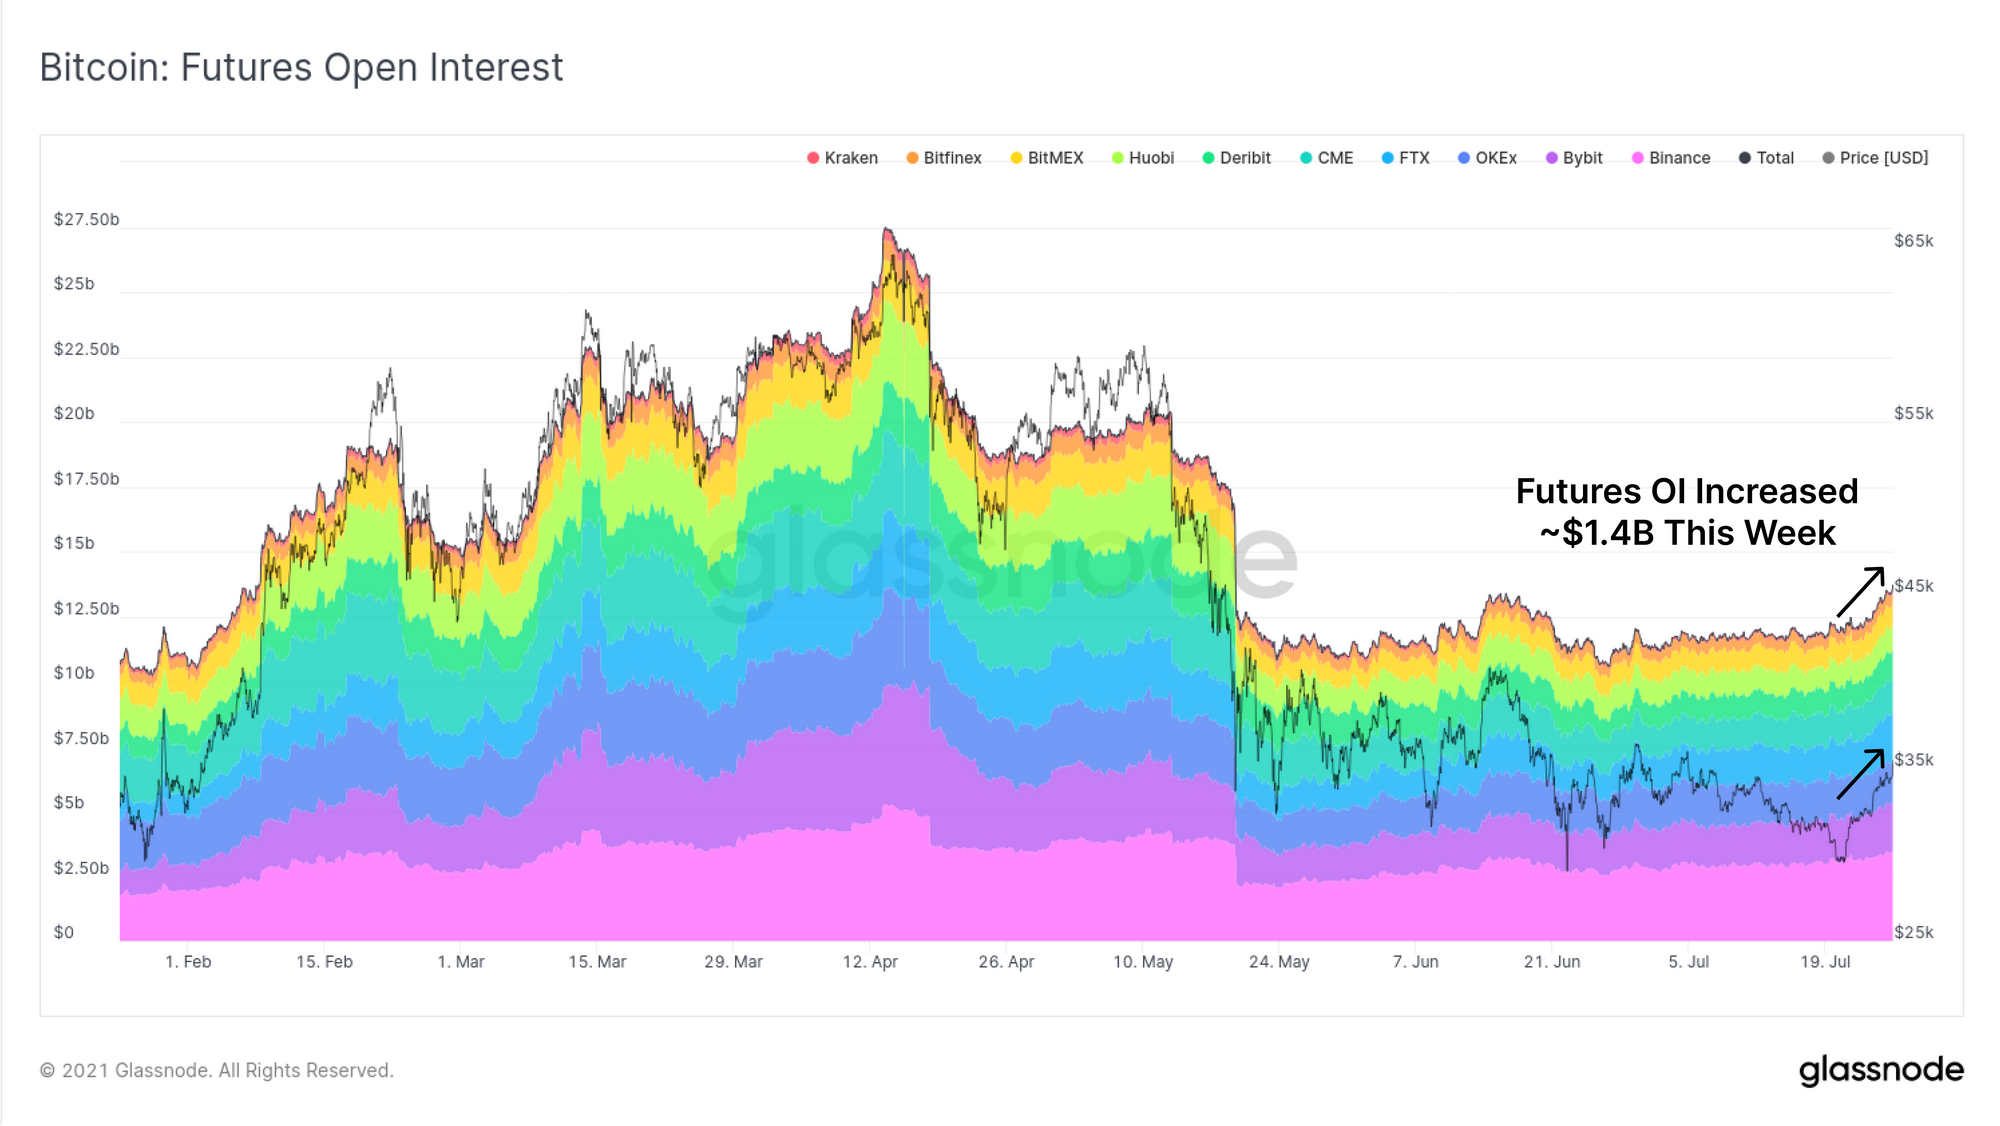
Open interest in perpetual futures markets has remained largely flat over the past two months, ranging between around $10B and $12B since May. Over the last week however, perpetual futures open interest climbed by a notable $1.4B alongside the rally in price. Often-times, elevated open interest starts to increase probabilities of a volatile leverage squeeze occurring.
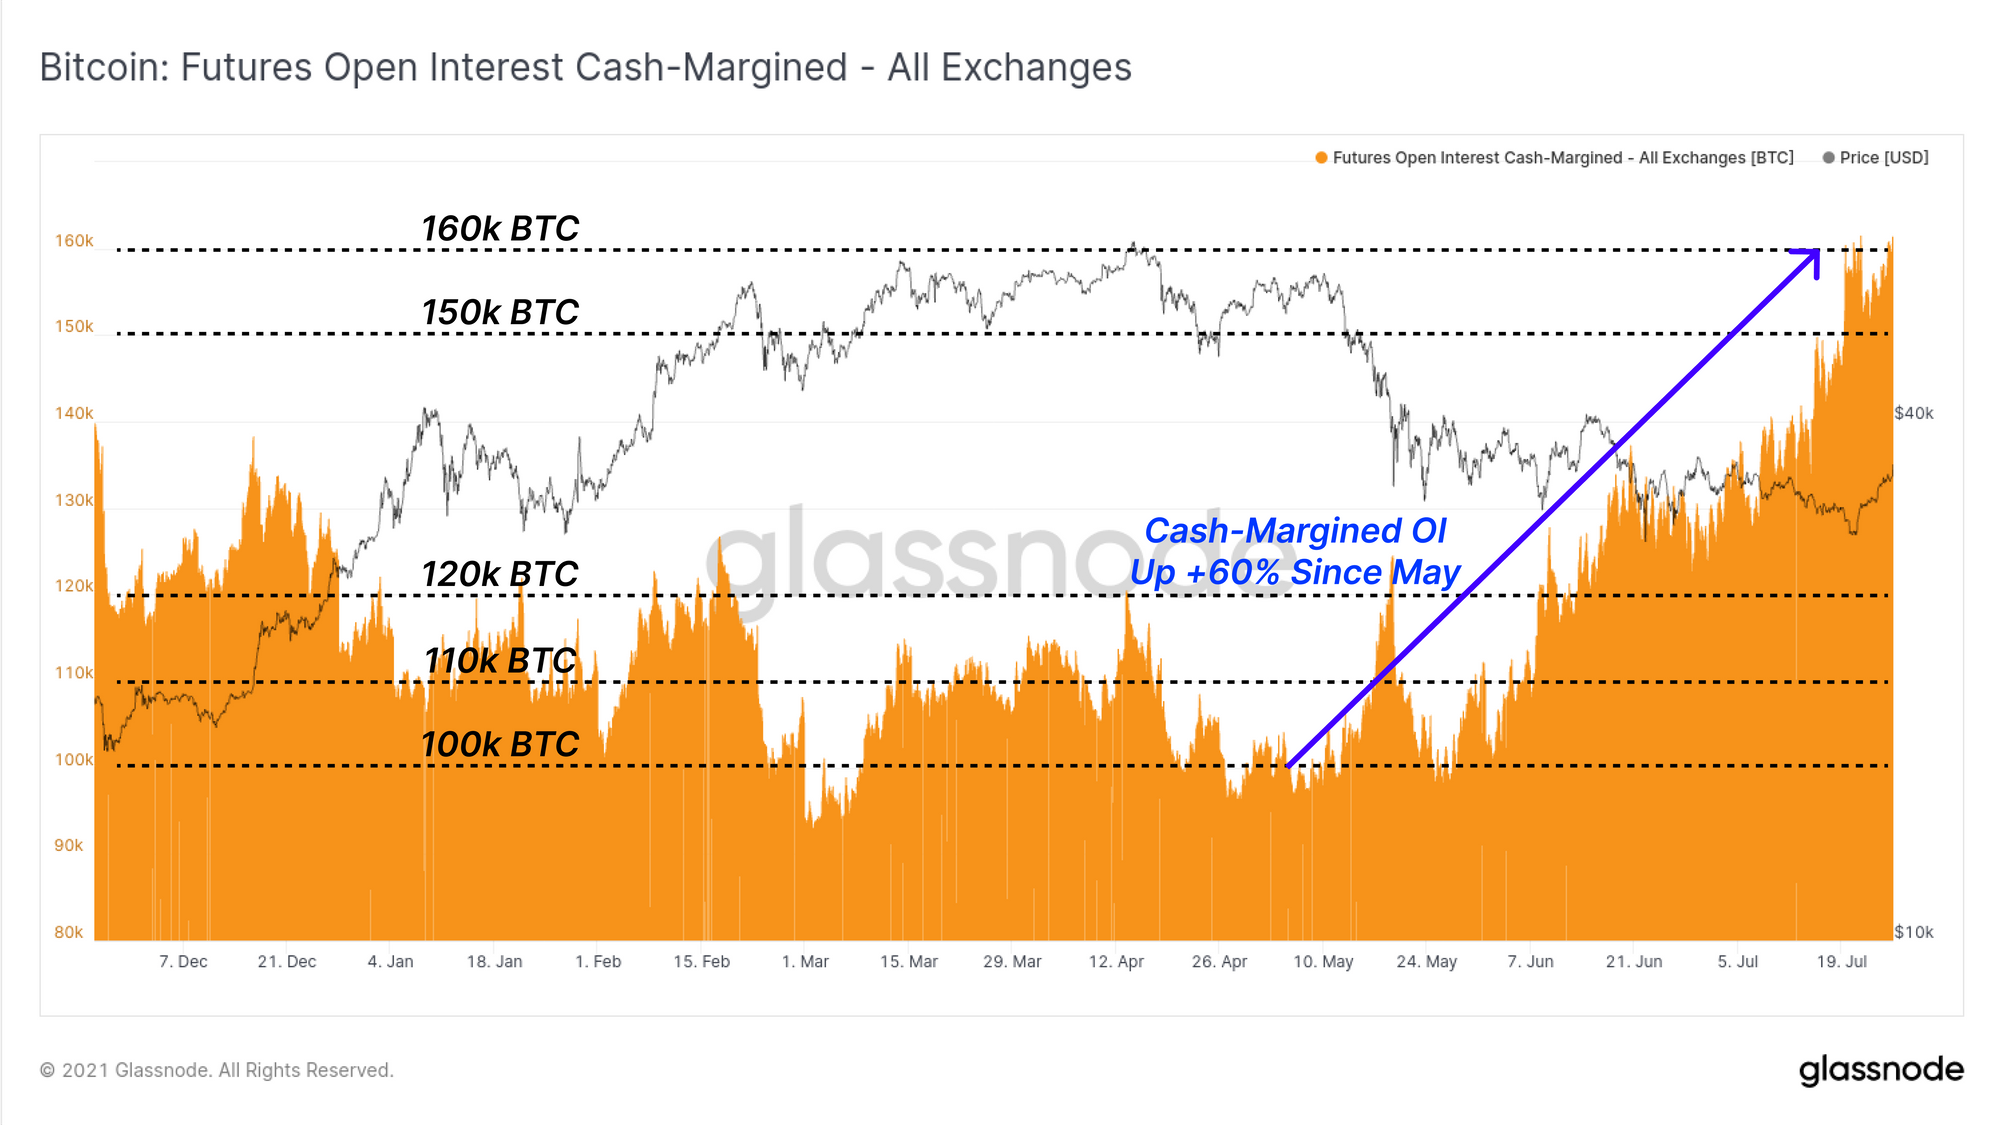
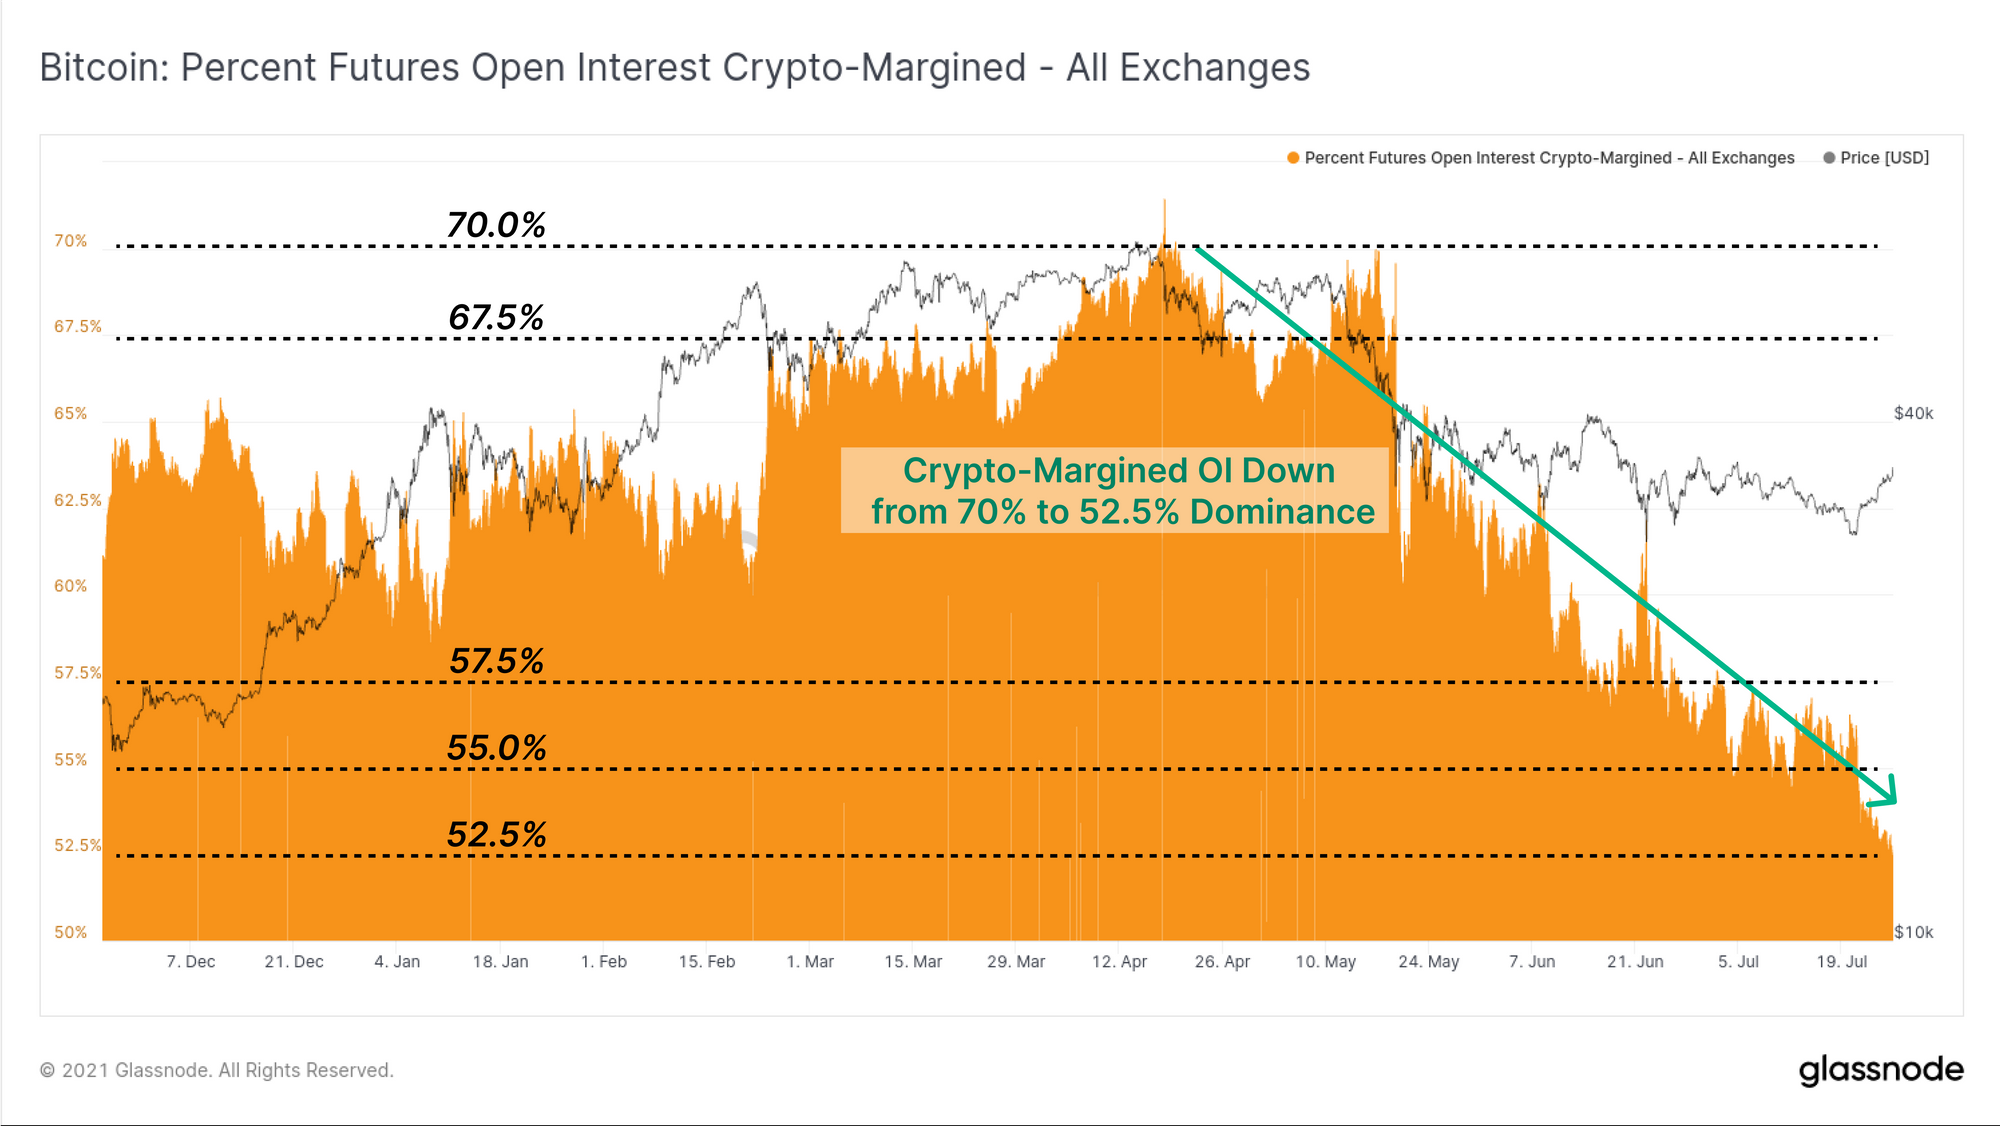
If we assess the volume derived from cash-margined collateral, we can see a structural uptrend has been in play since early May. Cash-margined collateral are those futures positions that leverage cash, or cash equivalent (stablecoin) based collateral. In general, cash-margined positions are preferable for market stability as they remove a layer of risk that is present when volatile crypto-margined futures dominate.
Confirming this trend, we can see the relative dominance of crypto-margined futures positions has been in structural decline over the same period, falling from 70% down to 52.5%. Whilst leverage in all forms is known to exacerbate market volatility, these two charts show a clear decline in traders taking on risk-on crypto-margined positions which is a net positive trend for the market. It also adds weight to the risk-off nature of the current market structure.
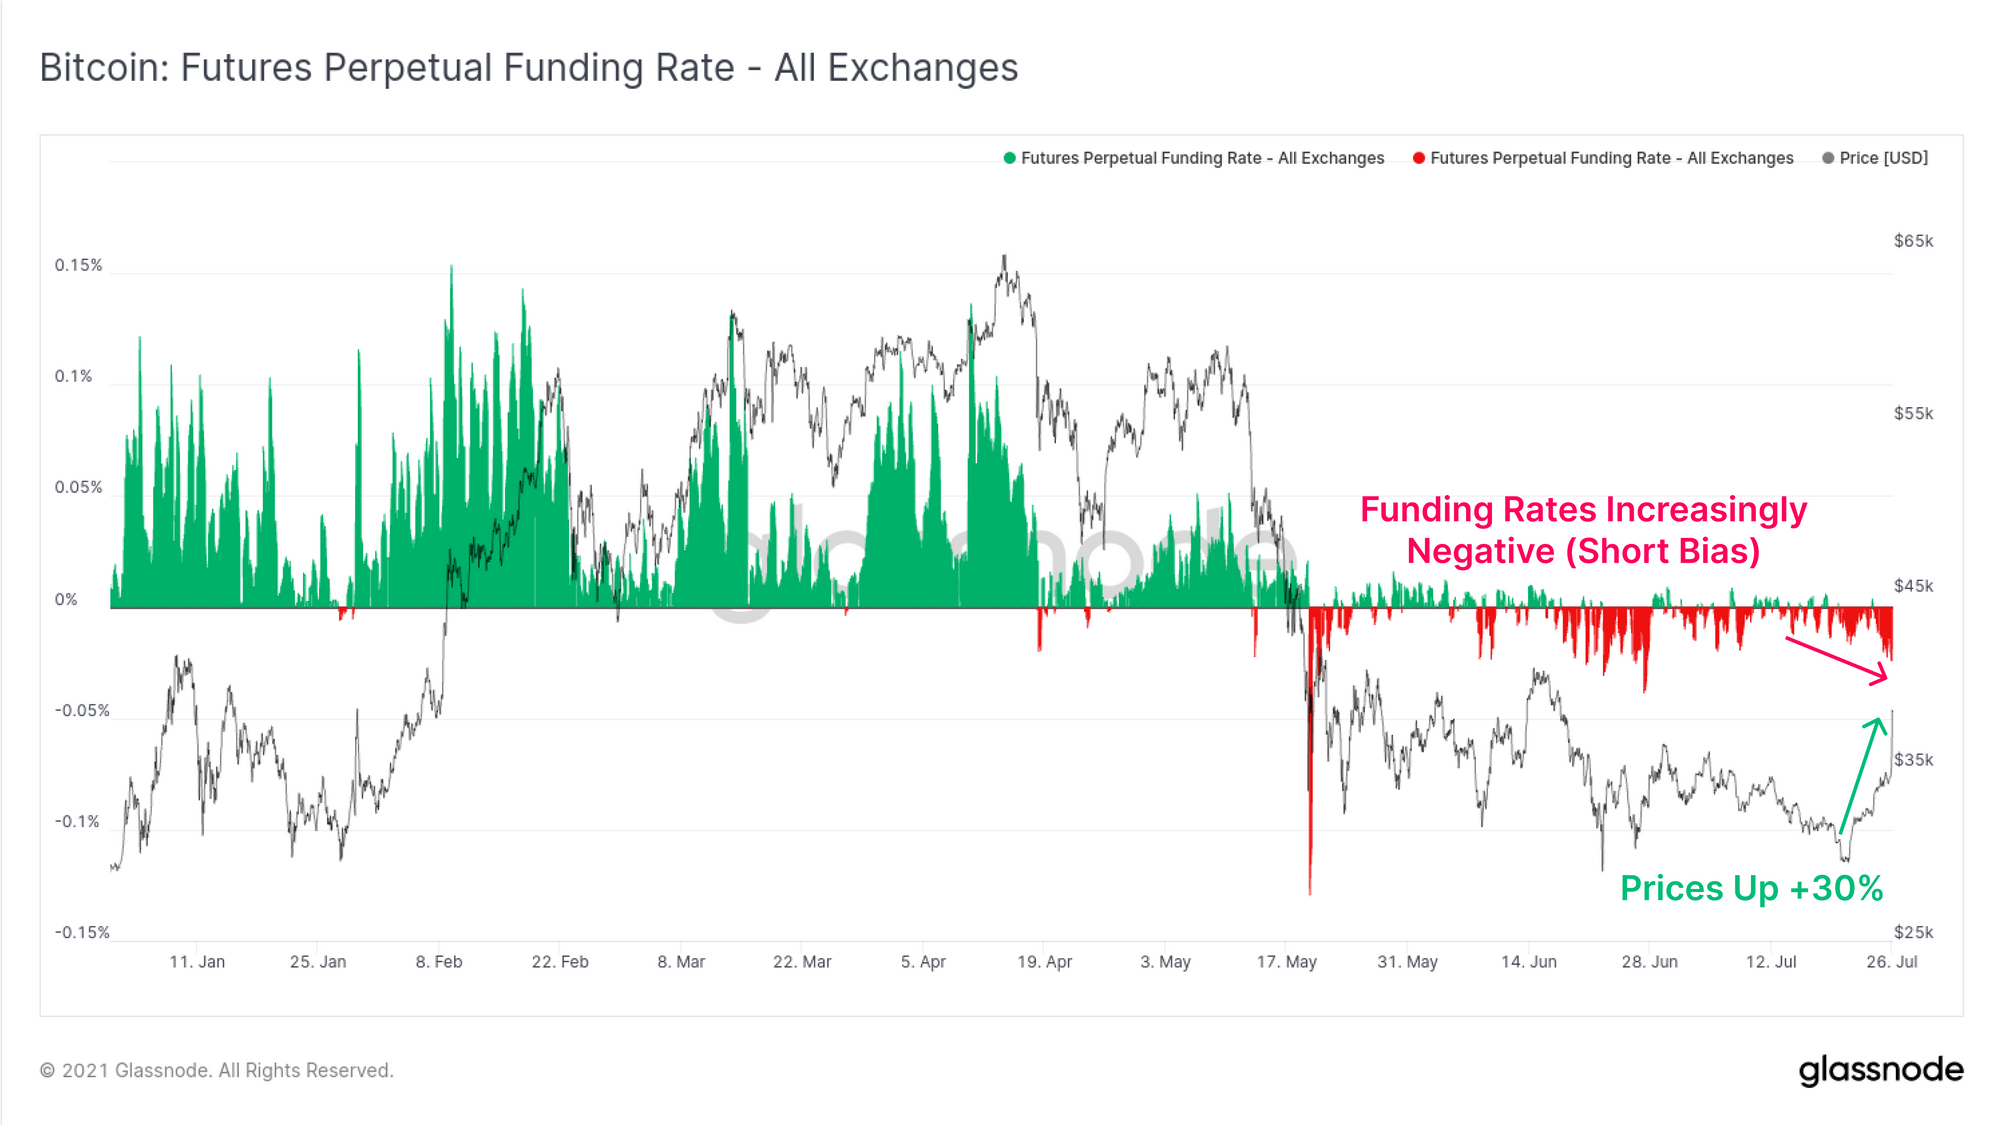
To assess the directional bias of futures markets, we can see that perpetual funding rates have continued to trade negative. This indicates the net bias remains short Bitcoin. This metric in particular helps us identify that Monday's price rally is likely associated with an overall short squeeze, with funding rates continuing to trade at even more negative levels despite price rallying +30%.
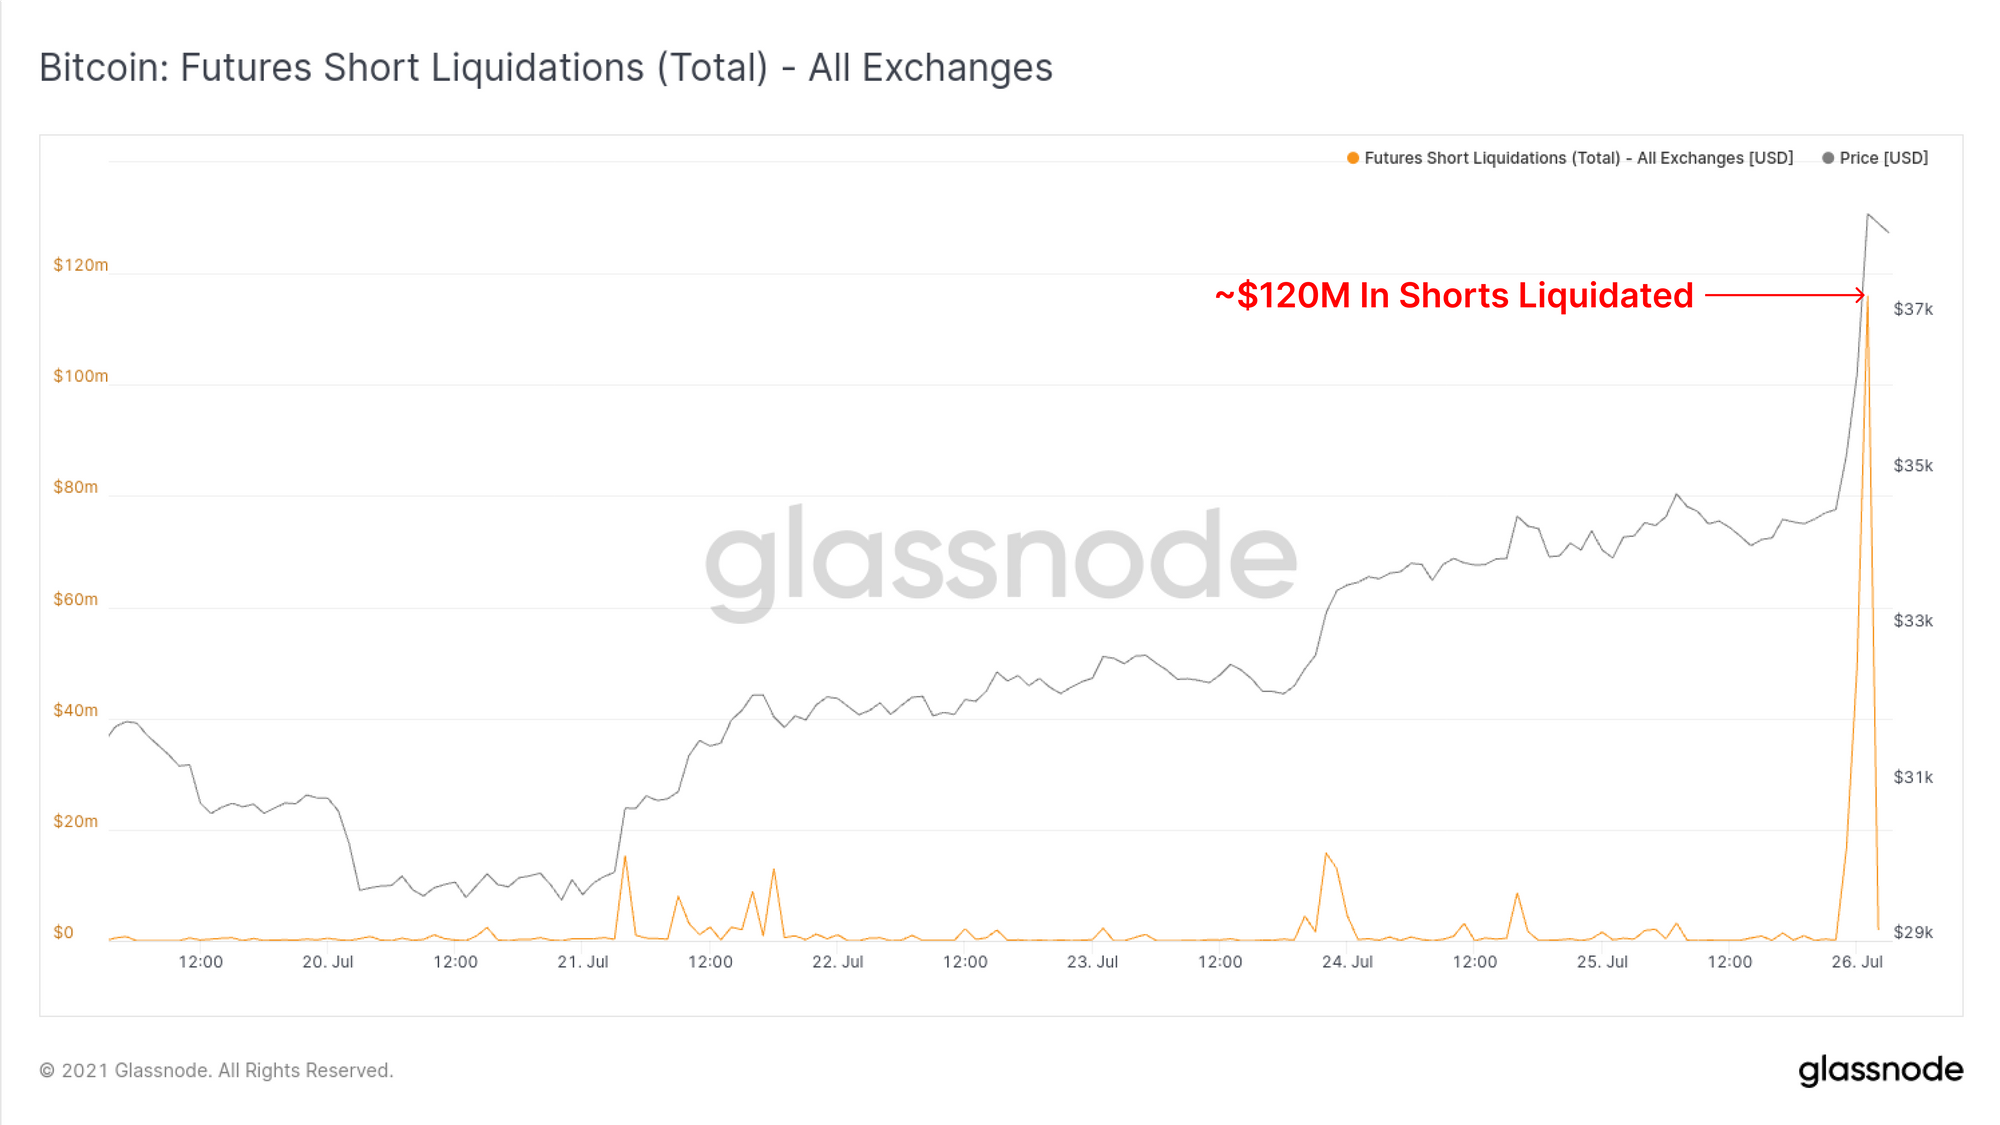
Indeed, during Monday's rally, almost $120M in shorts were liquidated in an hour, which largely confirms that a short squeeze as a primary driving force.
On-chain Activity Remains Quiet
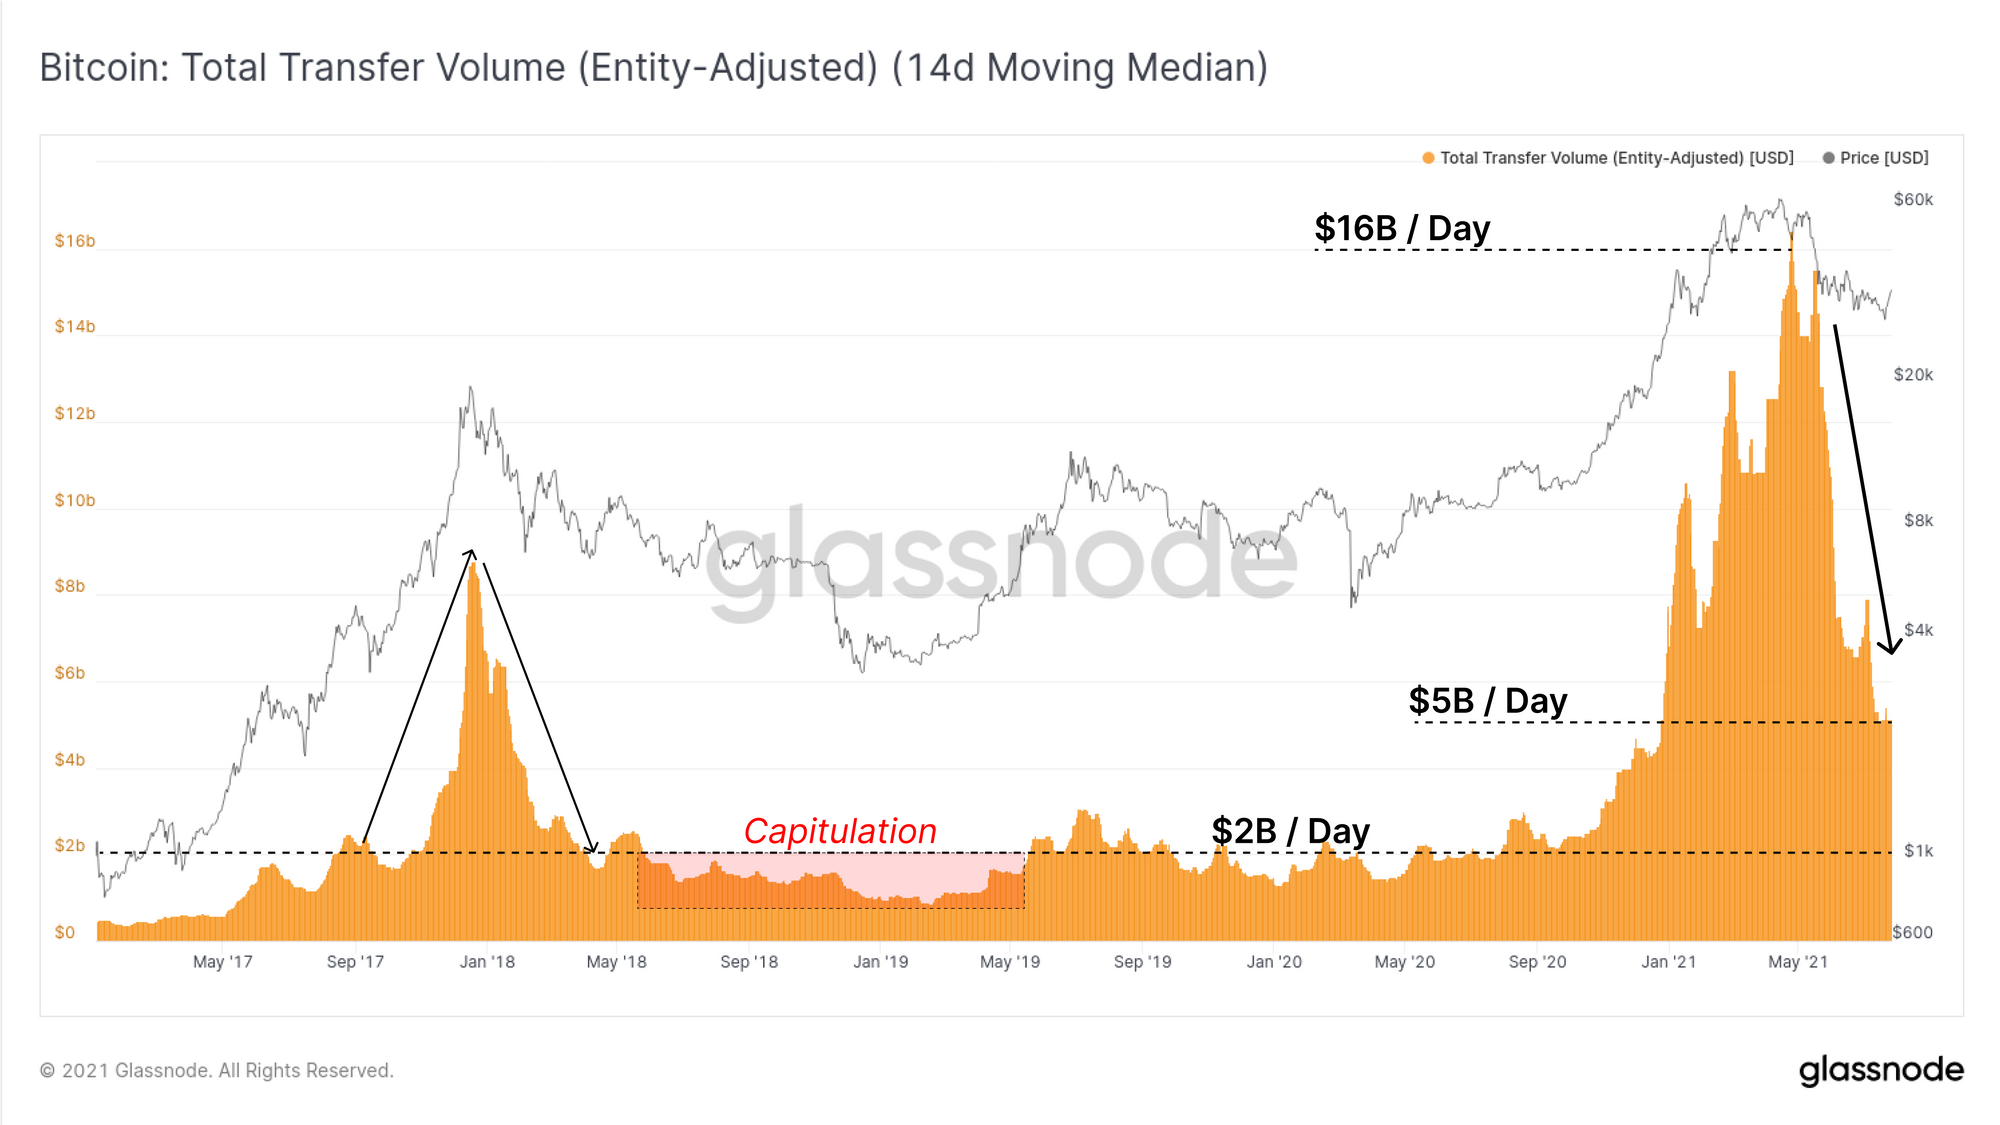
In direct contrast to the volatility in spot and derivatives markets, the transaction volume and on-chain activity remains extremely quiet. On a 14-day Median basis, the entity-adjusted transaction volume for Bitcoin remains depressed at around $5B per day. This remains a significant decline from the $16B/day prior to the May Sell-off.
However, volume has not yet collapsed to the same extent as the 2017 blow-off top, where network volume saw a full retrace, a subsequent bear market and eventually, a lengthy capitulation. It remains to be seen whether on-chain volumes start to pick up in response to recent volatile price-action.
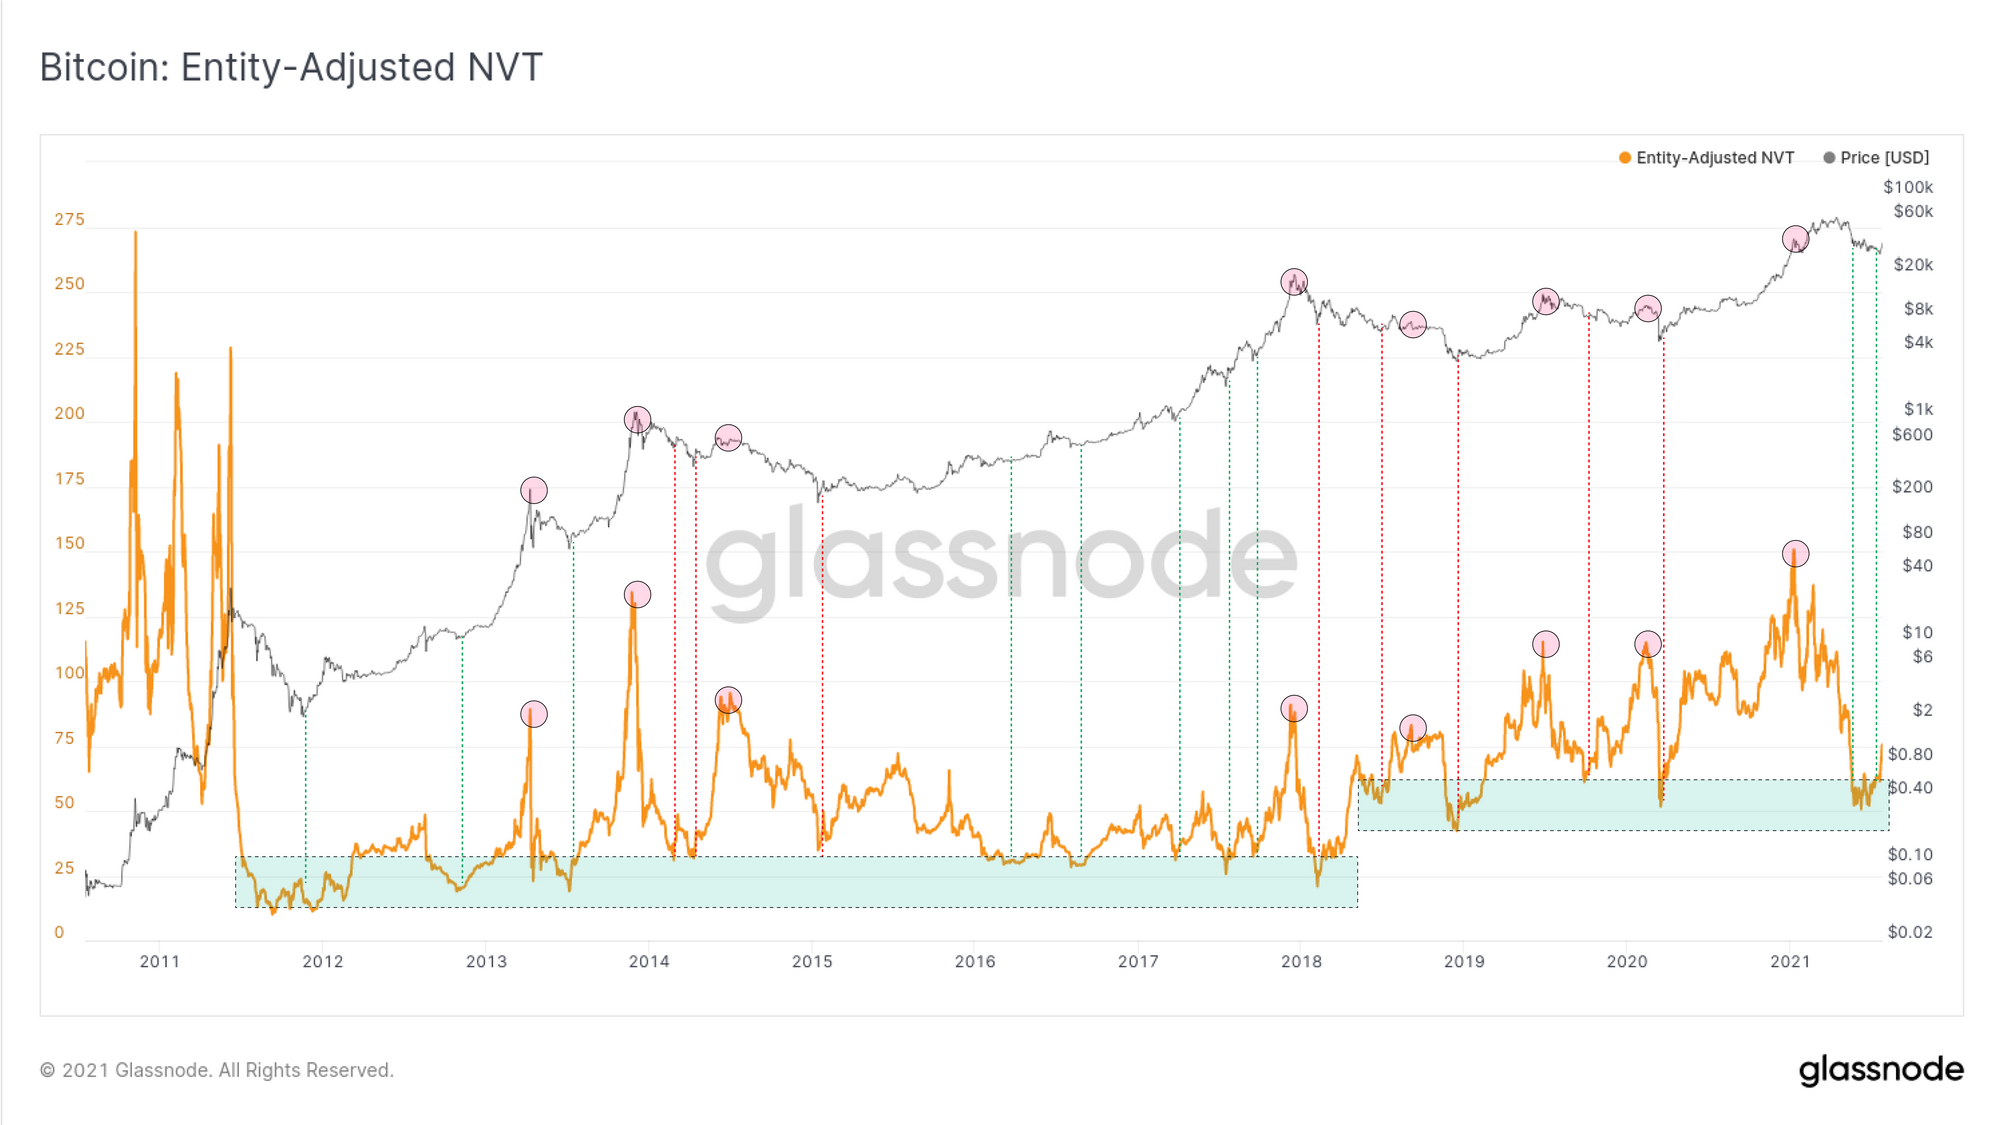
Despite on-chain transaction volumes falling, when compared to the network valuation (market cap) in the NVT Ratio, we can see an interesting fractal. Historically, very low values of NVT suggest the network is undervalued relative to the amount of transaction volume. Conversely, higher values, as seen back in Feb 2021 indicate transaction volumes are relatively low and may not justify the current market valuation.
As prices traded down to the lows of $29k at the start of the week, the EA-NVT suggested that the Bitcoin network was relatively oversold compared to on-chain settlement volumes. This short squeeze has now pushed the EA-NVT higher. If on-chain volumes do not rise in support of these elevated prices, it may suggest the rally lacks fundamental drivers and would be a sign for caution.
Note: both the on-chain volume and the NVT charts are shown as entity-adjusted. This filters for only economically meaningful transactions by removing self-spends, wallet management and other internal transfers.
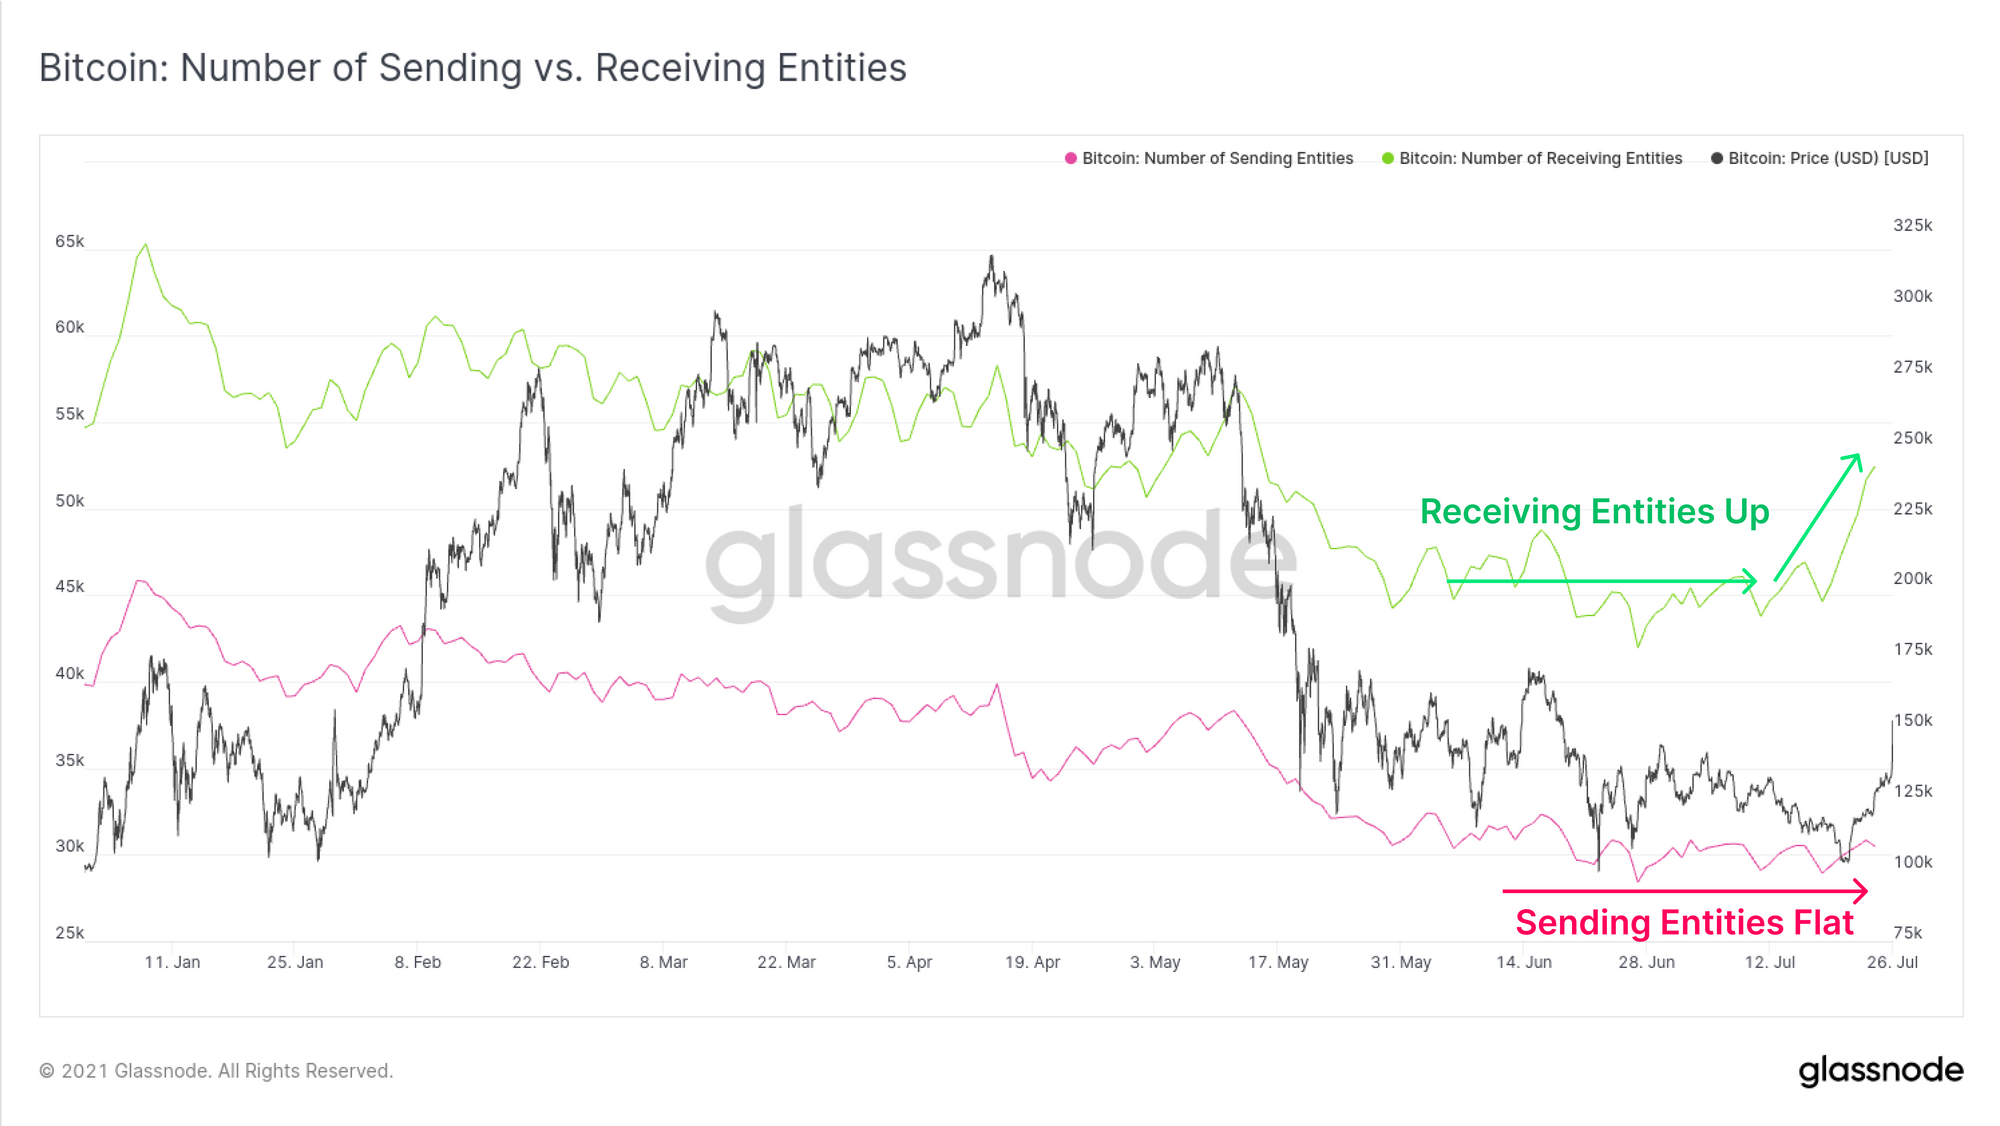
On the topic of entities, we can see a more constructive spike in receiving entities (those taking custody of coins) whilst sending entities (those spending coins) remains relatively flat. This is an early trend change and one that would indicate a more positive accumulation type environment if it persists. It highlights that of the volume that is transacting, a reasonable portion looks to be accumulation, and relatively little is entities exiting the network.
Overall, on-chain activity remains somewhat bearish and continues to be quiet. Perhaps utilisation of the Bitcoin network is lagging prices in this case. Ideally, renewed volatility and constructive price action sparks back demand for block-space. If not, it may suggest a more cautious framework is necessary in the weeks ahead.
Network Profitability
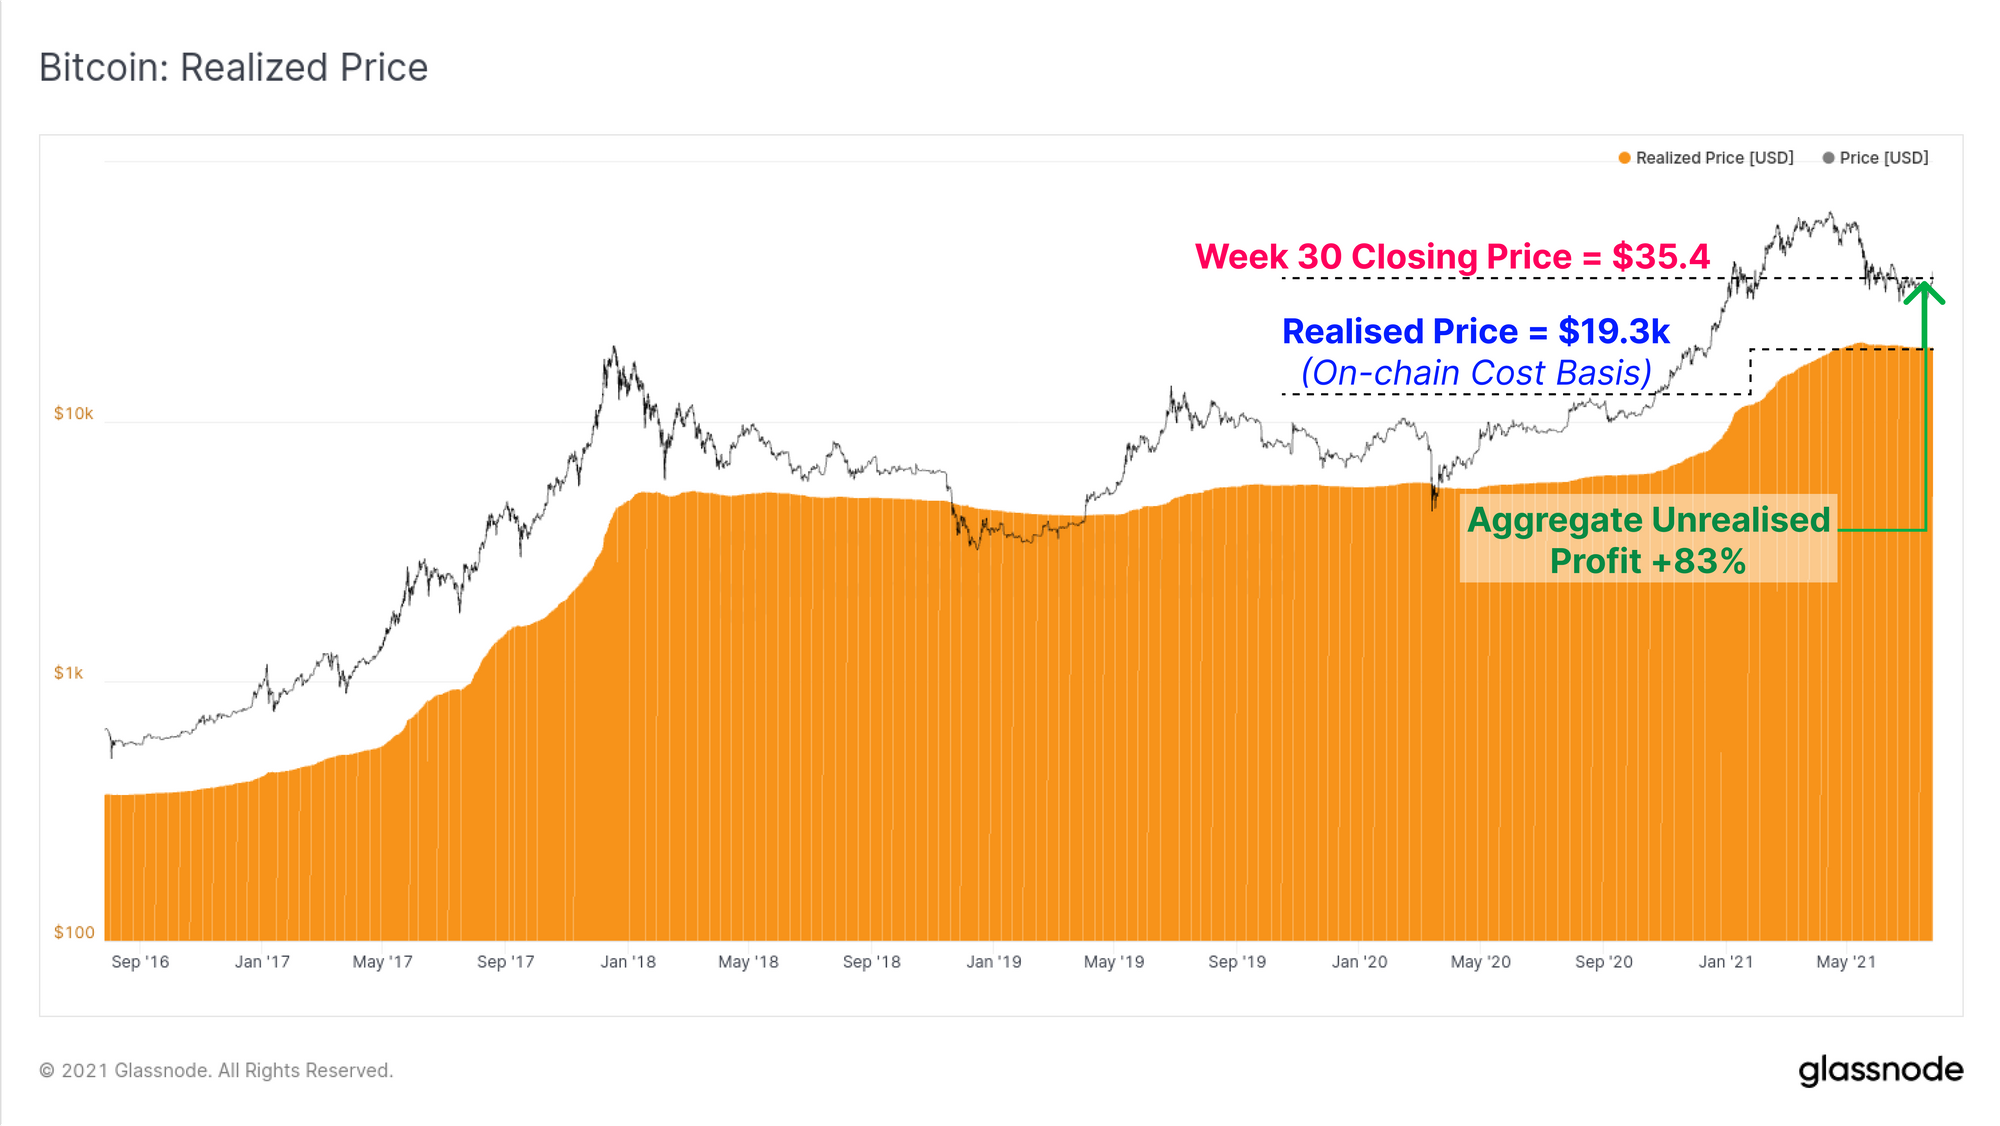
To close out our analysis for the week, we will assess the aggregate market profitability relative to the Realised Price. The Realised Price is one of the principle metrics underlying on-chain analysis. It is calculated by valuing all coins at the price when they were last moved, and thus represents the aggregate 'cost basis' for the circulating coin supply.
The Realised Price is currently trading at $19.3k, generally coincident with last cycles ATH. With this weeks closing price of $35.4k, it means the aggregate market currently holds an unrealised profit of around 83%.
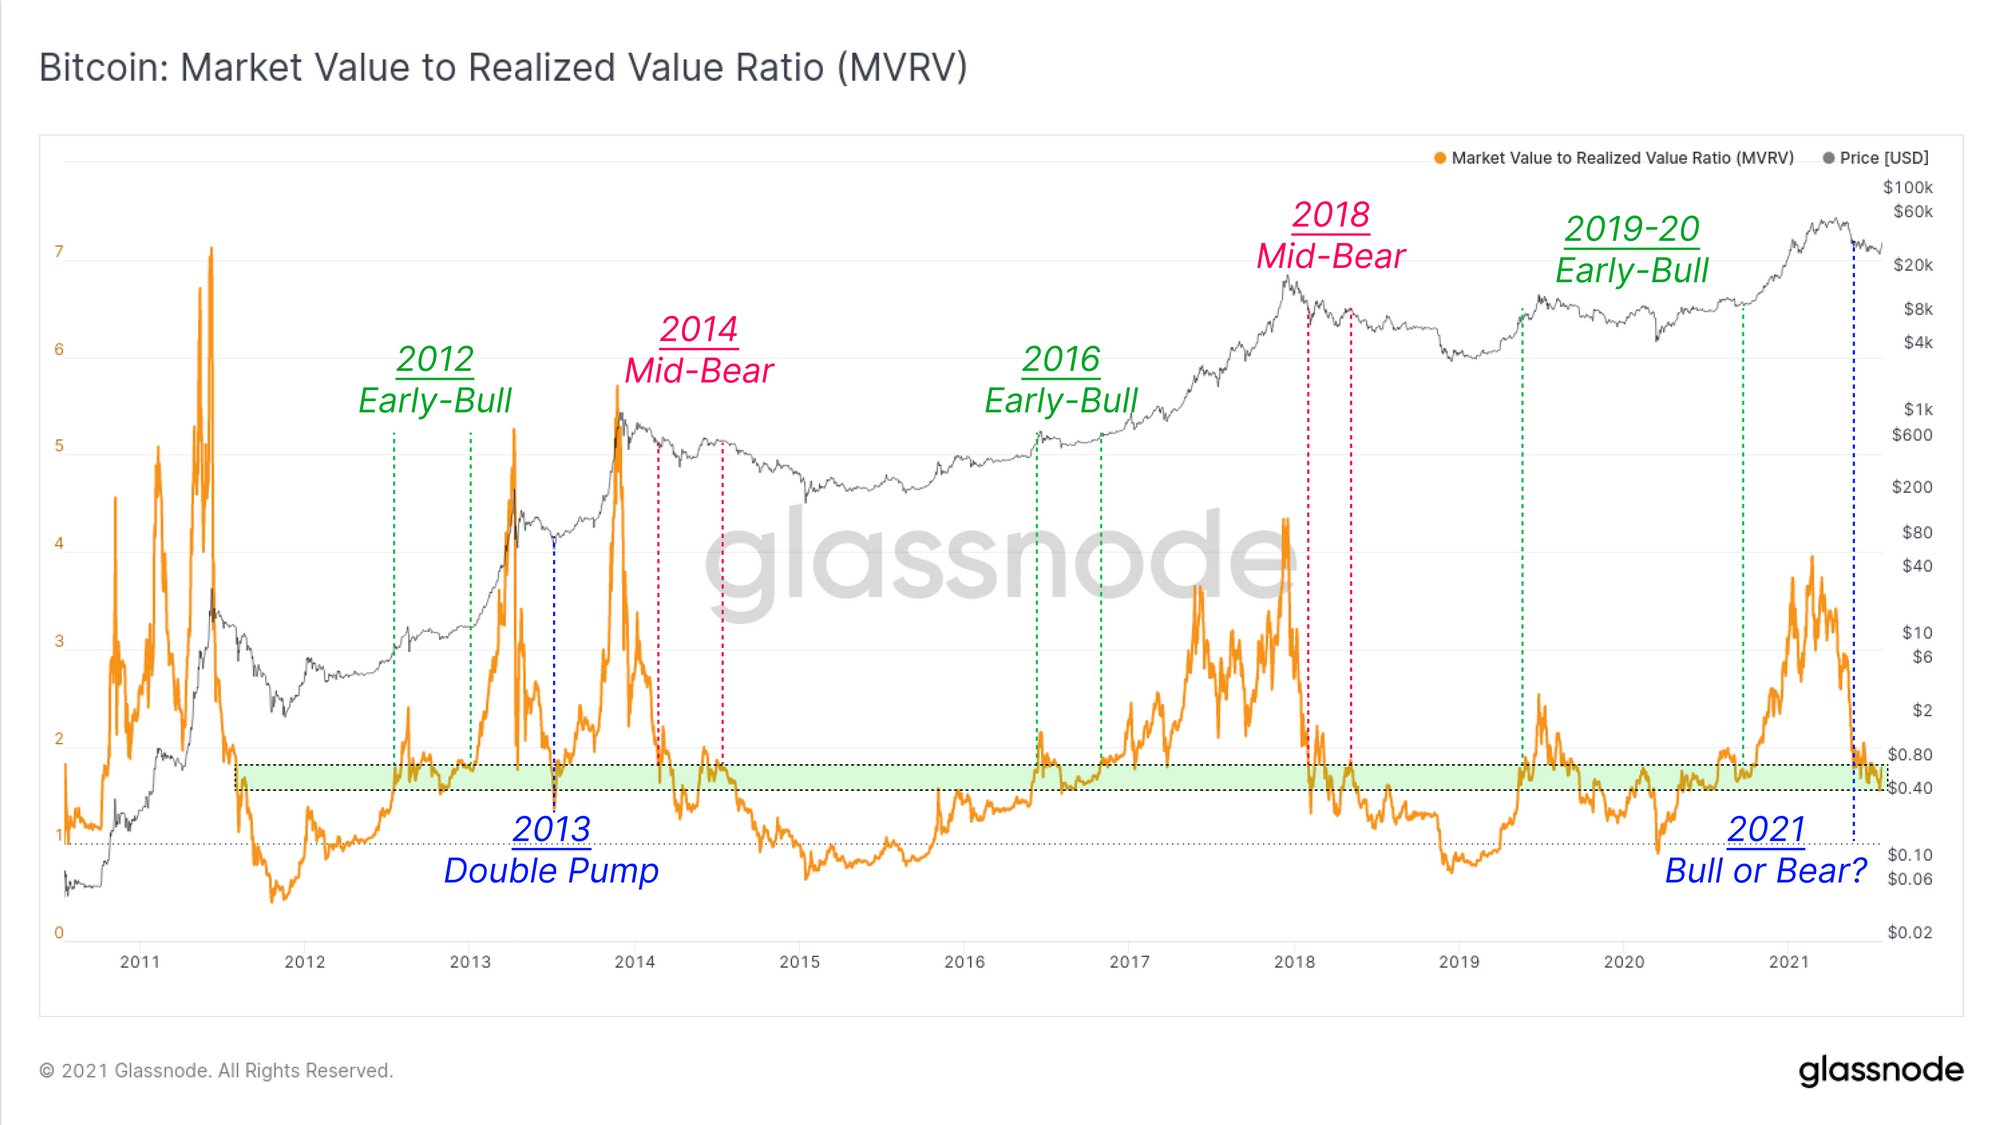
In the context of past market cycles, we can use the MVRV ratio to compare the market cap (spot valuation) to the realised cap (on-chain cost basis). Here we can see that the MVRV ratio is trading in a zone that is historically reached in three circumstances:
- Early-Bull cycle (3x) where prices have macro bottomed and smart money accumulators have returned to an appreciable profit level.
- Mid-Bear cycle (2x) where investors have seen their unrealised profits dramatically slashed following a cycle top, but before the ultimate capitulation.
- Double Pump (1x) in the 2013 market where the mid-cycle shake-out put enough investors off-side, before swiftly reverting into a powerful blow-off top.
At this stage, it remains to be seen whether the market can turn the macro trend around and confirm a resumption of the bull market. If so, it would resemble the 2013 'double pump' market. If not, the probability of being a mid-Bear fractal may increase.
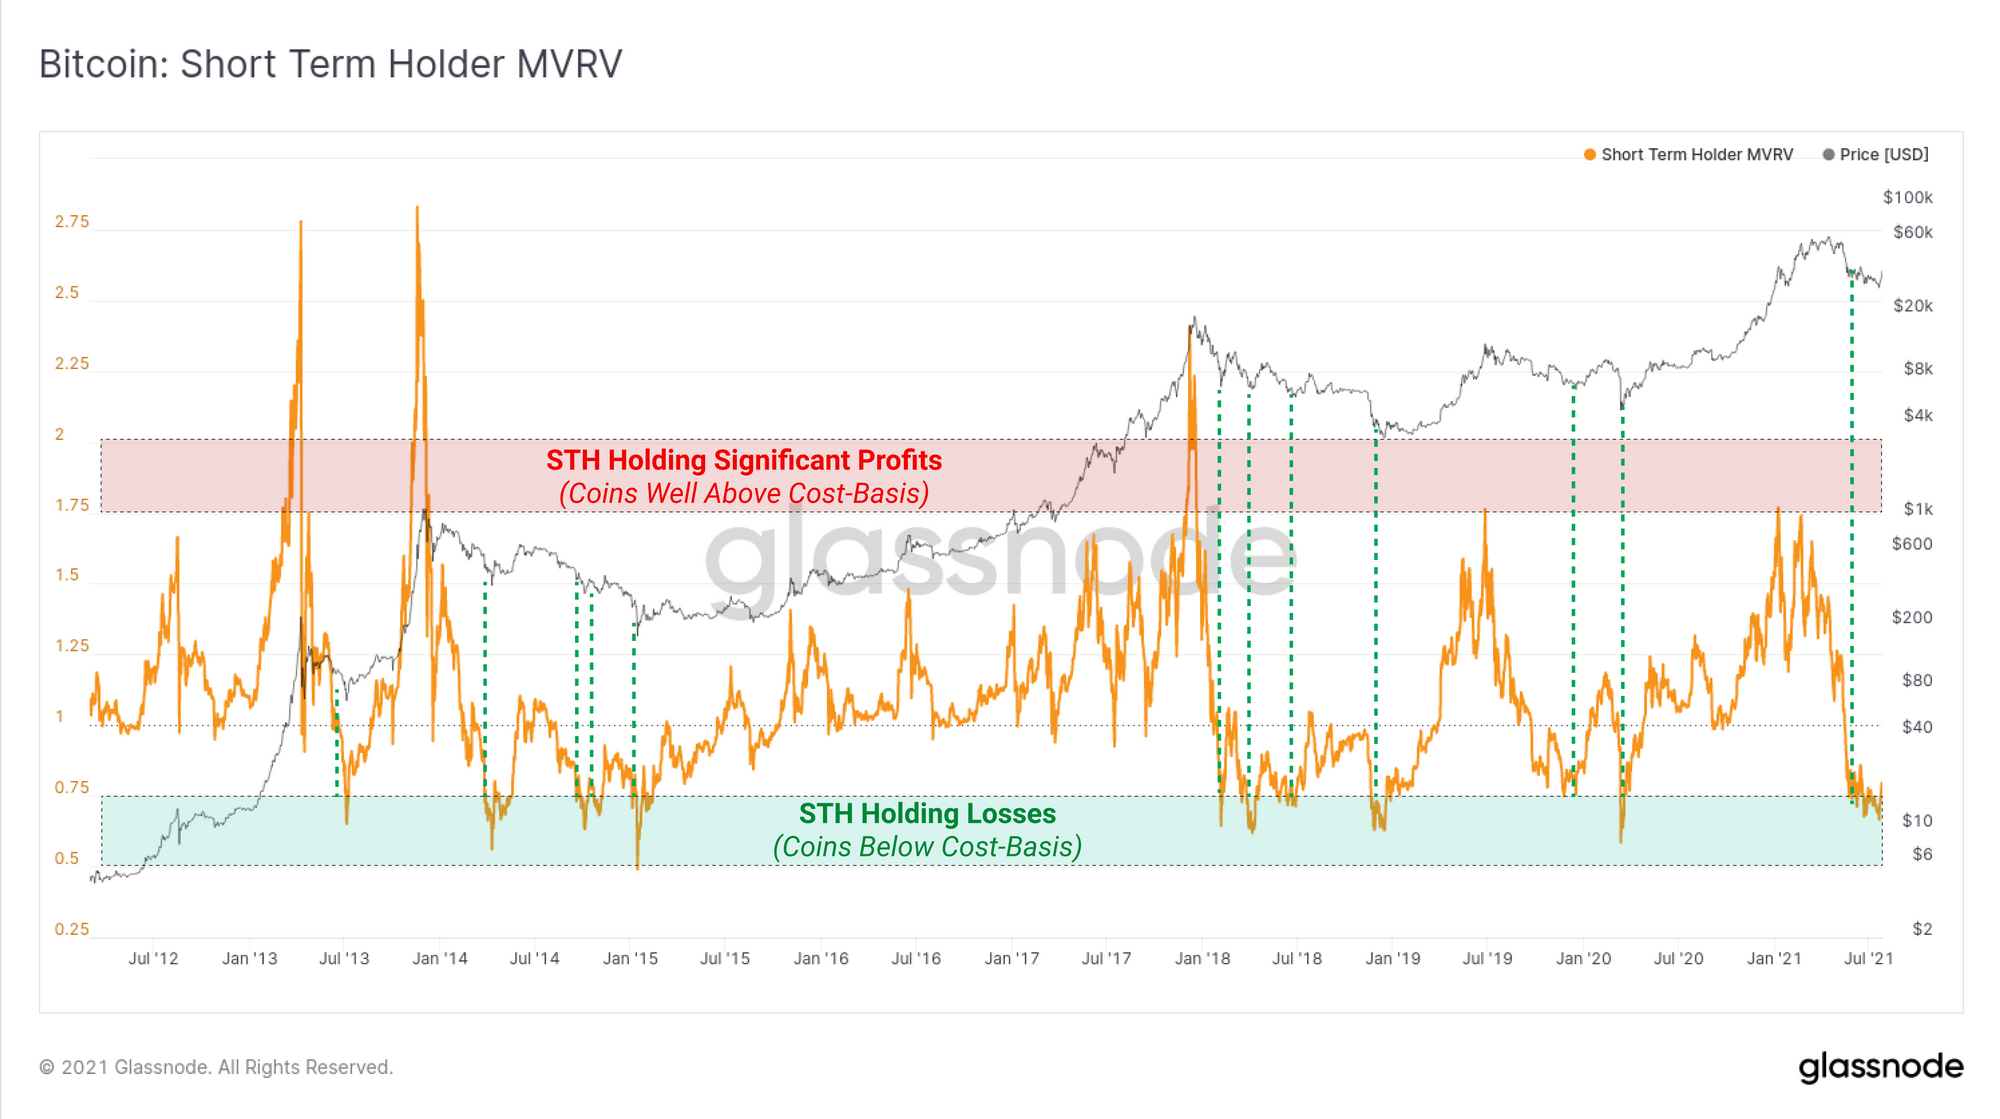
Looking at the MVRV for the short-term holder (STH) cohort, we can see that they are currently holding coins at a significant unrealised loss. The STH-MVRV rarely trades at such oversold conditions with almost all historical instances being followed by significant price rallies. That said, these fractals typically only occur in Bear Markets, noting that this includes the final capitulation event which starts a macro bull.
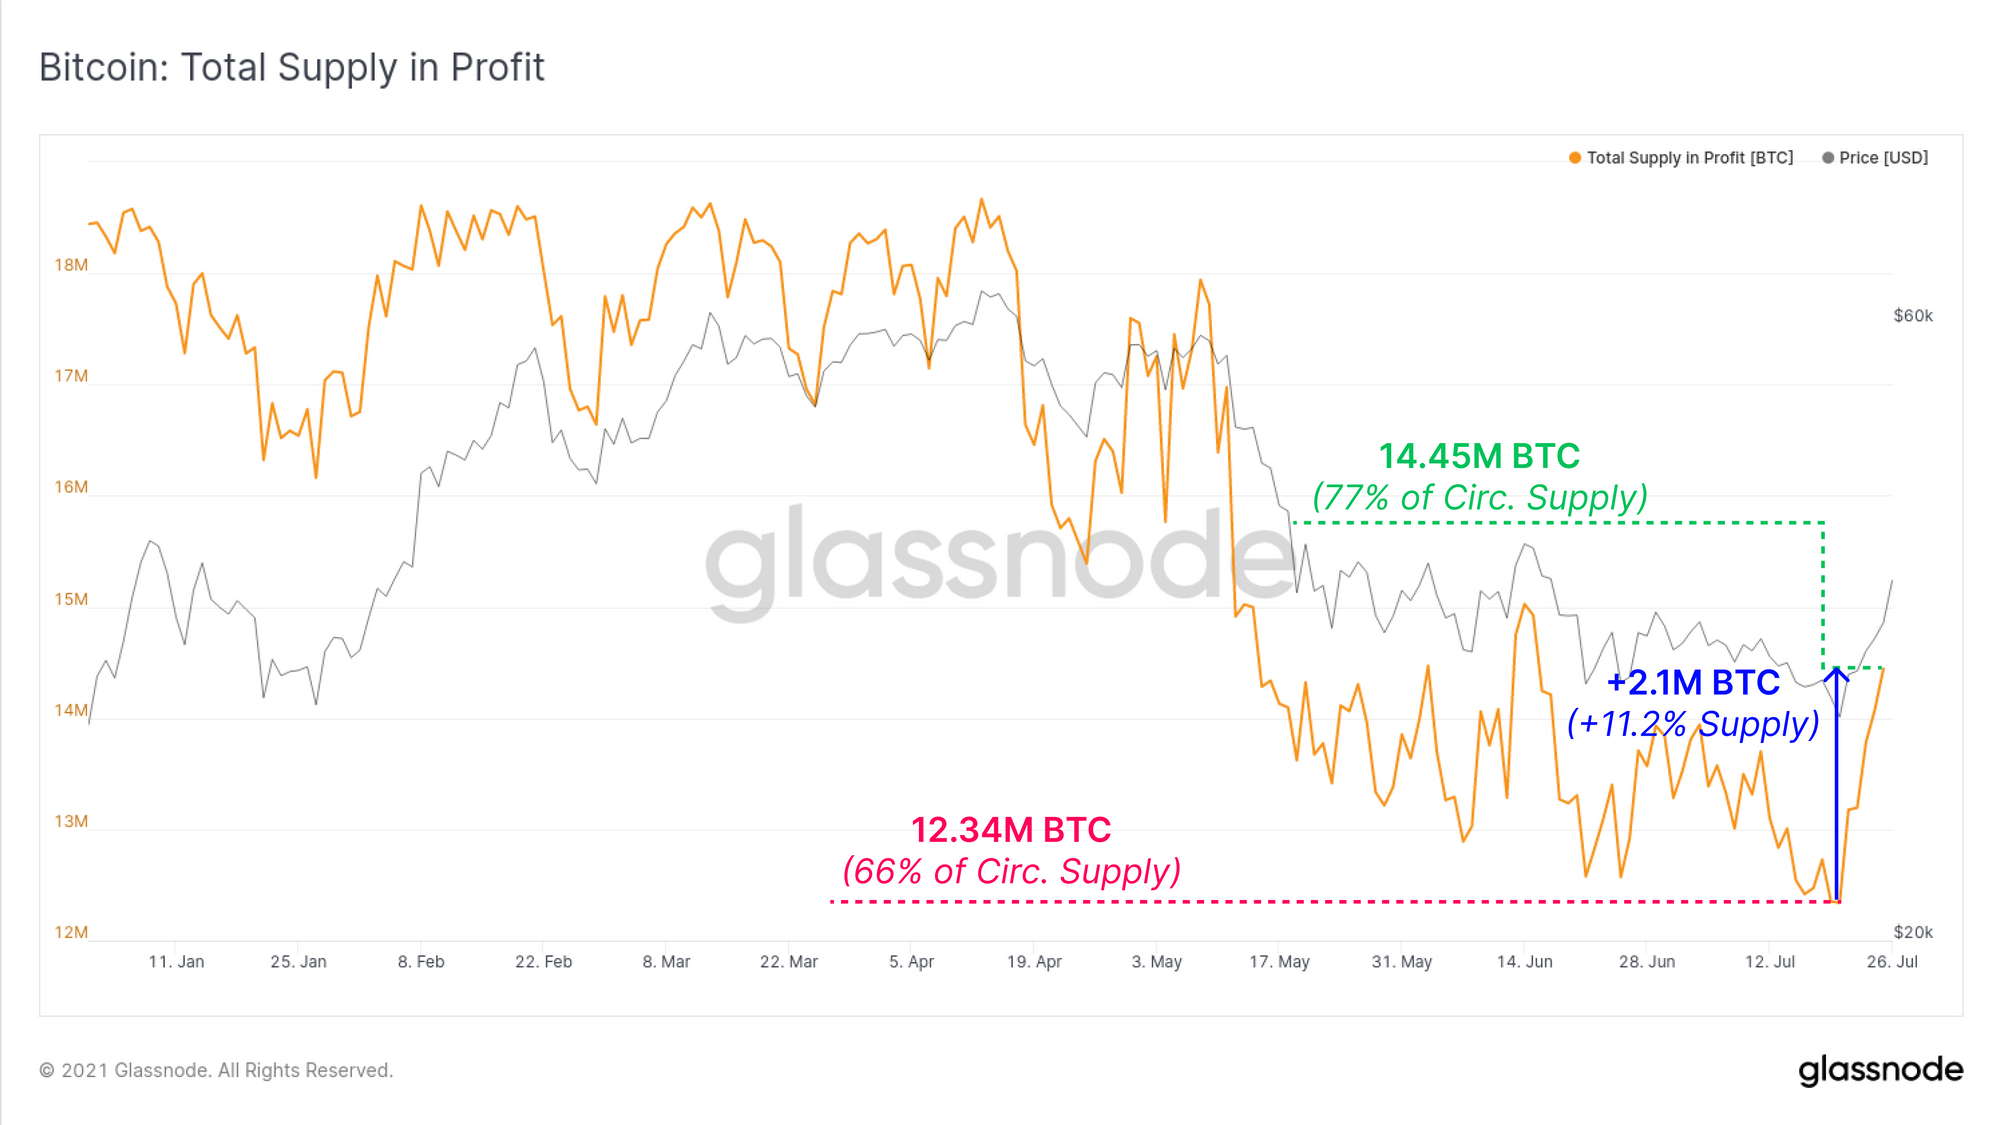
We can also investigate the volume of supply that has returned to profitability during the short squeeze. This provides us with an estimate of coin volume that has an on-chain cost basis in the $29k to $38k consolidation range. From the weekly low ($29k) to the short squeeze high ($38.4k at the time of writing) over 2.1M BTC has returned to profitability. This represents a volume equivalent to 11.2% of the circulating supply.
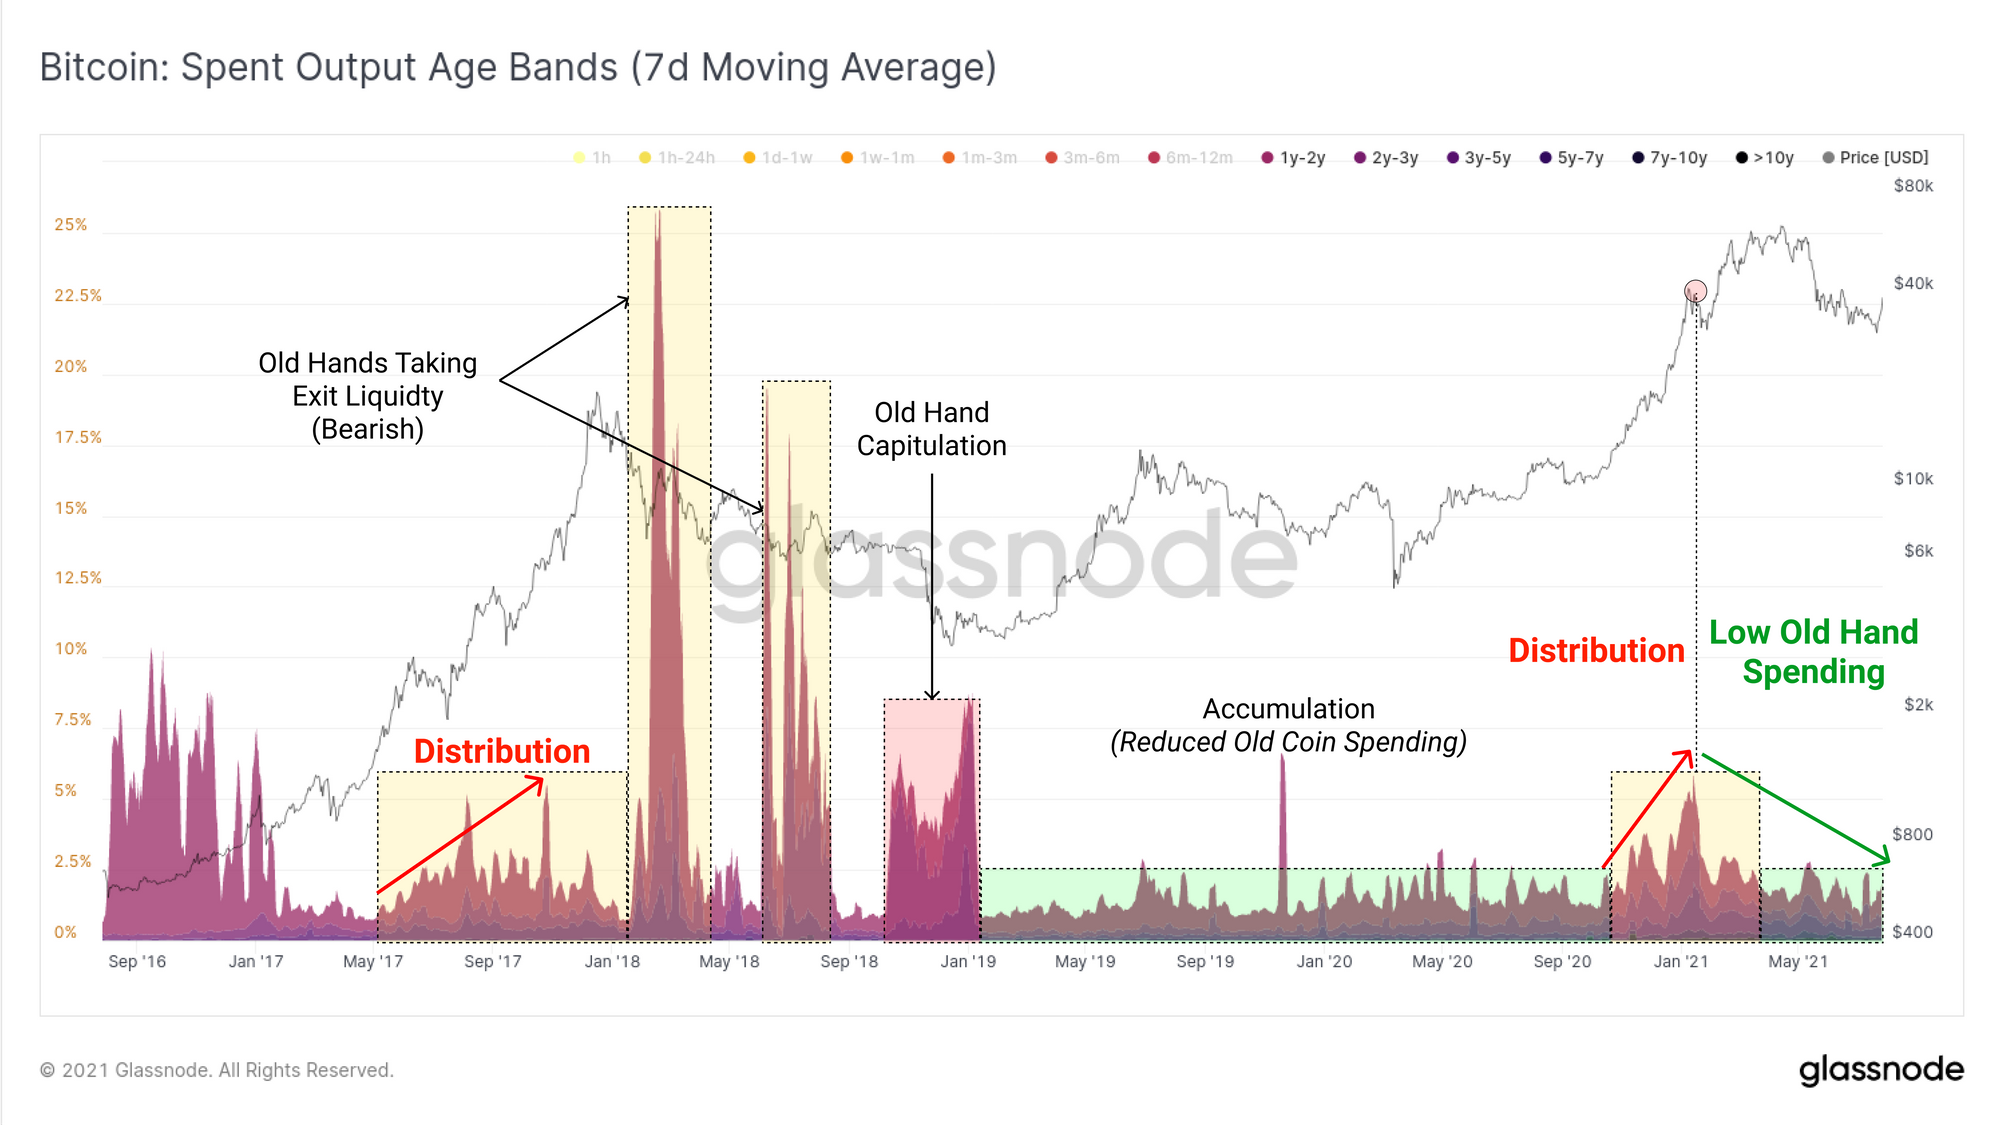
Finally, we review whether there are any signs of older profitable coins being spent on-chain to take advantage of market strength for exit liquidity. What would be relatively bearish is to see a significant increase in older coins (>1yr) spending during this relief rally as was seen in 2018 after the blow-off top.
So far, we have not seen such behaviour. If general dormancy of older coins persists, it would suggest conviction to HODL remains relatively strong and favour a more constructive view on market structure moving forwards. Conversely, the spending of older coins en mass would indicate a flush of illiquid coins are returning to liquid supply and a more bearish outlook ahead.
Week On-chain Dashboard
The Week On-chain Newsletter now has a live dashboard for all featured charts