The Week On-chain (Week 34, 2021)
Bitcoin has continued to rally to new multi-month highs despite an uptick in distribution, spending by older coins, and a divergence in on-chain activity.


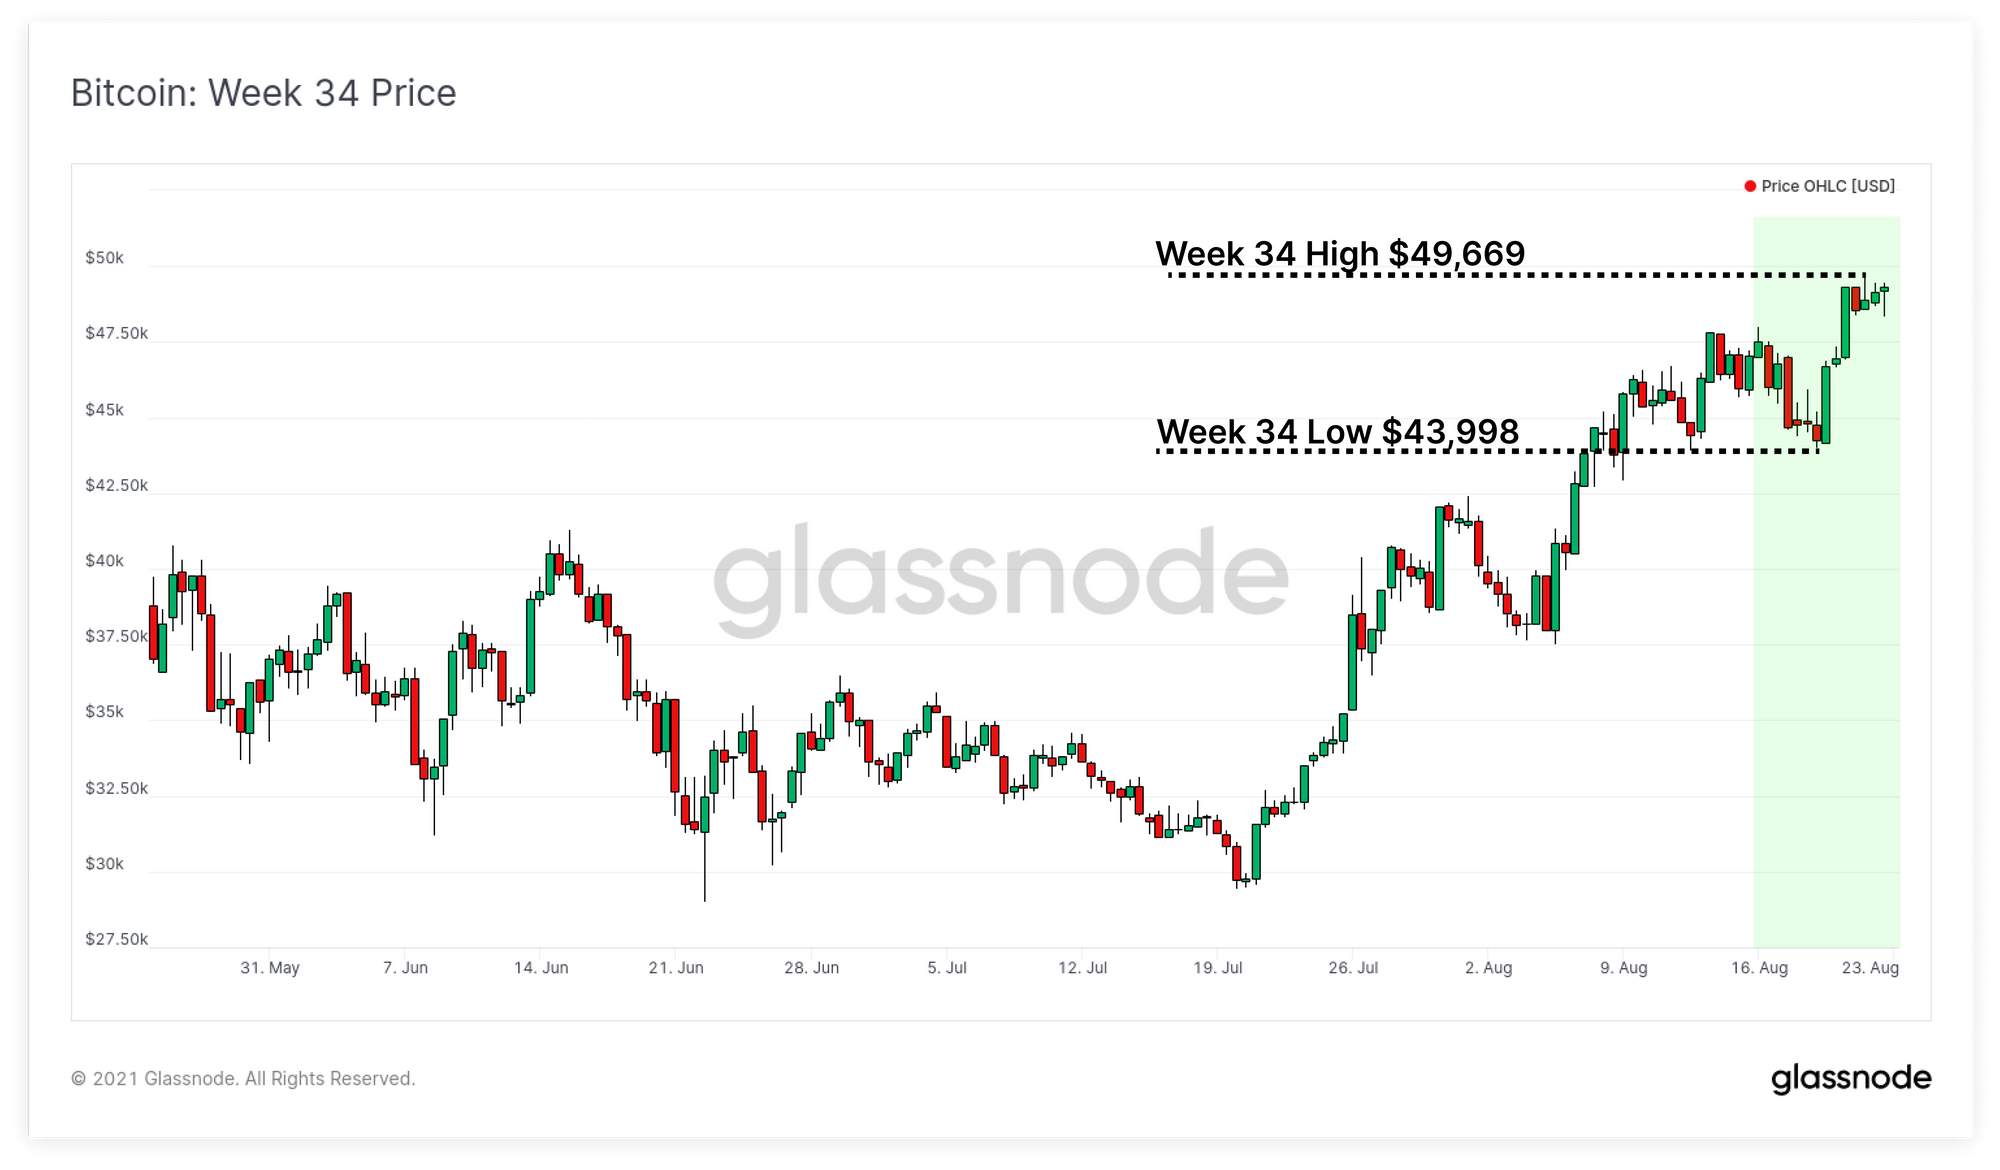
The Bitcoin market has experienced yet another strong week, with prices rallying from the weekly low of $43,998 to a new multi-month high of $49,669. Confidence, conviction and positive sentiment has followed this uplift in prices, as Bitcoin climbs closer to reclaiming its Trillion dollar valuation. The key level to break is $53k for Bitcoin to return to the 12-zero's club.
This week has seen some minor profit realisation on-chain by long term holders, although so far it does not appear to be of significant coin volume to put the brakes on. In this edition of the newsletter, we will assess both the state of on-chain activity as well as characterise the current spending behaviour of investors.
Open Interest Escalates
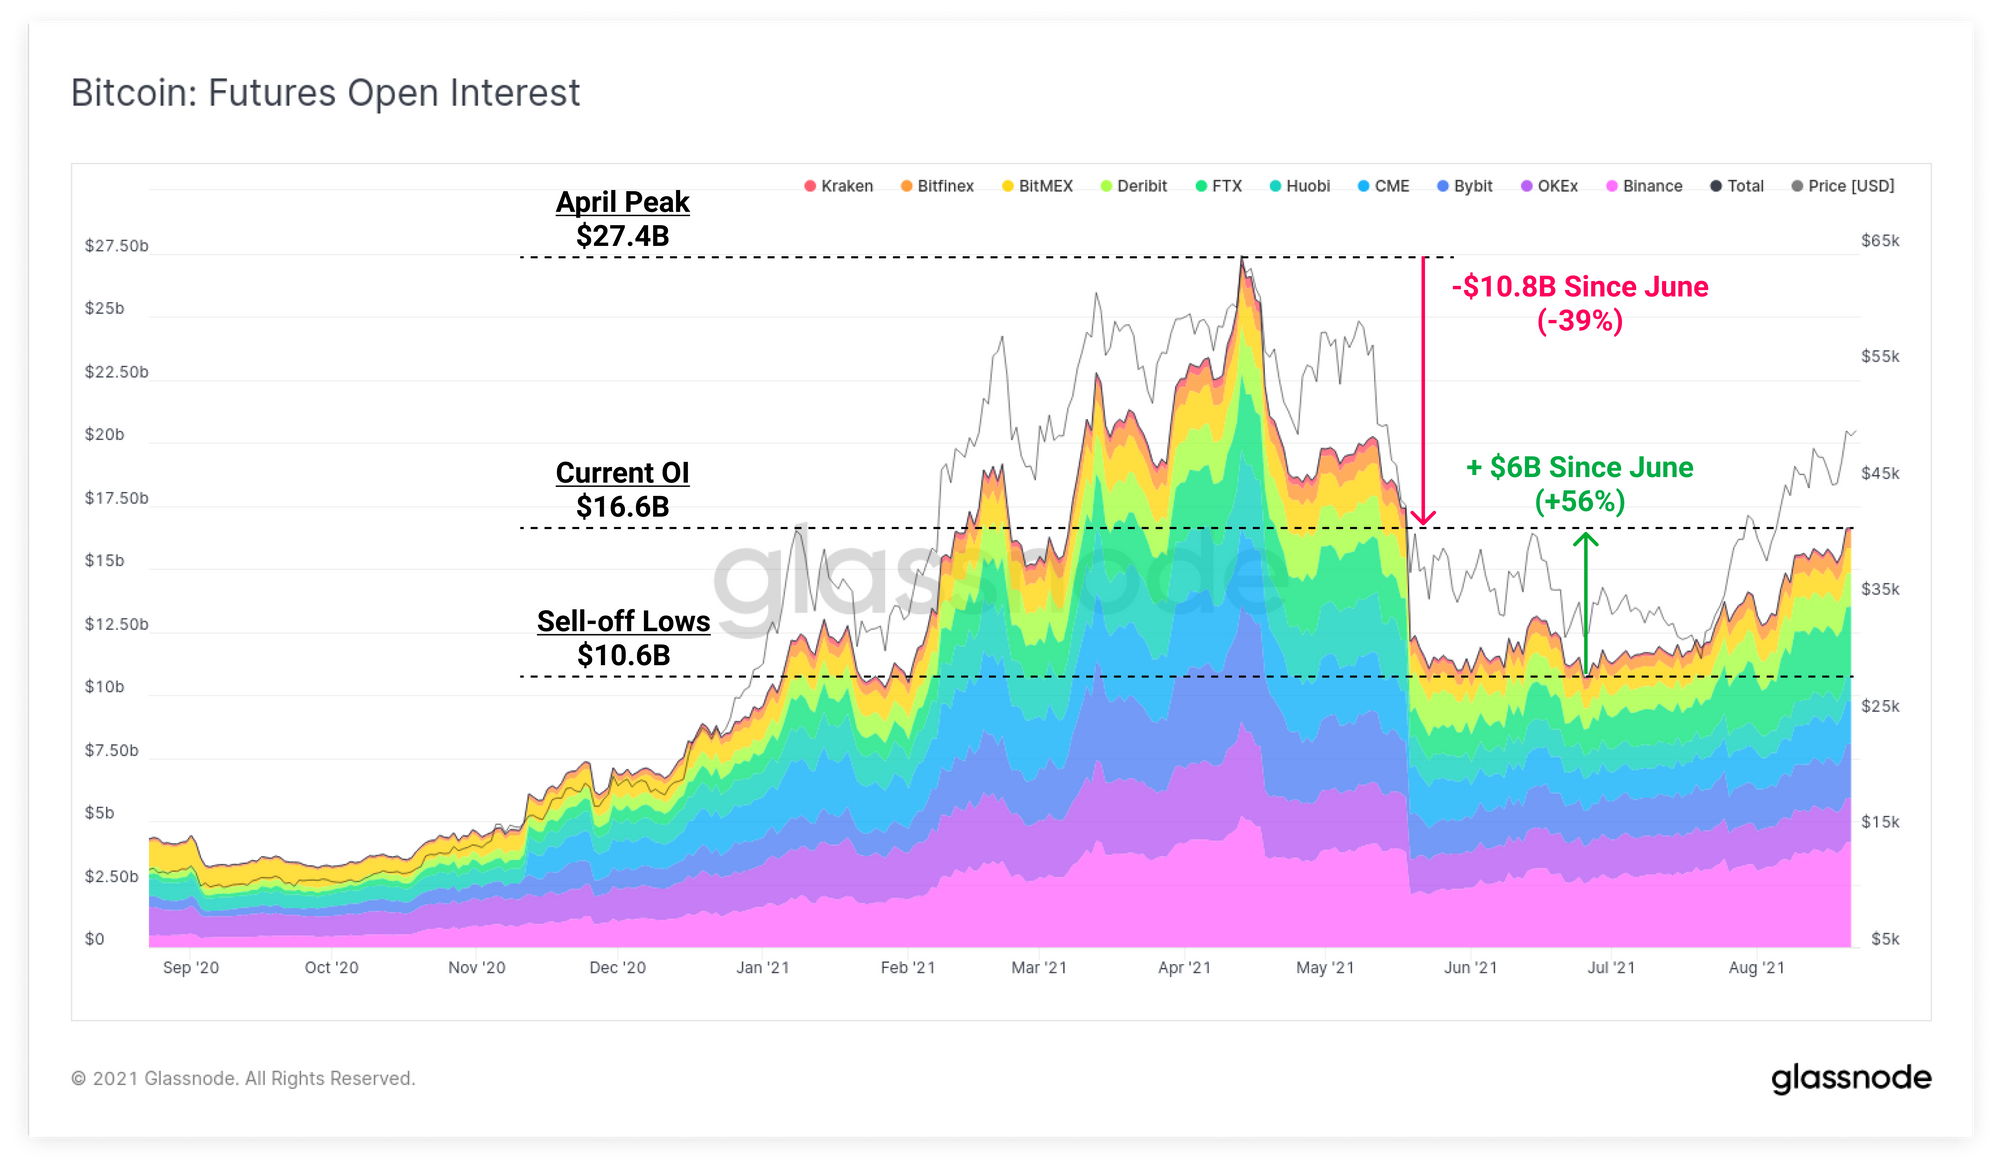
In derivatives markets, open interest for both Futures and Options has climbed alongside price to reach new local highs. After the precipitous fall from the $27.4B ATH during the May sell-off, open interest in Bitcoin futures markets has risen by $6B (+56%) from the lows of the recent consolidation. This week in particular, saw an increase of $1B in futures contracts opened as traders begin to take on more leverage.
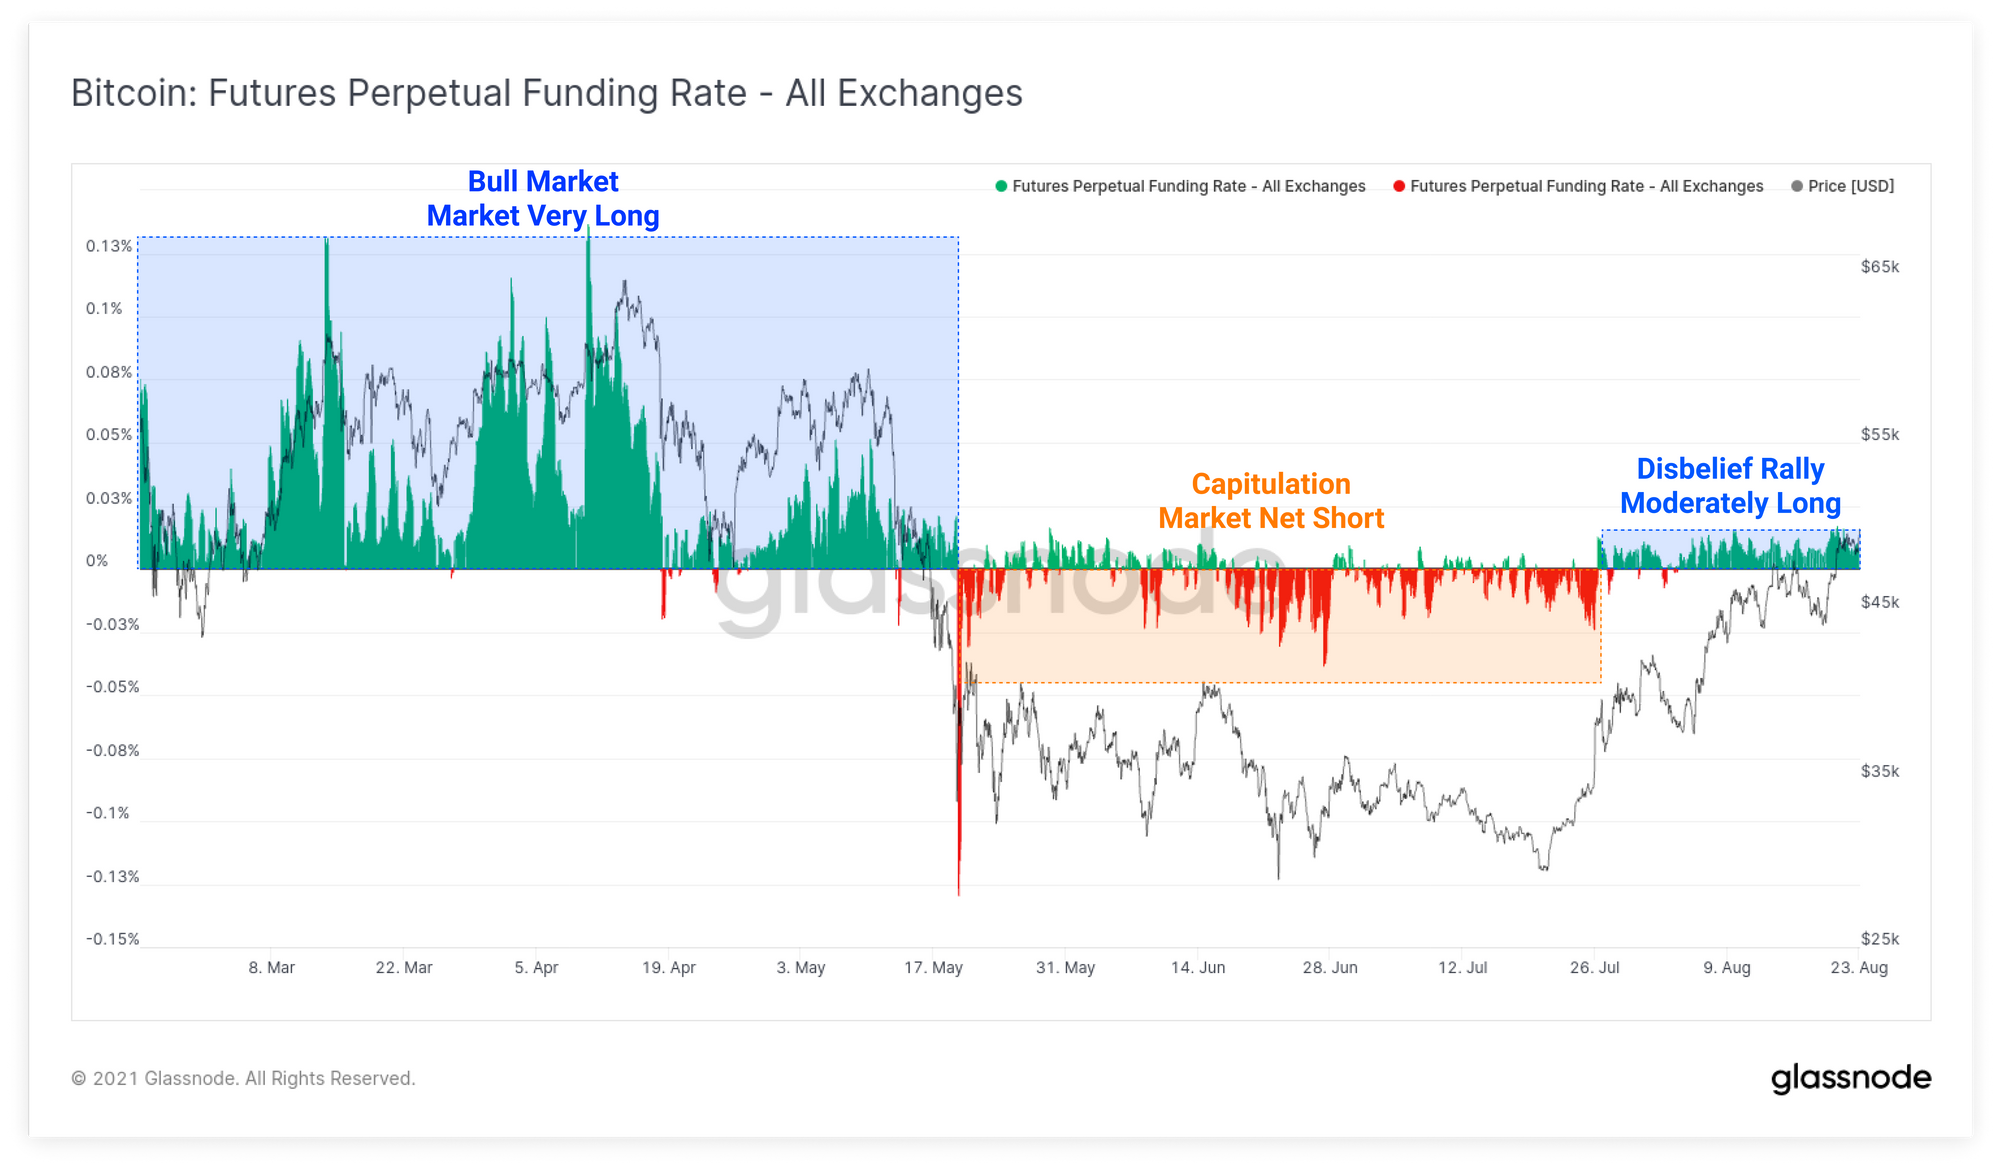
In terms of directional bias for traders, the perpetual futures funding rate has a moderate lean to the long side. Funding rates have traded positive since late July as futures markets trade above spot prices. However, the magnitude of funding is nowhere near the peaks seen in the Q1-Q2 bullish trend. This may indicate that excessive leverage is not in play just yet, and perhaps the uptrend remains reasonably spot driven and healthy.
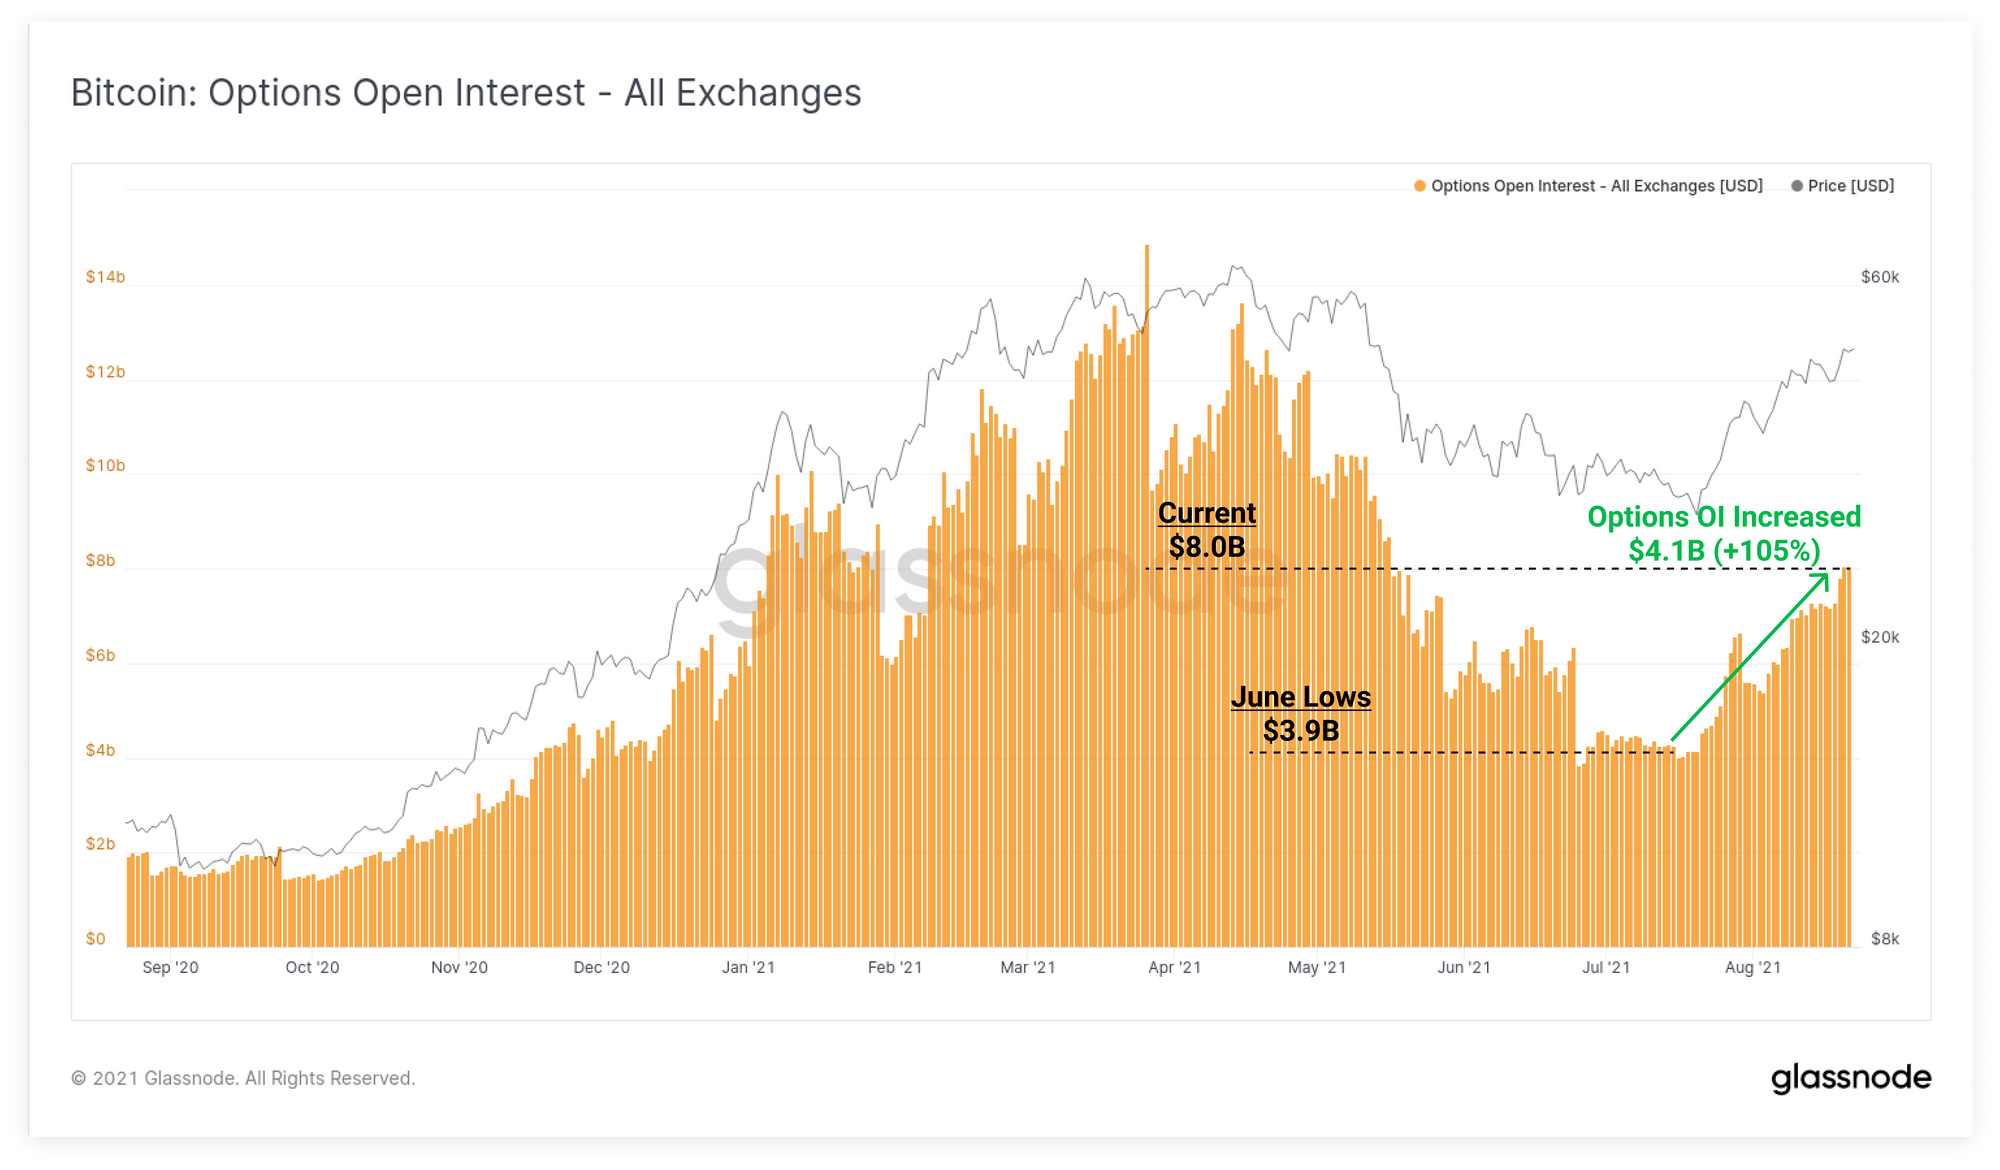
Options markets have also seen multi-month highs in open interest, rising by over $4.1B (+105%) since the lows set in June. The current level of $8.0B in open contracts is similar to levels seen during the May sell-off, and in Jan-Feb 2021. Note that prices were lower, trading around $30k to $40k, in both of these previous instances.
This too suggests that relative to the total market size, the degree of open interest in derivatives markets is relatively low compared to the degree of leverage seen in the first half of the year.
Week On-chain Dashboard
The Week On-chain Newsletter now has a live dashboard for all featured charts here. We have also started production for Week On-chain video analysis to provide a deeper dive into the thesis and logic behind each weeks analysis. Visit and subscribe to our YouTube channel, and visit our Video Portal to see our video content.

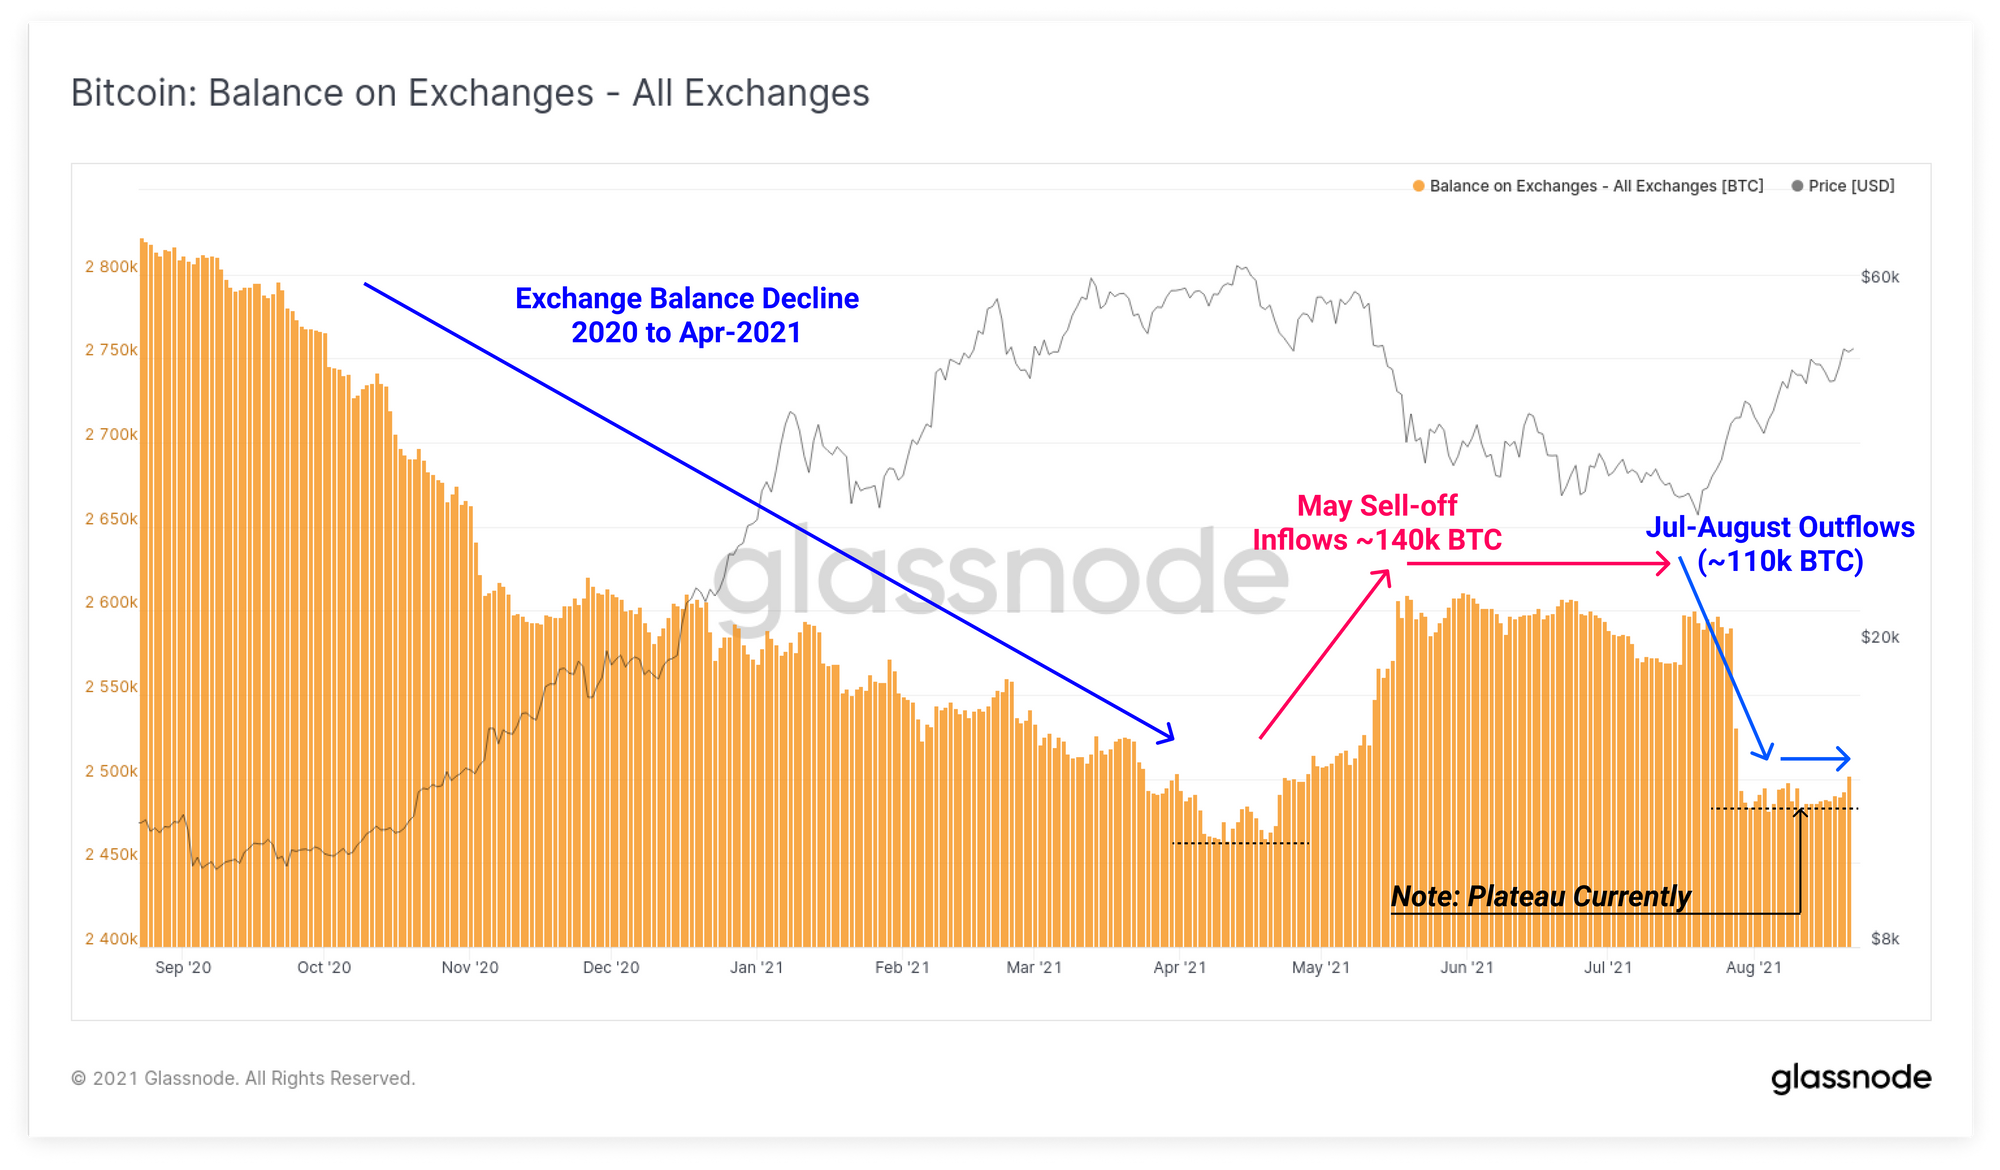
Exchange Balances Plateau
This week we have seen signals on-chain that some investors, particularly those with older UTXOs, have been spending coins. This week saw a very slight uptick in BTC held on exchanges which follows a month long plateau in coin balances.
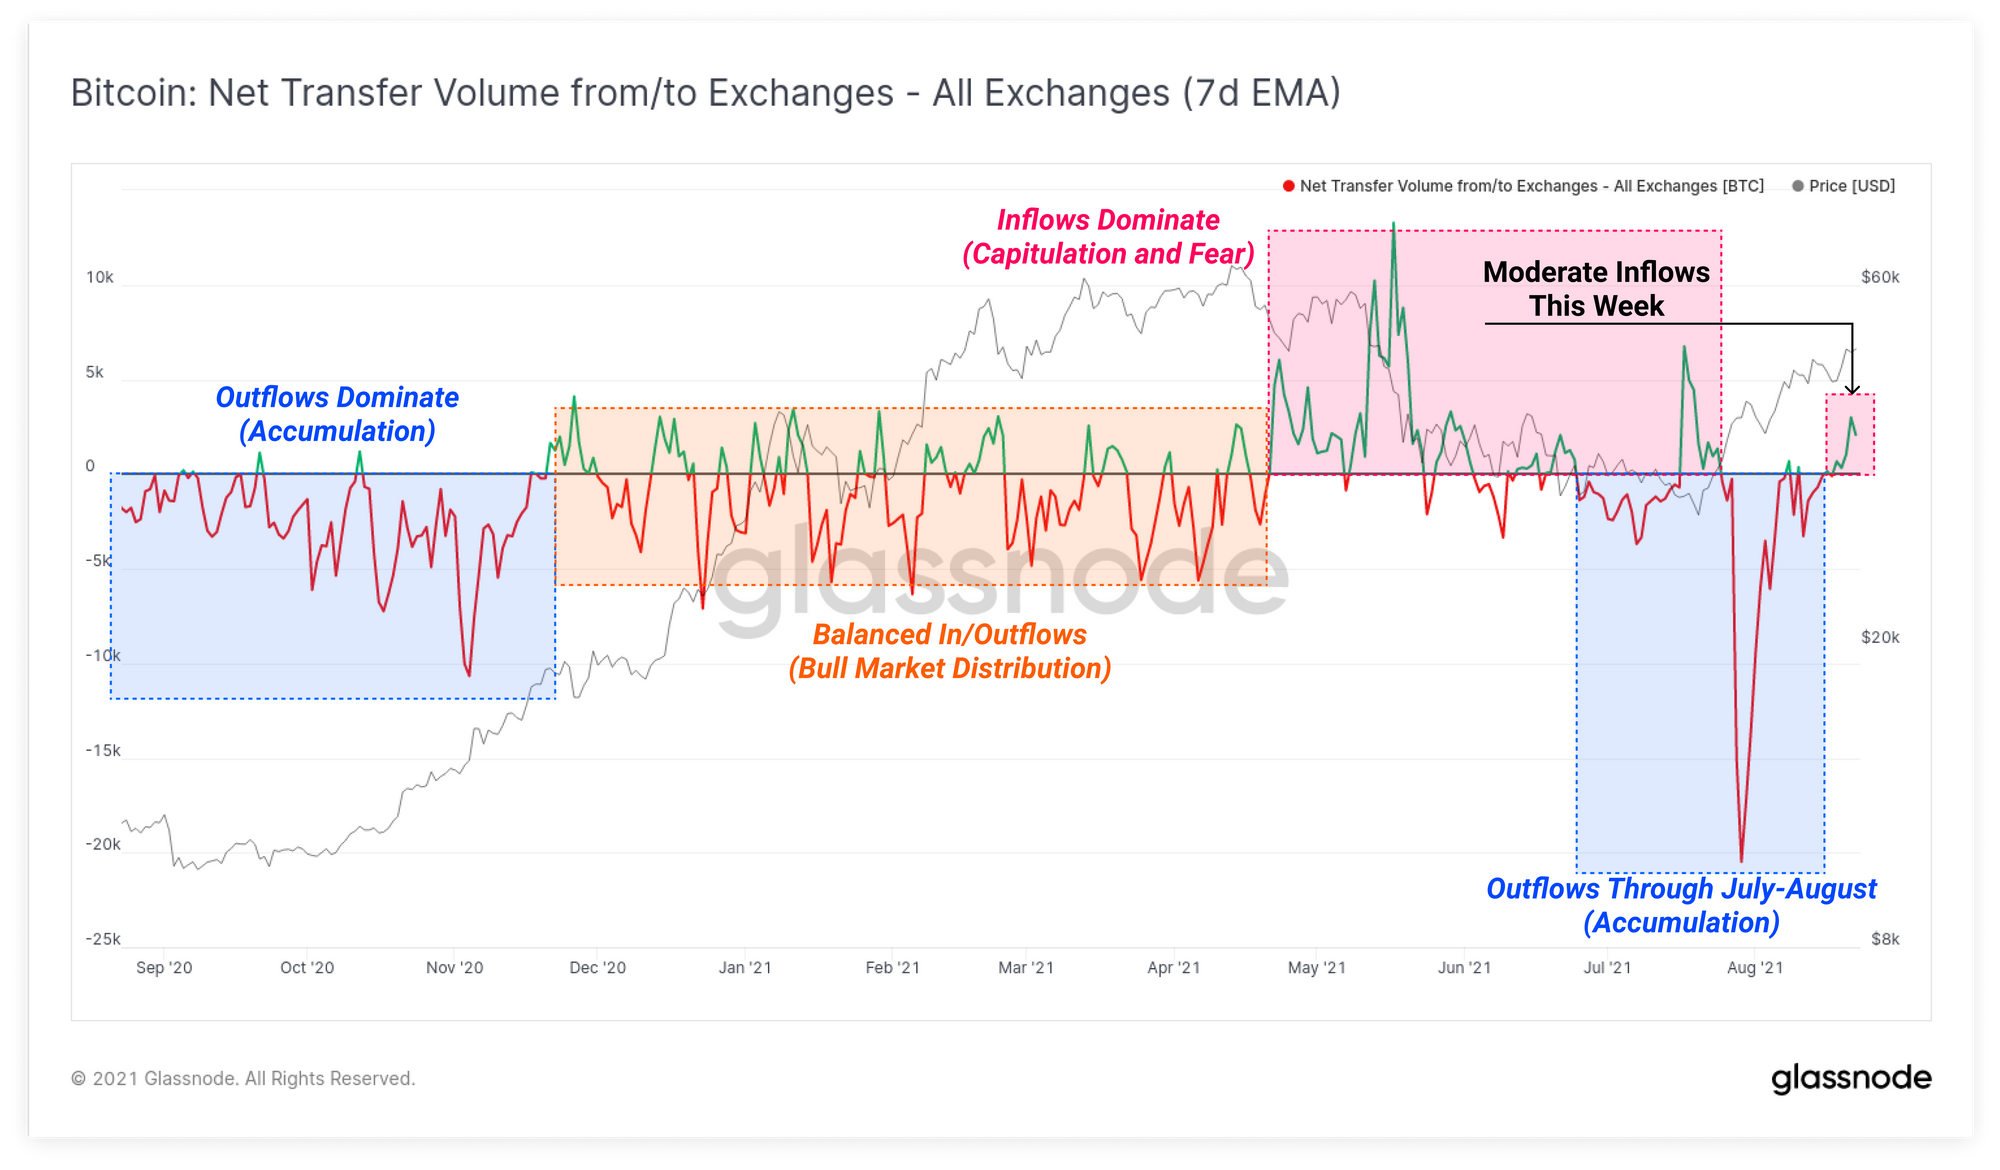
After the significant net inflow of around 140k BTC to exchanges in May, July saw around 110k BTC in net outflows, largely reversing that trend. However throughout August, exchange balances have stalled at around 2.5M BTC (~13% of circulating supply).
The Exchange Net Flow metric shows that this week saw overall net inflows to exchanges as some traders and investors appear to be taking profits, and capitalising on market strength. It is worth noting that the magnitude of inflow is not dissimilar to that seen through the Dec 2020 to April 2021 bull market period and is reasonably expected behaviour.
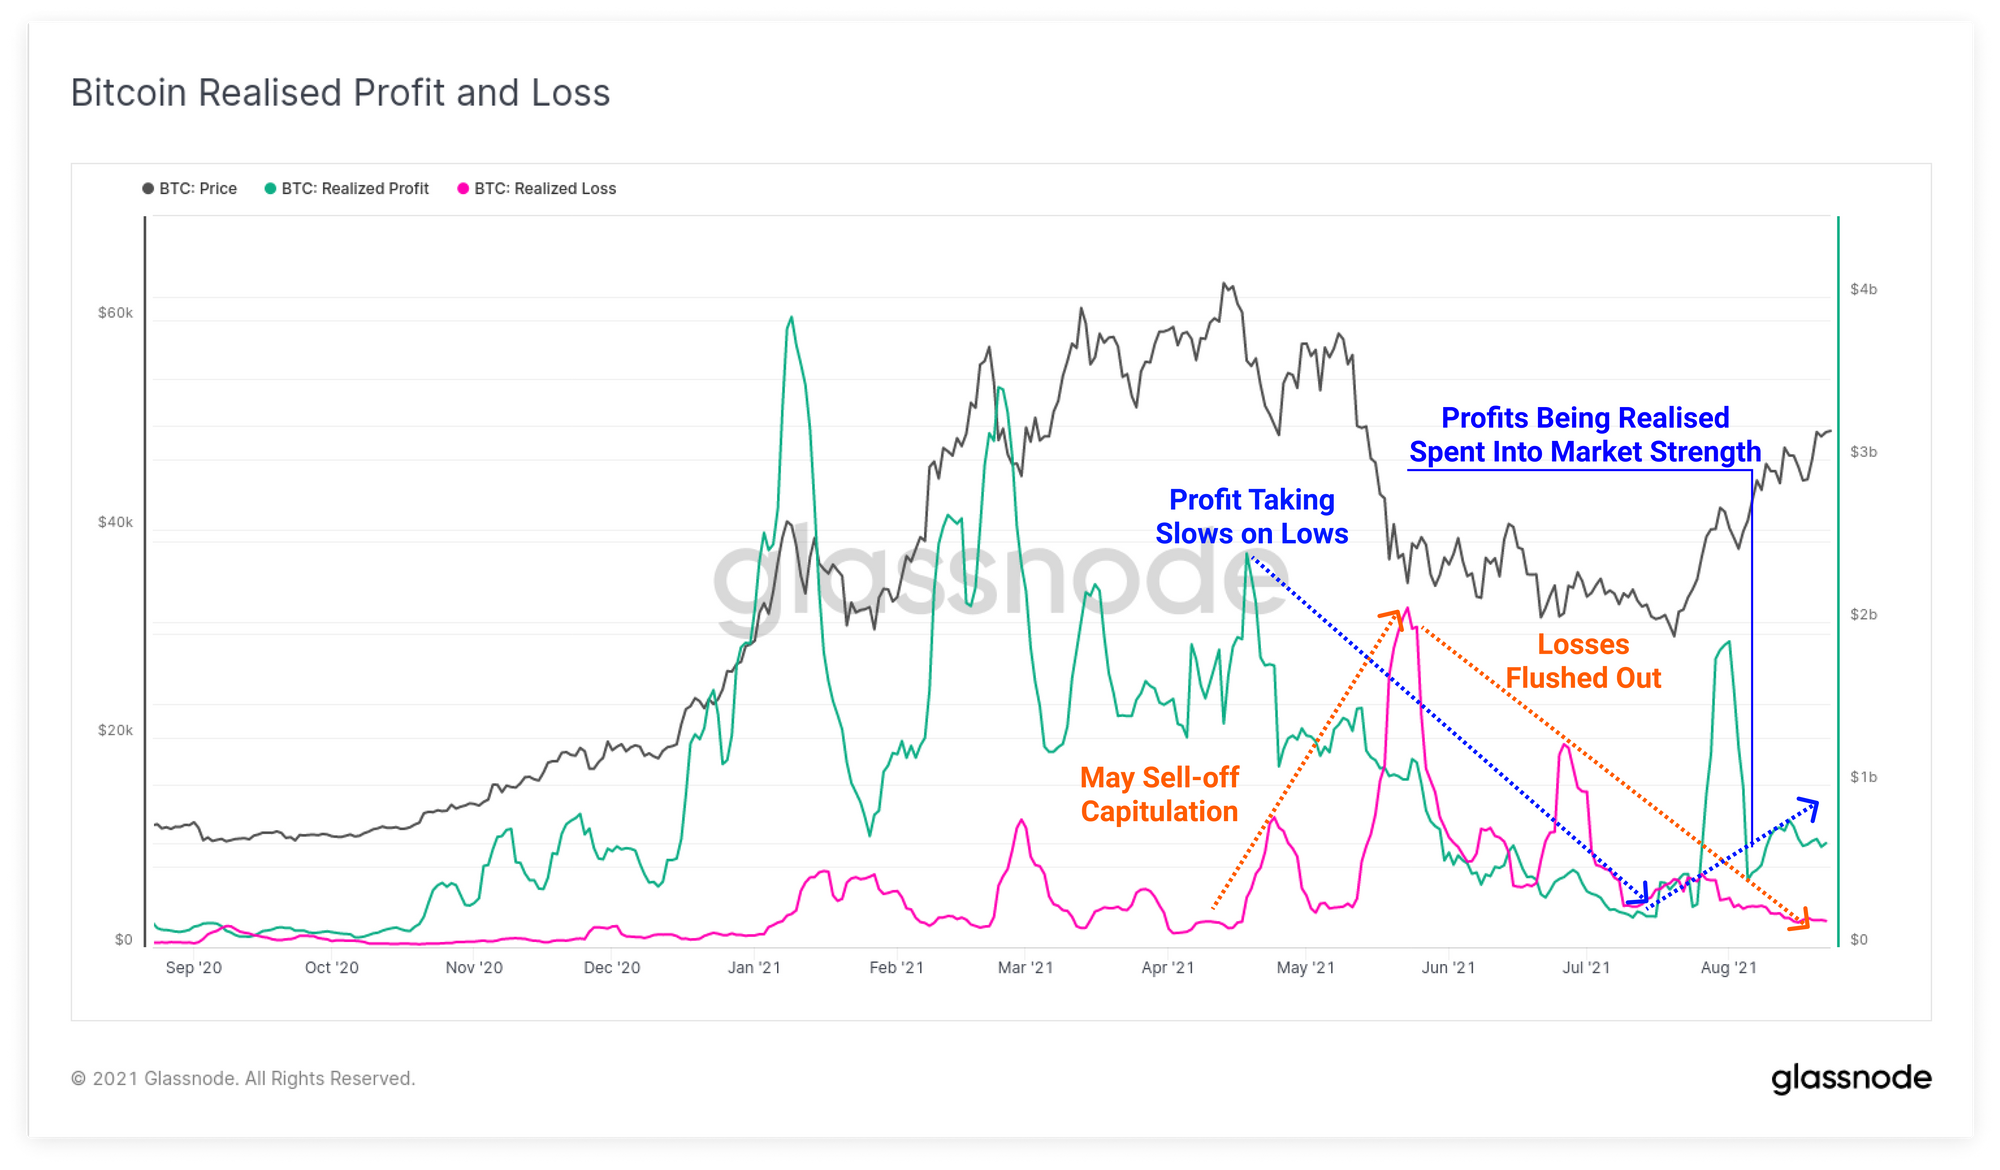
The chart below combines the Realised Profit and Realised Loss metrics using the Workbench tool. From this we can see that overall, investors holding profitable coins are currently spending more value on-chain than those with coins that are underwater.
The decline in realised losses of late could indicate that investors have found renewed conviction to hold on, or are potentially taking exits that are closer to their original cost basis, as price recovers towards the $50k range.
Who Is Spending On-chain?
If we investigate the Spent Output Age Bands metric, we can start to dissect which cohorts of the market are spending coins. This week has seen a noticeable uptick in older coin ages, particularly those older than 6-months. In the last year, these older coins have come back to life on a similar scale in two instances:
- Distribution in a Bull Market as old coin holders take profits into market strength.
- Distribution in Major Sell-offs as old coin holders de-risk during the recent major correction.
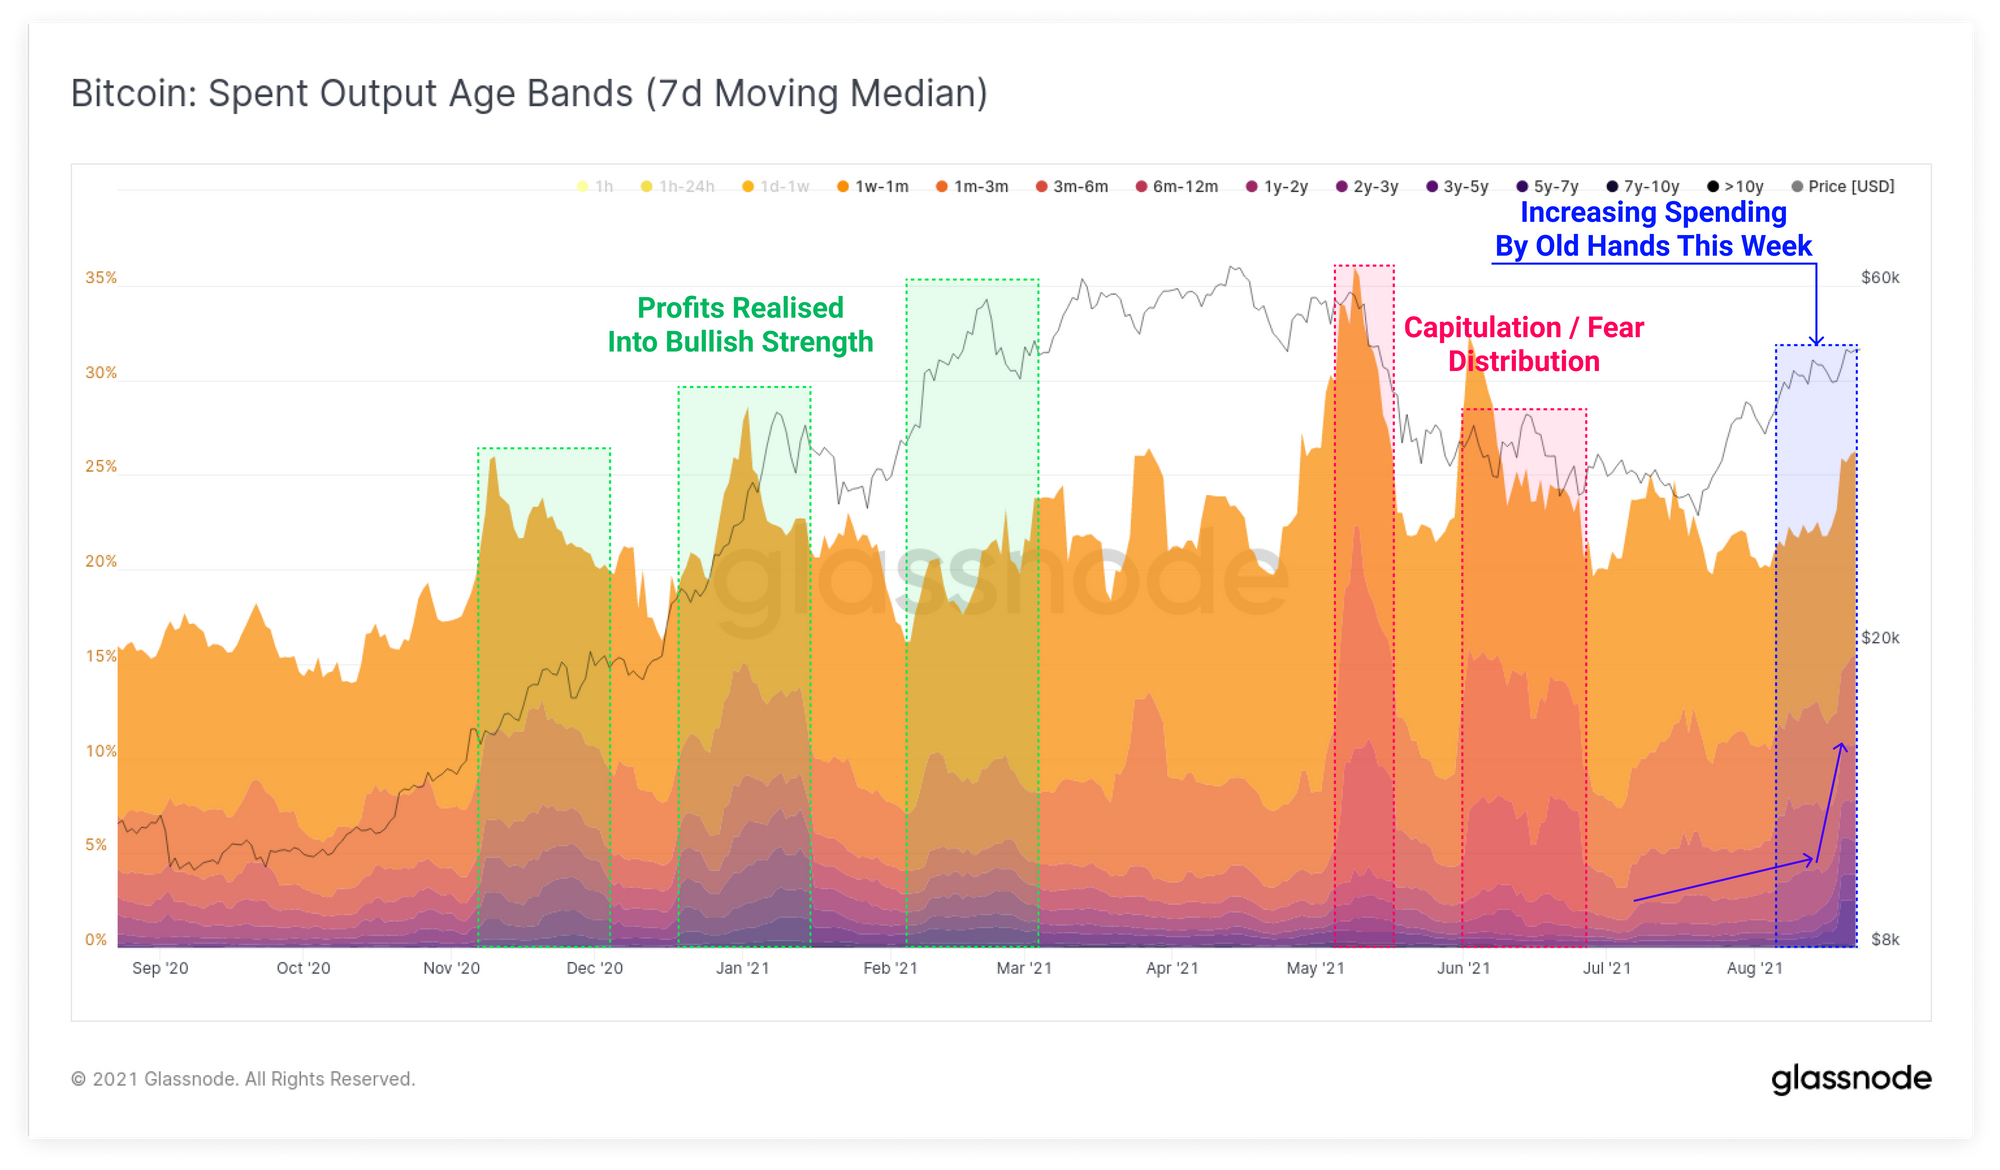
We can see a similar view looking at spent outputs aged between 6m and 5y which largely captures experienced Bitcoin investors and traders who have weathered non-trivial volatility in this cycle already. We can see a sharp uptick in all age bands this week which further suggests that some coins are taking exit liquidity.
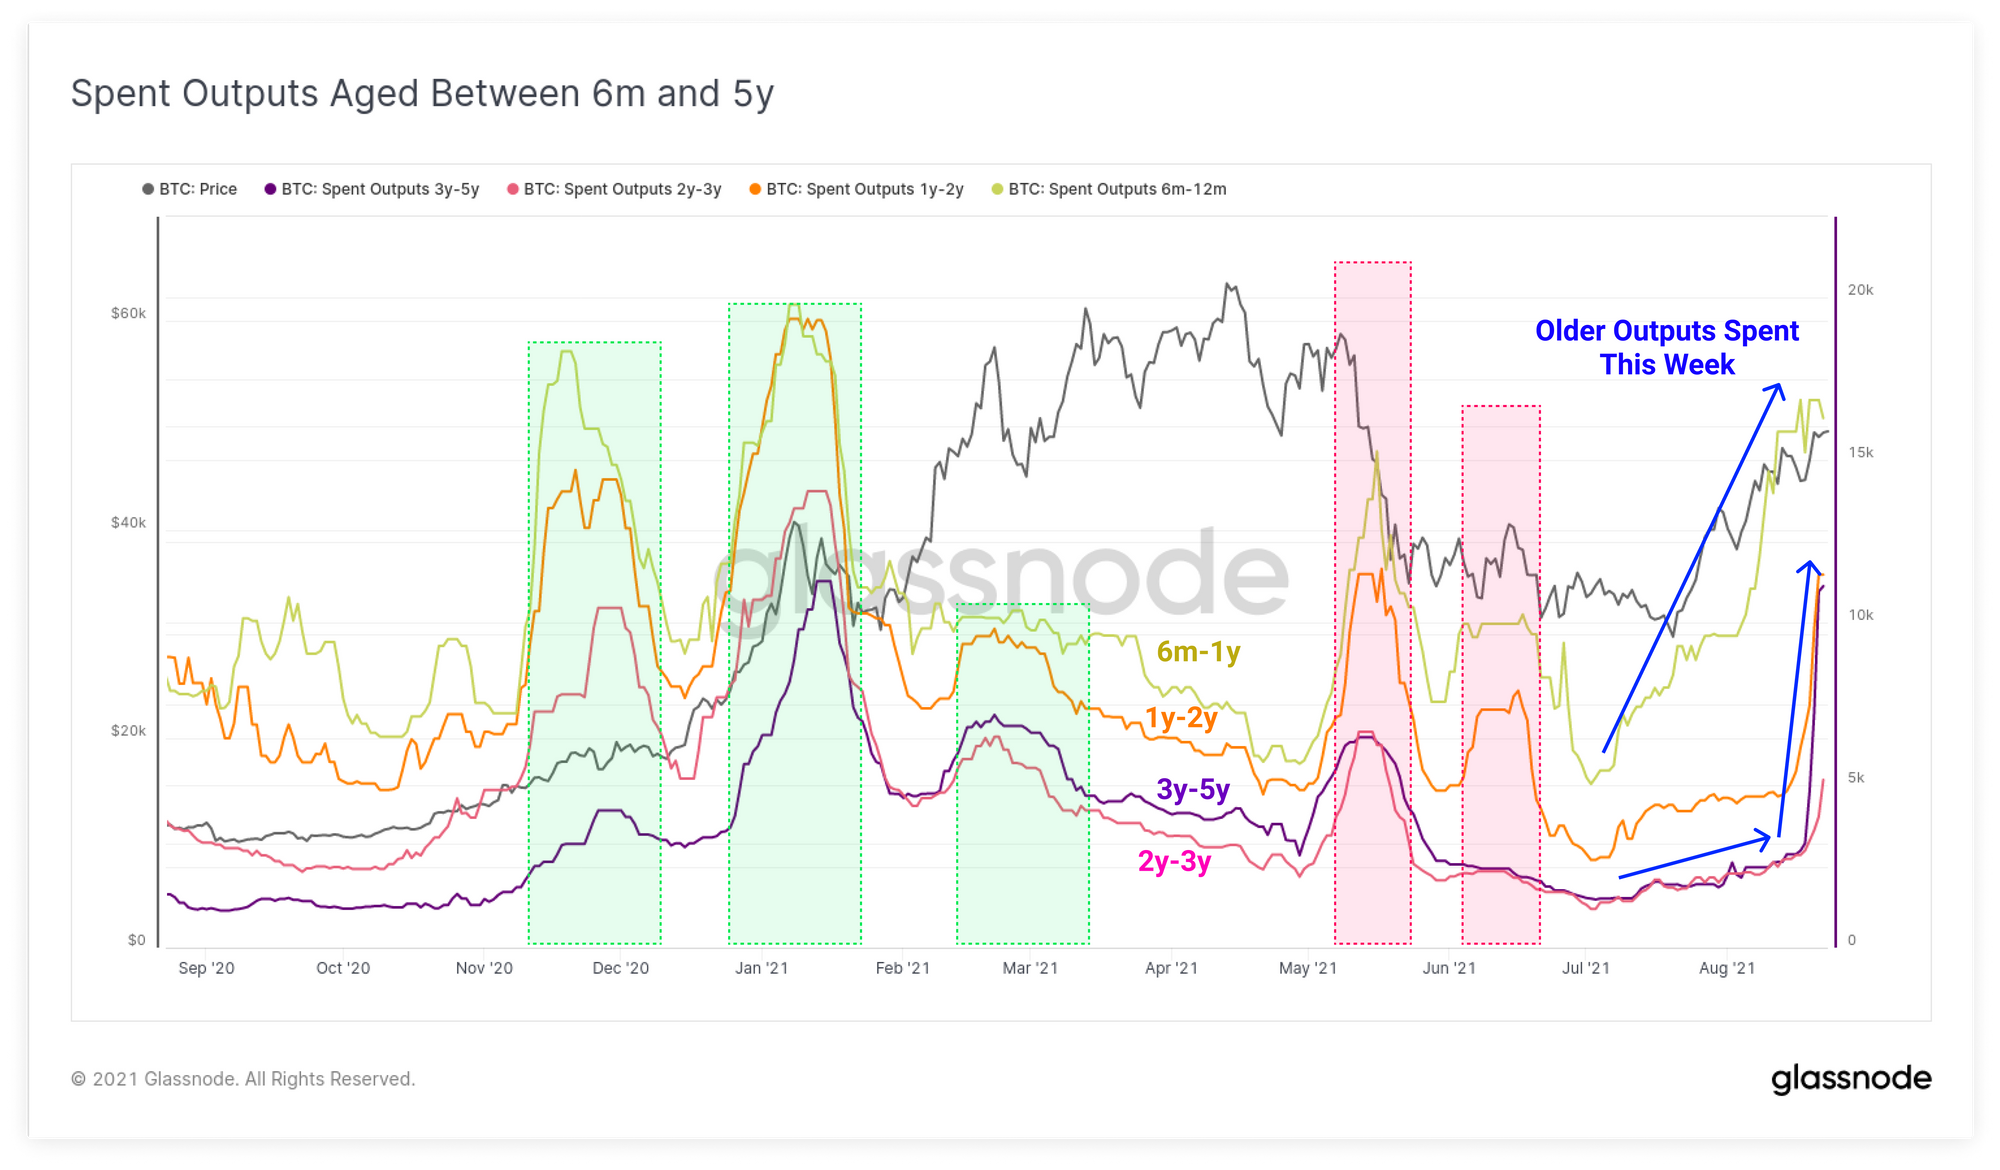
This perspective has also been highlighted by analyst @TXMCtrades who has utilised the Workbench tool to observe the combined proportion of all spent outputs aged between 6m and 5y. TXMC highlights that the current spending behaviour, where 5% to 7% of spent outputs are in this age range, have historically correlated with high volatility periods.
It is also suggested that relative to previous cycles, owners of older coins tend to be more active traders in more recent years. In the 2011 and 2013 cycles, older coins typically only came back to life around macro tops and bottoms, where as today it is more common around mid-cycle corrections and rallies. This demonstrates a degree of market maturity and financialisation of Bitcoin over time as more active traders and funds enter the space.
3/8 By applying a bit of color, we can highlight areas on the price chart where older coins made up a higher % of daily volume. This helps bring to life the selling behavior of long-term holders.
— TXMC (@TXMCtrades) August 23, 2021
A few observations stand out... pic.twitter.com/PYT4unq27y
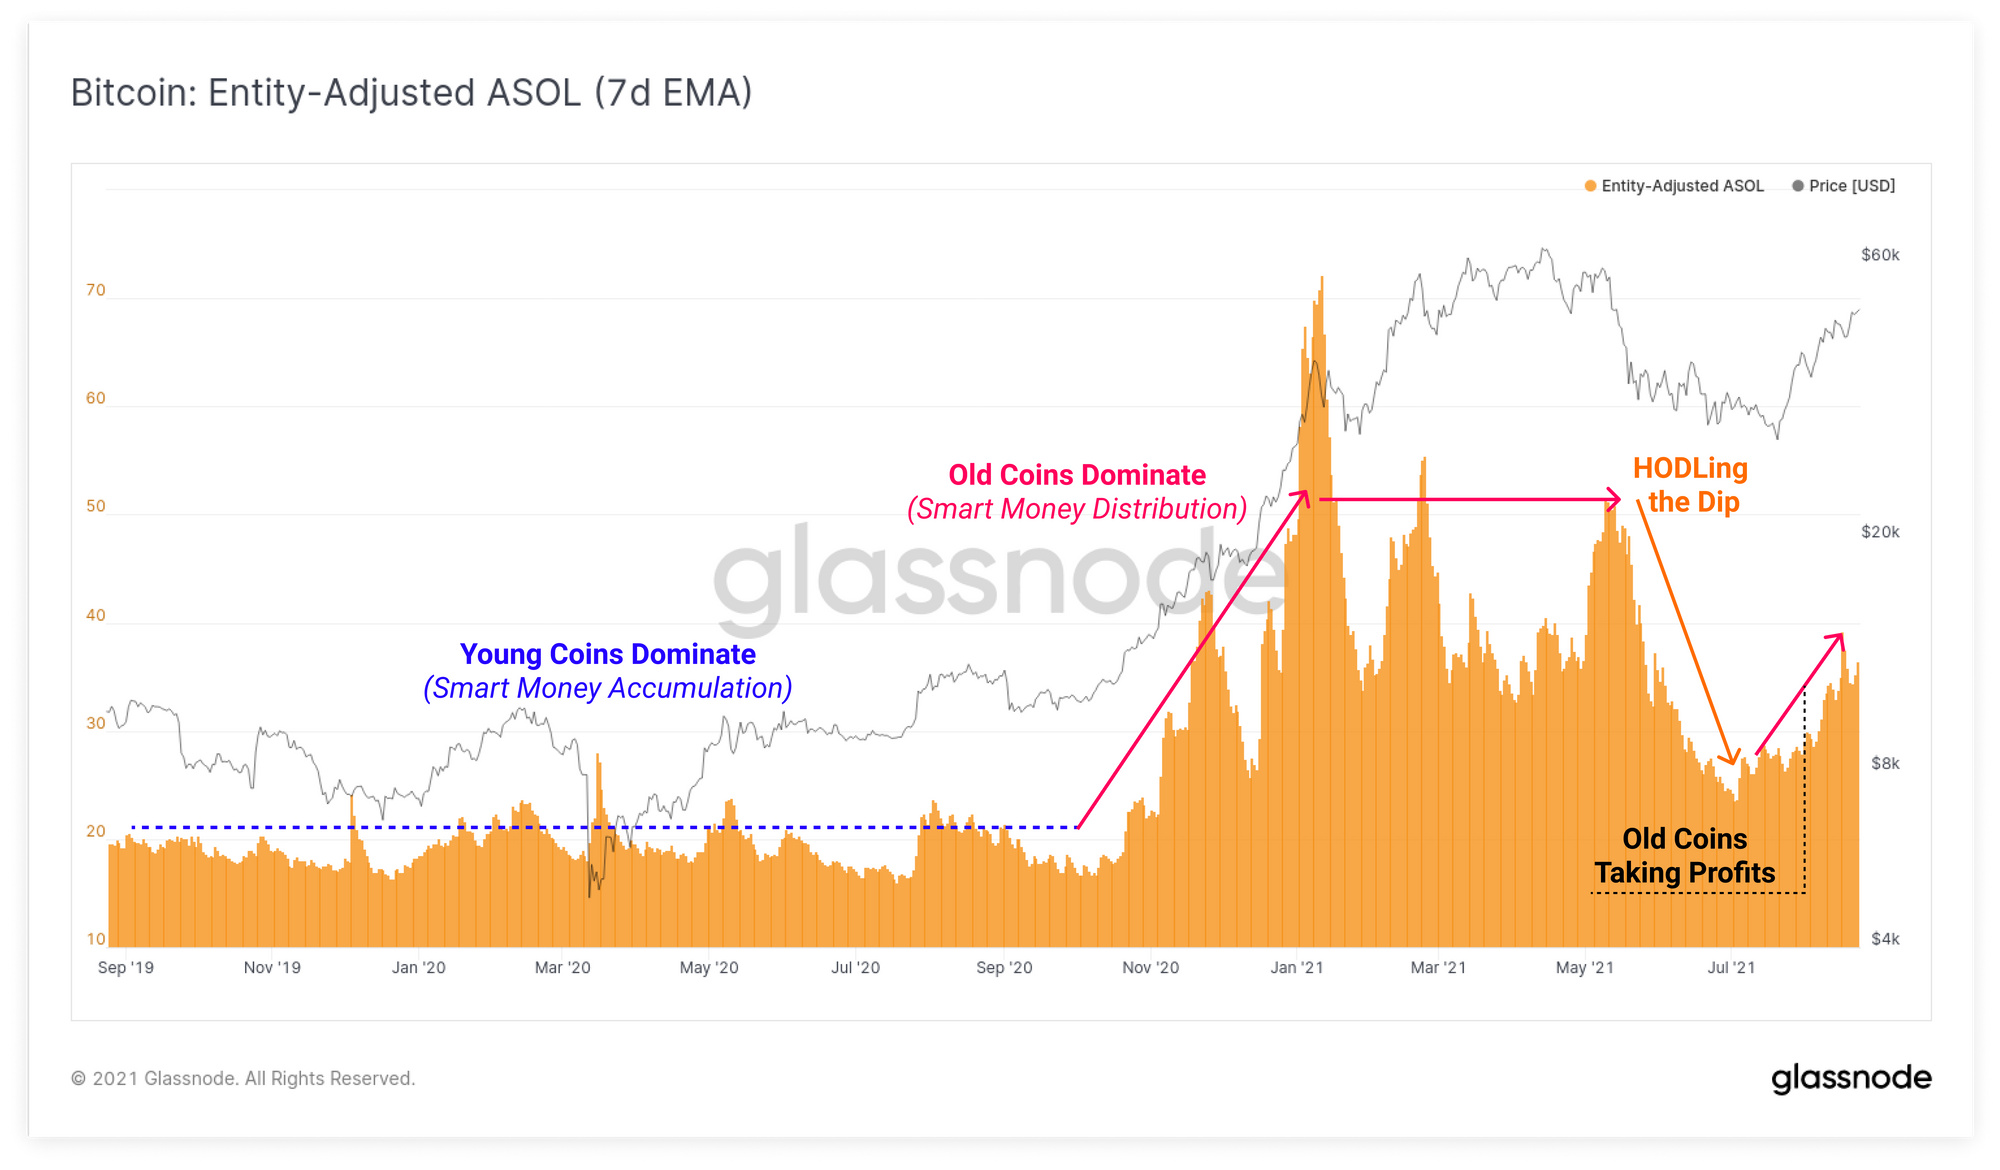
The spending of older coins has also shown up as a trend in the ASOL metric which measures the average age of all spent outputs that day. This trend of rising average age has been in play since July and throughout this rally which suggests two things:
- Profits are being realised by old hands, confirming what has been observed in the charts above.
- The market is absorbing the sell-side so far as prices have continued to climb. This indicates there is sufficient demand to absorb the coins being distributed.
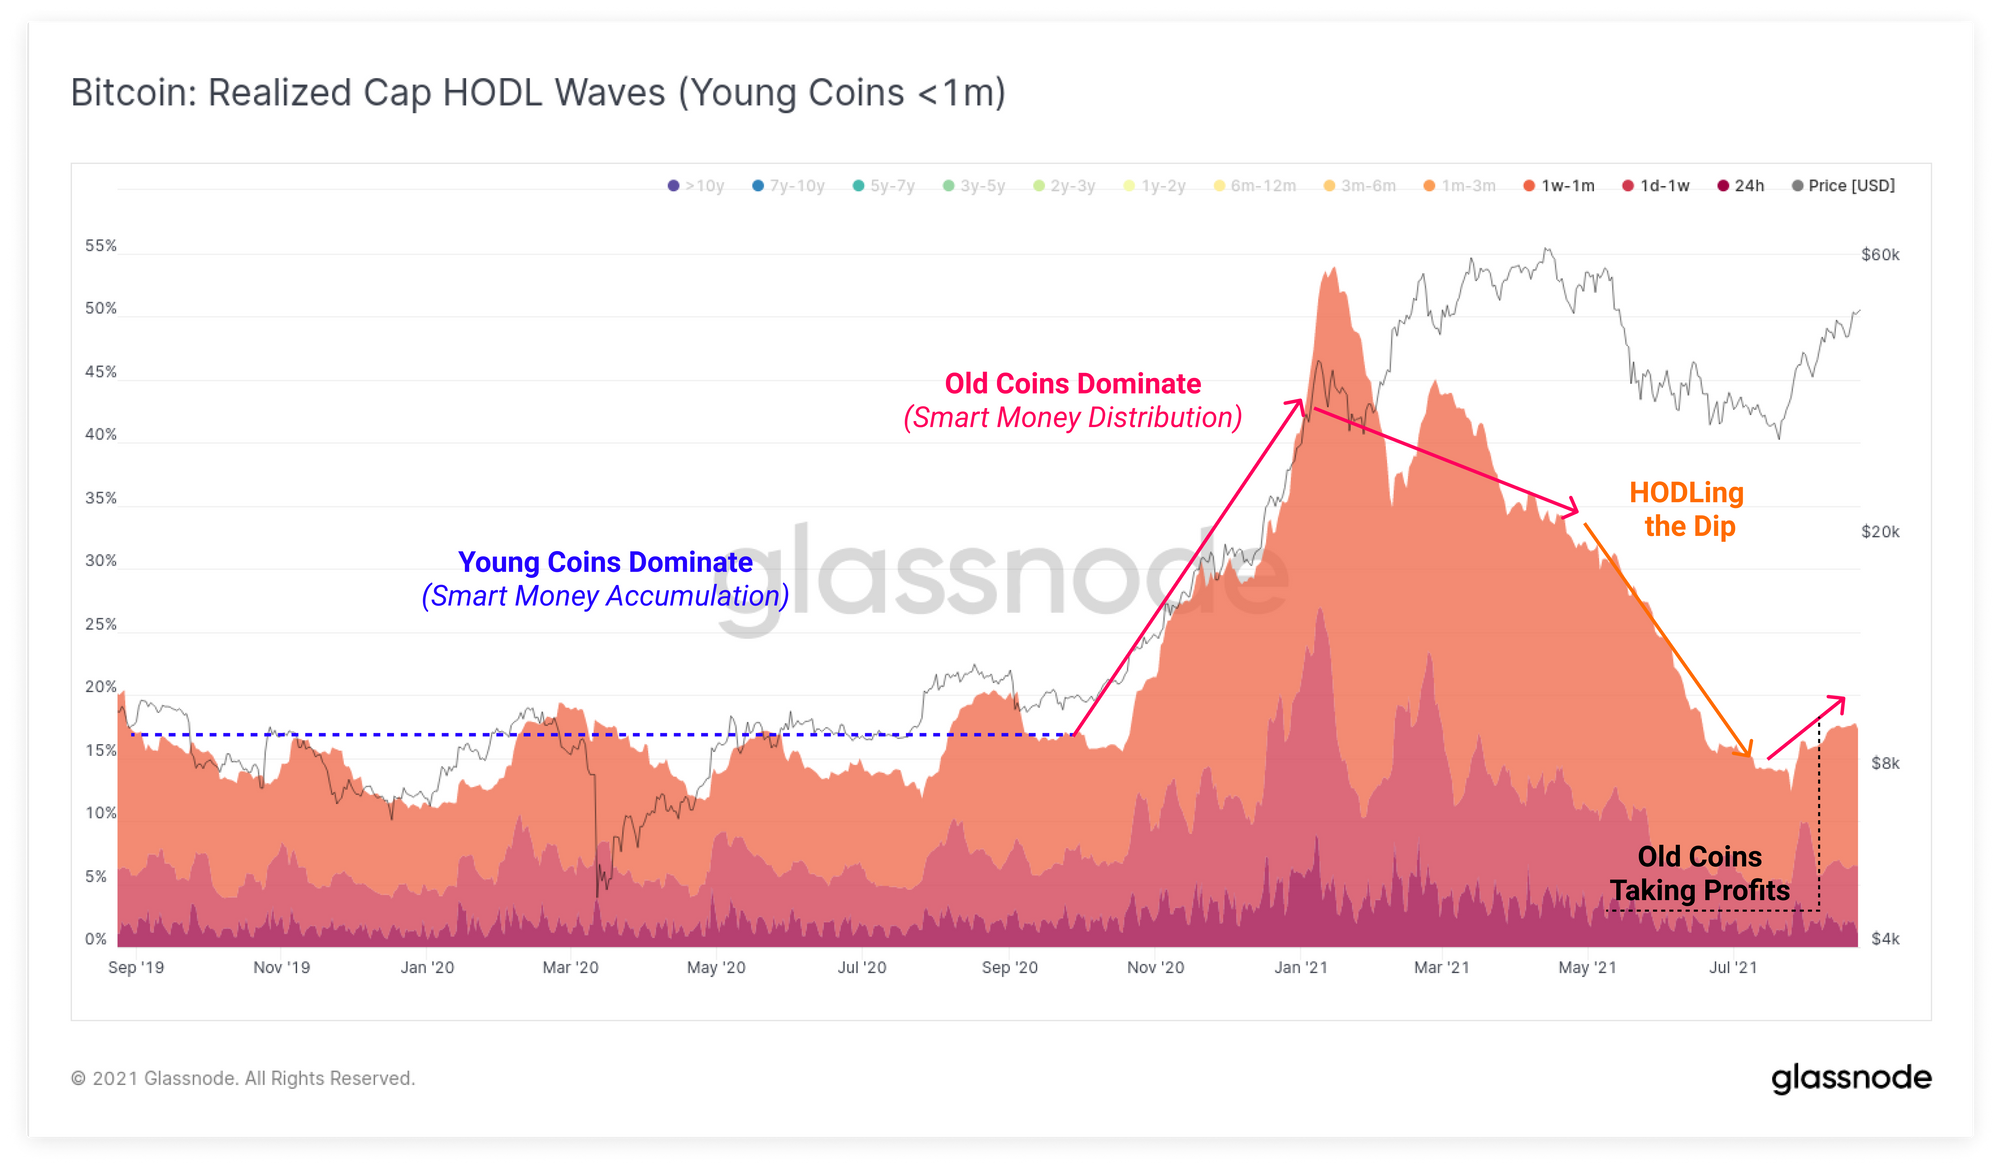
The Realised Cap HODL waves provide a last piece of evidence surrounding the current on-chain spending behaviour, as the young coin bands (< 1 month old) have swelled throughout August. This indicates that older coins have been spent and revalued into younger coin age brackets.
Note however, that the magnitude of increase for these age bands is very much in line with that seen in the 2020 accumulation phase. What this suggests is that whilst old UTXOs have definitely been spent in August, the actual coin volume they distributed is likely not overly significant. This supports the relatively minor exchange balance increase shown in the chart and section above.
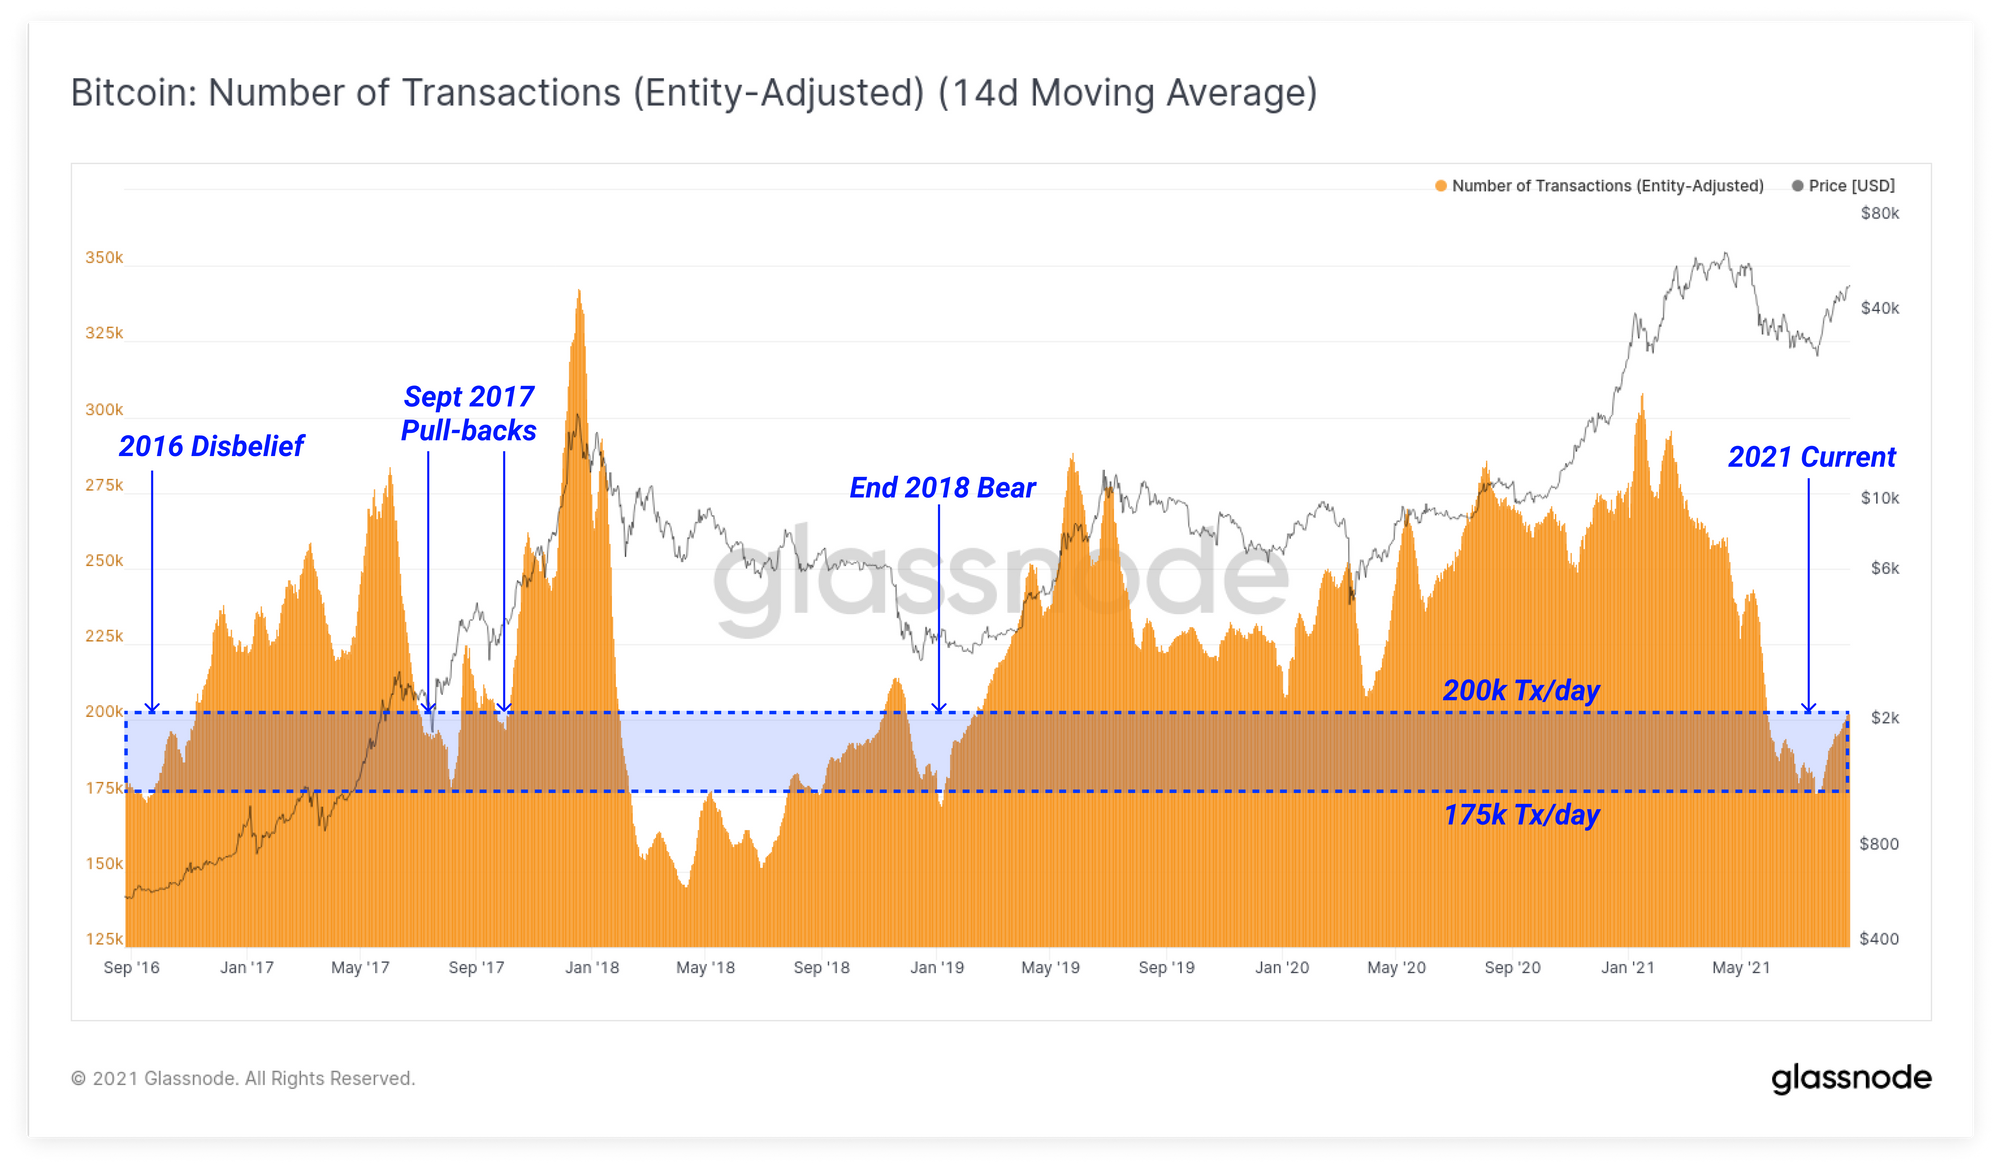
On-chain Activity Remains Divergent
In what continues to be an amazing divergence, on-chain activity has still not responded to positive price action. Entity Adjusted transaction counts remain at historically low levels of between 175k and 200k transactions per day.
These low levels have been seen in a few instances in the past 5-yrs:
- The 2016-17 Bull Market during the disbelief rally and in deep mid-bull pullbacks.
- The 2018-19 Bear Market as interest in Bitcoin waned and prices corrected 85% from the high.
- The current period following the 50% correction in May and 2.5 months of consolidation.
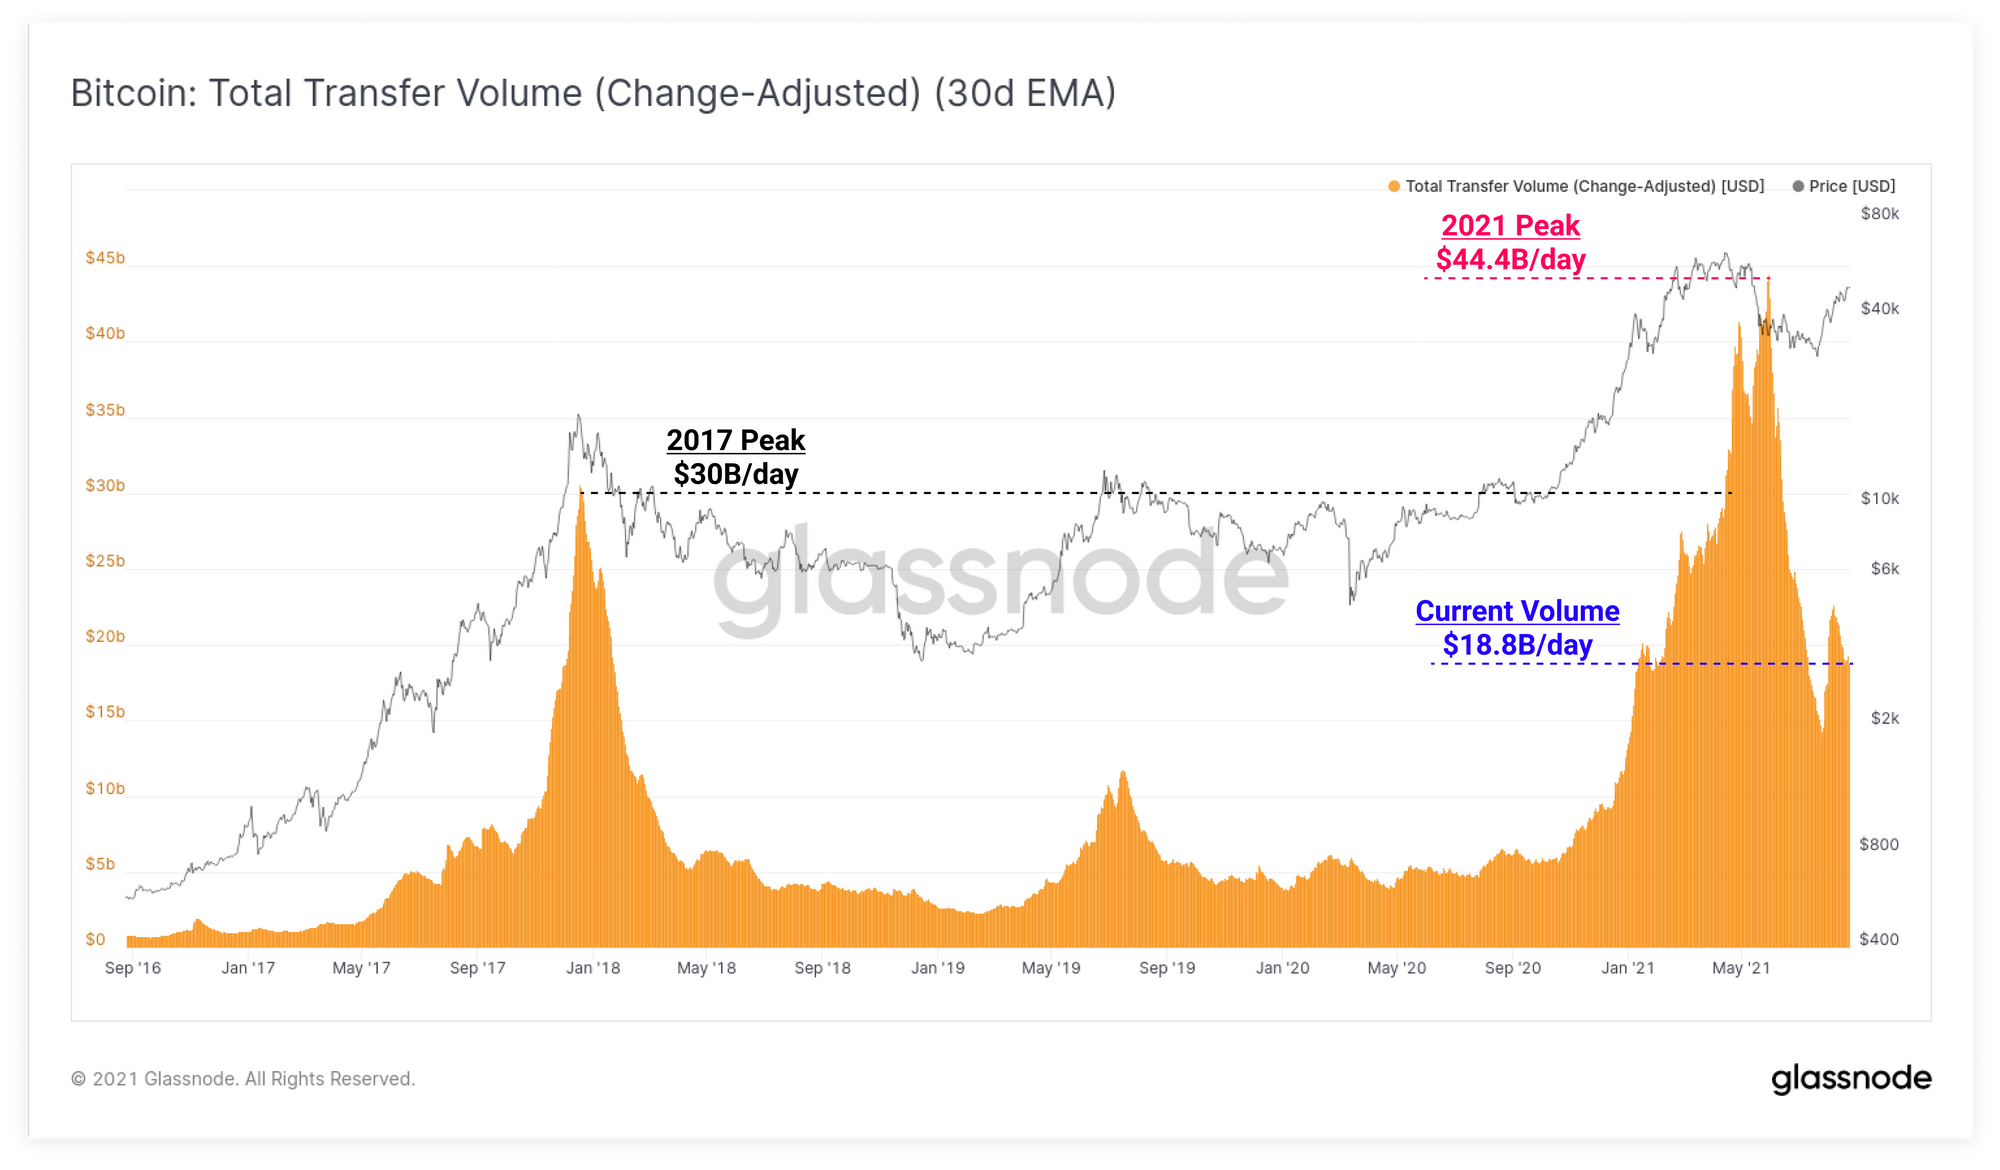
Transaction volumes are similarly depressed, with the Bitcoin network setting around $18.8B in daily volume. This is 37% lower than at the 2017 bubble peak, and a whopping 57.6% below the peak set during the May capitulation event. That said, settlement volume remains 276% higher than the $5B that was typical throughout 2020, although we should account for fact that price has traded up from $10k to the current level approaching $50k (+500%).
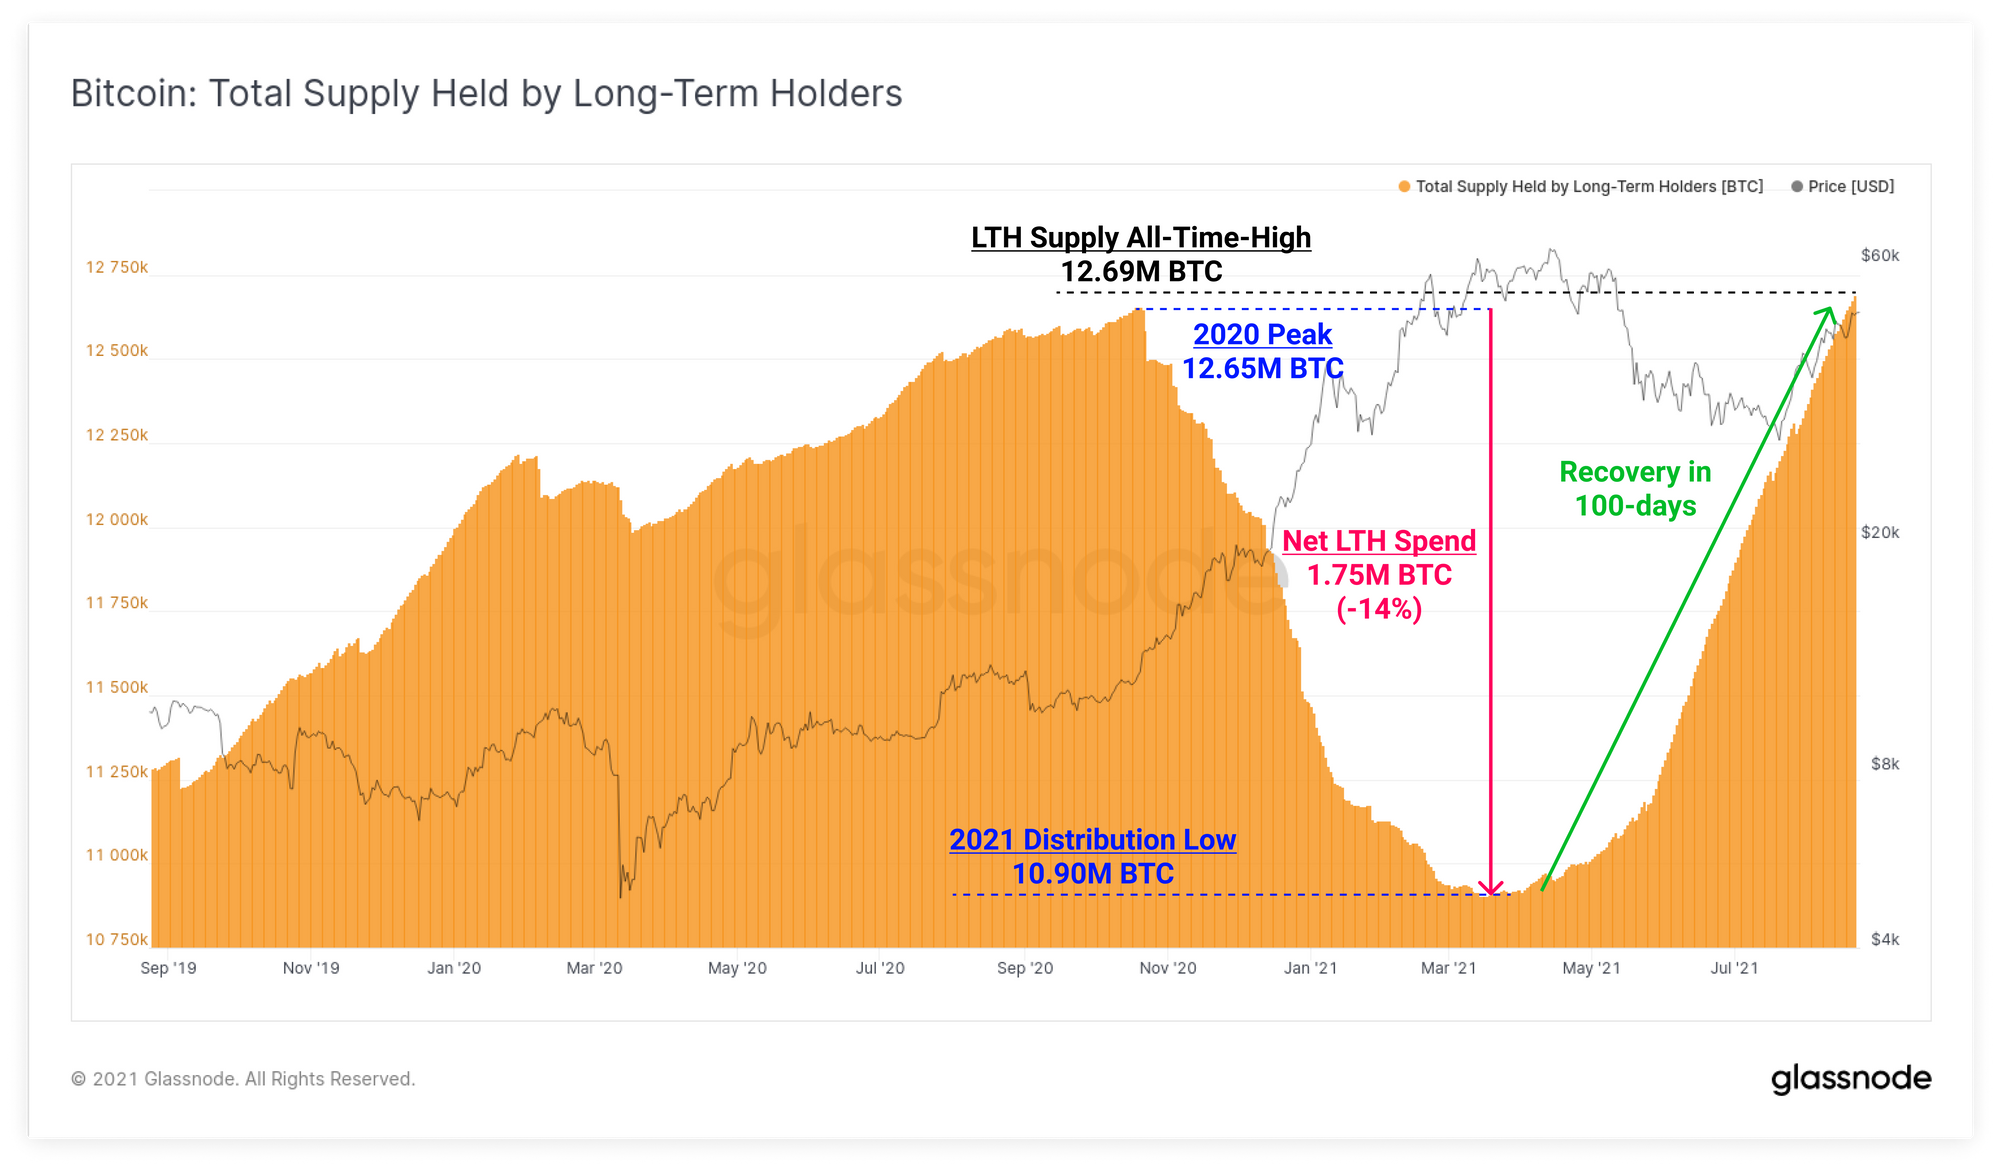
However, despite this significant divergence between rising prices and low on-chain activity, the overall supply dynamics remain extraordinarily macro bullish. This week, the supply held by Long-term holders has reached an all-time-high or 12.69M BTC, surpassing the previous peak from October 2020.
Through the Q1-Q2 bull market, LTHs distributed approximately 1.75M BTC which ultimately created oversupply, and put in the current ATH price top. Following that, investors dramatically slowed down their spending, and the coins that were accumulated in late 2020 and early 2021 have consistently matured across the ~155-day threshold for classification as 'Long-Term Holders'.
The recovery of LTH supply to ATH has taken just 100-days which goes to show just how significant the accumulation was in the early phase of this bull market. The fact this trend has yet to slow down also demonstrates that significantly more coin volume is getting older, than younger. This adds further weight to the argument that the old hand spending observed this week is likely of low coin volume, and strategic de-risking, rather than a loss of conviction and a mass exit.
Product Updates
Metrics and Assets
- Added custom functions for sma(), ema() and median() to Workbench
- Release Futures Long Liquidations Dominance
- Released Liquid, Highly Liquid and Illiquid Supply metrics

- Lesen Sie diesen Artikel jetzt auf Deutsch bei unserem offiziellen Partner Bitcoin2Go
- Follow us and reach out on Twitter
- Join our Telegram channel
- For on–chain metrics and activity graphs, visit Glassnode Studio
- For automated alerts on core on–chain metrics and activity on exchanges, visit our Glassnode Alerts Twitter