The Week Onchain (Week 39, 2021)

Exploring the bull and bear cases for the current market structure, as well as a deep dive into our new Lightning Network metrics.

The Week Onchain (Week 39, 2021)

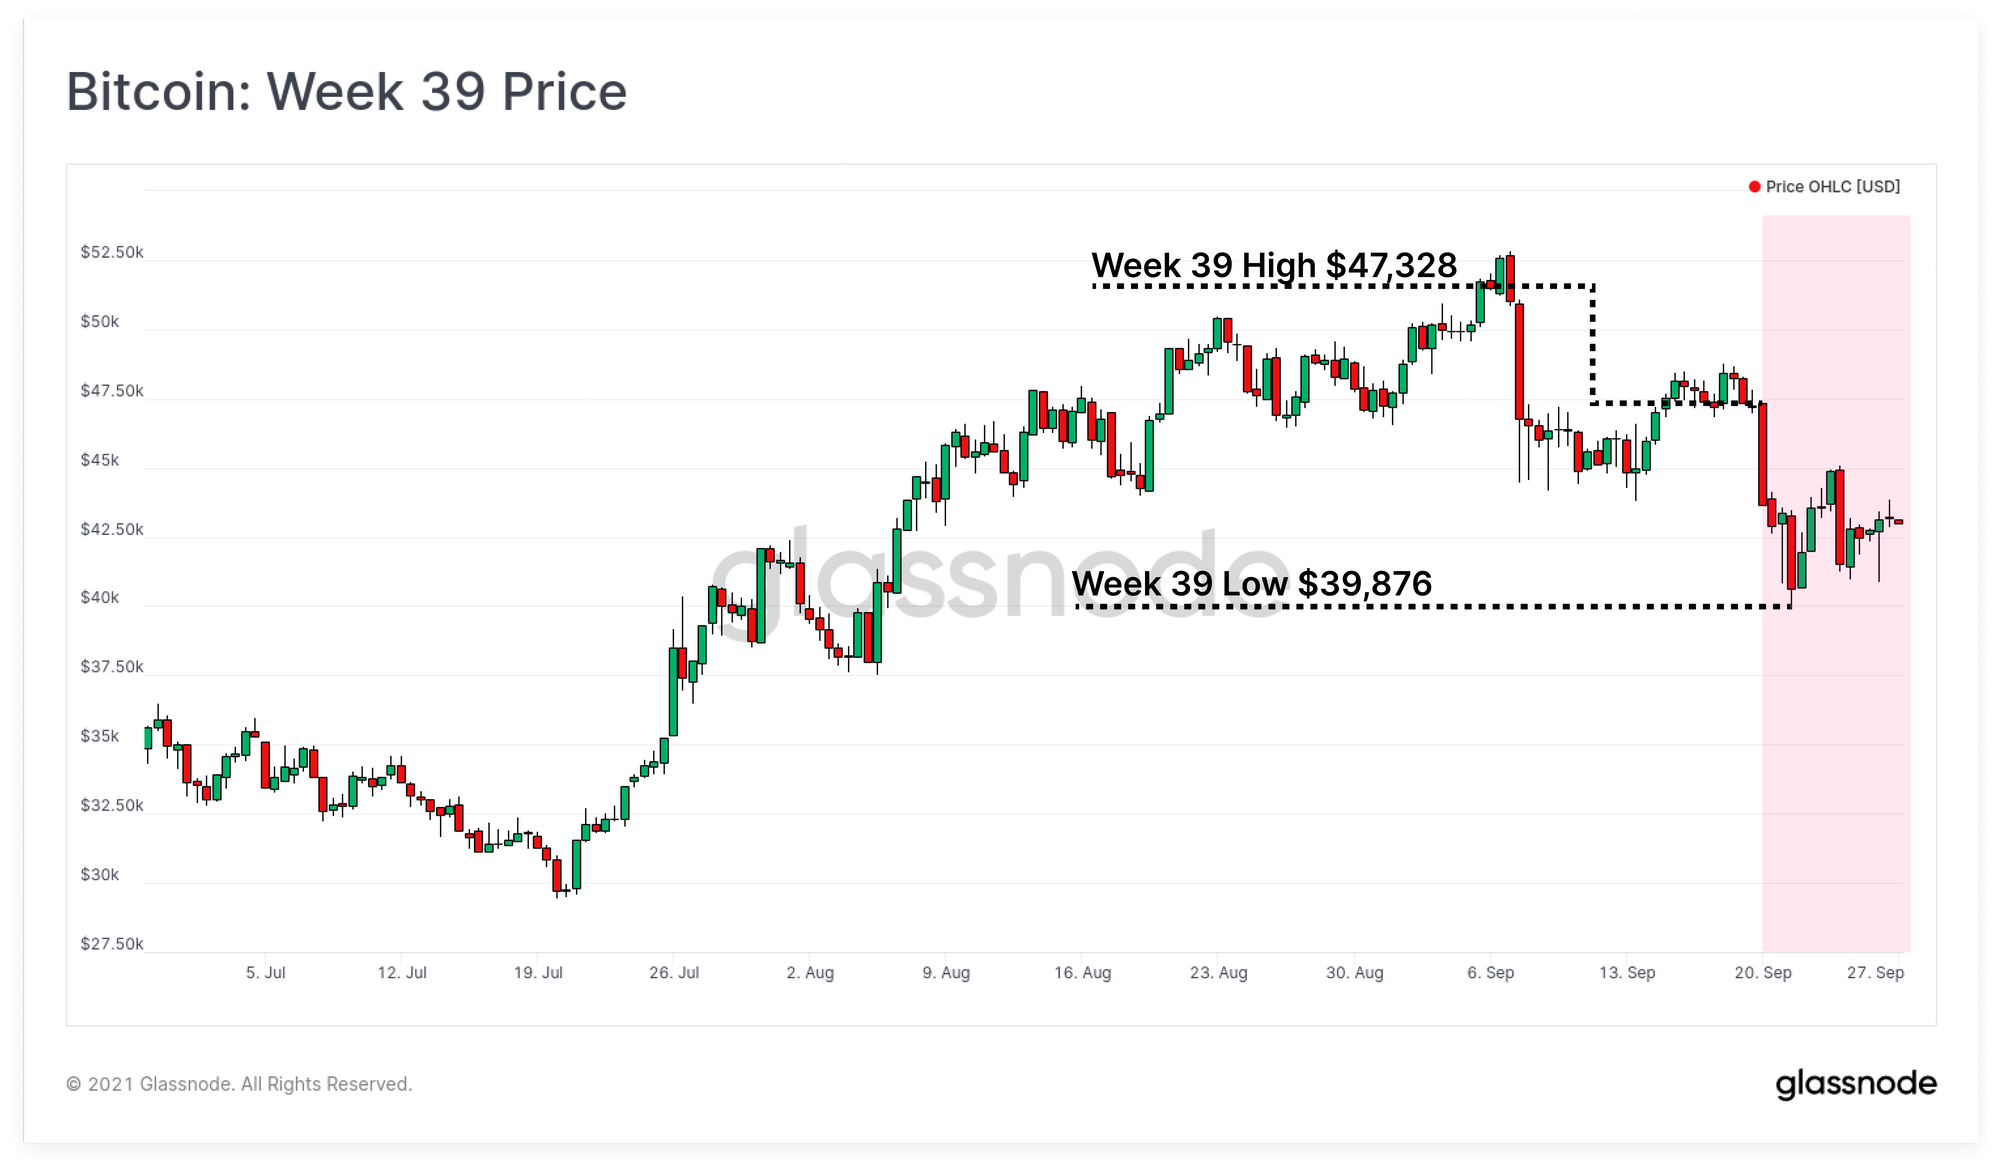
The Bitcoin market experienced volatile downside price action this week, opening at $47,328 on Monday and sliding to a low of $39,876. The sell-off comes alongside continued pressure on the industry from regulators, a sell-off in equities markets, challenging conditions in Chinese debt markets, and yet another Bitcoin ban in China.

Alongside this uncertainty, the week was full of exciting and positive news related to both El Salvador's adoption, and Twitter's implementation of the Bitcoin Lightning Network. We are also excited to release a suite of Lightning Network charts and dashboards to track the performance and adoption of the LN protocol.

In this week's newsletter, we will explore both the bull and bear sides of the current market conditions on-chain, as well as a deep dive into our new Lightning Network metrics.


Week On-chain Dashboard

The Week On-chain Newsletter now has a live dashboard for all featured charts here. We have also started production for Week On-chain video analysis to provide a deeper dive into the thesis and logic behind each weeks analysis. Visit and subscribe to our YouTube channel, and visit our Video Portal to see our video content.


Only the HODLers Remain

The relatively low utilisation of Bitcoin block-space has been widely discussed of late, with a case to be made on both sides as to whether it is bullish, bearish, or both:

  • Bull case is that it is a result of growing adoption of efficient transaction techniques such as SegWit, transaction batching, and usage of Lightning Network.
  • Bear case is that the 50%+ correction in May resulted in a flushing out of many retail traders and investors, and thus interest in the protocol has waned since early 2021.
  • The most likely case is both of these are in effect.

The chart below shows that transaction counts have indeed declined since May, returning to what could be considered a 'bearish onchain activity channel'. Higher transaction counts are characteristic of bullish conditions as new entrants swarm into the network and demand for block-space increases accordingly. Conversely, lower transaction demand can signal fewer market participants are active, and less relative interest in the asset.

Transaction counts are currently at around 175k to 200k transactions per day which are similar to levels seen in the 2018 bear market.

Transaction Counts (EA) Live Chart

As exchanges increasingly deploy transaction batching techniques (processing multiple client withdrawals in a single transaction), transaction counts alone can be misleading. Thus we must also assess the number of active on-chain entities.

We can see however, that a very similar pattern is in play which speaks to the more bearish case of reduced participation being a dominant driver. This adds weight to the argument that the market may be dominated by HODLers and traders, with less participation by newer entrants and retail speculators.

Active Entities Live Chart

We can confirm this by looking at the Entities Net Growth metric which describes the difference between new on-chain entrants (holding new coins), and those leaving the network (spending all their coins). Here we can see with each market cycle a rising 'floor value' of new entities. This describes Bitcoin reaching a wider audience over time, and the size of the consistently buying HODLer base. We can also see that bull markets experience a steep increase in new participants, many of which slow-down after market tops.

The current market has returned to the upper bound of the 2018-20 bear market baseline, of around 13k new entities per day.

Entities Net Growth Live Chart

The assessment we can take away from this, is that the highest likelihood is that the majority of today's market participants, are longer-term HODLers and accumulators. The question is, can they hold the line and provide sufficient buy support?

If we look to the percent entities in profit, we can make two observations:

  1. Around 9.6% of entities hold coins, that were accumulated during August and September, and are now underwater (held at an unrealised loss). This represents a 58% retracement of the August high, suggesting a non-trivial number of buyers from May-July took profits on the way up.
  2. This fractal is remarkably similar to the July-October recovery after the March 2020 sell-off.

We also see this March 2020 recovery fractal in the Short-term Holder MVRV. This metric will trade at 1.0 when price is equal to the onchain cost basis of STHs. After a capitulation event (MVRV < 1.0) and relief rally (MVRV > 1.0), STHs who accumulated on the way up are having their conviction to hold tested.

Prices have returned to the cost basis of short-term holders. Given we estimated ~58% of them are already underwater, the key question is whether these buyers from August and September will sell their coins at a loss and drive prices lower. The other question is whether the HODLers who remain can provide enough buy side support if they do?

STH-MVRV Live Chart

Conviction to HODL

To answer the second half of this question, we assess the conviction to HODL by existing coin holders amidst fairly historic volatility (and many rolls of the FUD dice).

We start with the Coin-days Destroyed 90 metric (CDD-90) which calculates the cumulative sum of lifespan spent over the last 90-days. This metric will peak when large volumes of old coins are spent (usually in bull markets), and decline during periods of accumulation and HODLing.

CDD-90 is currently trading at very low levels of around 150k CDD. This level is coincident with periods of large scale accumulation, including both early bull markets, and later stage bear markets.

CDD-90 Live Chart

We can also see that the relative supply held by Short-term Holders has reached an all-time low of 20% of circulating supply. This is a rare occurrence that has historically described the late stage accumulation periods of bear markets by the smarter money.

Relative STH-LTH Supply PNL Live Chart

This also manifests as a multi-year low in Highly Liquid supply, a metric that has returned to December 2018 levels. Highly liquid coins are those that are located on exchanges and other venues where coins can trivially change hands with the click of a button.

Liquid and Illiquid Supply Live Chart

We can confirm this downtrend is influenced by the withdrawal of coins from exchanges, which continues at a significant rate. The exchange net position change metric demonstrates a clear change in character and market preference following March 2020. The market shifted from a regime of dominant inflows, to one of outflows. July to September has been a historically significant period of net outflows, ranging between 80k and 100k BTC/month.

Exchange Net Position Change

As coins migrate out of highly liquid exchange balances, and into investor wallets, they start to mature. Initially, these coins are likely to be re-spent in response to market volatility, but over time, the are increasingly considered illiquid, dormant, and more likely to remain in cold storage. These transitional coins are referred to as Liquid supply which we can see has been in macro decline since 2016.

If we consider the total supply of Highly Liquid and Liquid coins, we have 3.117M (HL) + 1.229M (L) = 4.346M BTC freely circulating (~23% of circulating supply).

Liquid and Illiquid Supply Live Chart

The converse of the above charts is that Long-term holders now hold an all-time-high of over 80% of circulating BTC. Of note in the 2021 cycle, is the relatively small distribution of coins that occurred in the Q1-2021 bull compared to previous cycles. LTH supply drew down to only 67.7% of supply where previous cycles were between 54% and 58%.

We can also note the speed of the recovery which indicates that 12.3% of the circulating supply was accumulated in the 2020-21 bull market, and remains unspent today.

Despite relatively low on-chain activity, and a number of market fractals resembling bearish conditions, there remains an undertone of extreme HOLDing and accumulation behaviour. This is somewhat unique to this market cycle and is a dynamic worth keeping an eye on.

Relative STH-LTH Supply PNL Live Chart

Lightning Network Adoption

In the headlines this week is the adoption of Bitcoins Lightning Network (LN), primarily by El Salvador, and by Twitter as an integrated payment feature. We have also released a suite of Lightning Network metrics to Glassnode Studio that helps describe thew extraordinary growth of the protocol over recent months.

The number of LN nodes is one of many metrics at an all-time-high, reaching 15.6k nodes this week.

Lightning Node Count Live Chart

The number of LN channels have reached highs of 73k, representing an average of 4.6 channels per node. This is around double the number of channels that were live through the period from 2019-20, with most of this growth occurring since May 2021.

Lightning Channel Count Live Chart

Total BTC capacity in LN channels has seen explosive growth over the last nine months, rising 170% in 2021 to reach 2,904 BTC (~$127M). 514 of these coins were added to LN channels in September alone.

Lightning Capacity Live Chart

Finally, the mean and median channel size has been climbing steadily as adoption and confidence in the protocol grows. The average channel capacity is accelerating higher from the stable baseline of ~0.028 BTC in 2019-20 to 0.040 BTC today. Median channel size has also lifted to 0.01 BTC, having risen notably through July and August.

The adoption and growth of the Lightning Network, both via scaling out in El Salvador, and in Twitter implementations, is an exciting challenge for the industry. Be sure to check out our Lightning metrics and dashboard to keep track of LN adoption and performance over the coming months.

Lightning Mean and Median Size Live Chart

Product Updates

Metrics and Assets

  • Released Lightning metrics and dashboard.
  • Updates to Glassnode Insights pages.
  • Additional Workbench functions added rsi(m1, period)

Disclaimer: This report does not provide any investment advice. All data is provided for information purposes only. No investment decision shall be based on the information provided here and you are solely responsible for your own investment decisions.