Sizing Up a Bitcoin Bear
As Bitcoin prices are cut in half from the ATH, the market experiences a large onchain capitulation event, with $2.5B in net realised losses. In response we analyse whether a macro bear has taken the reigns.


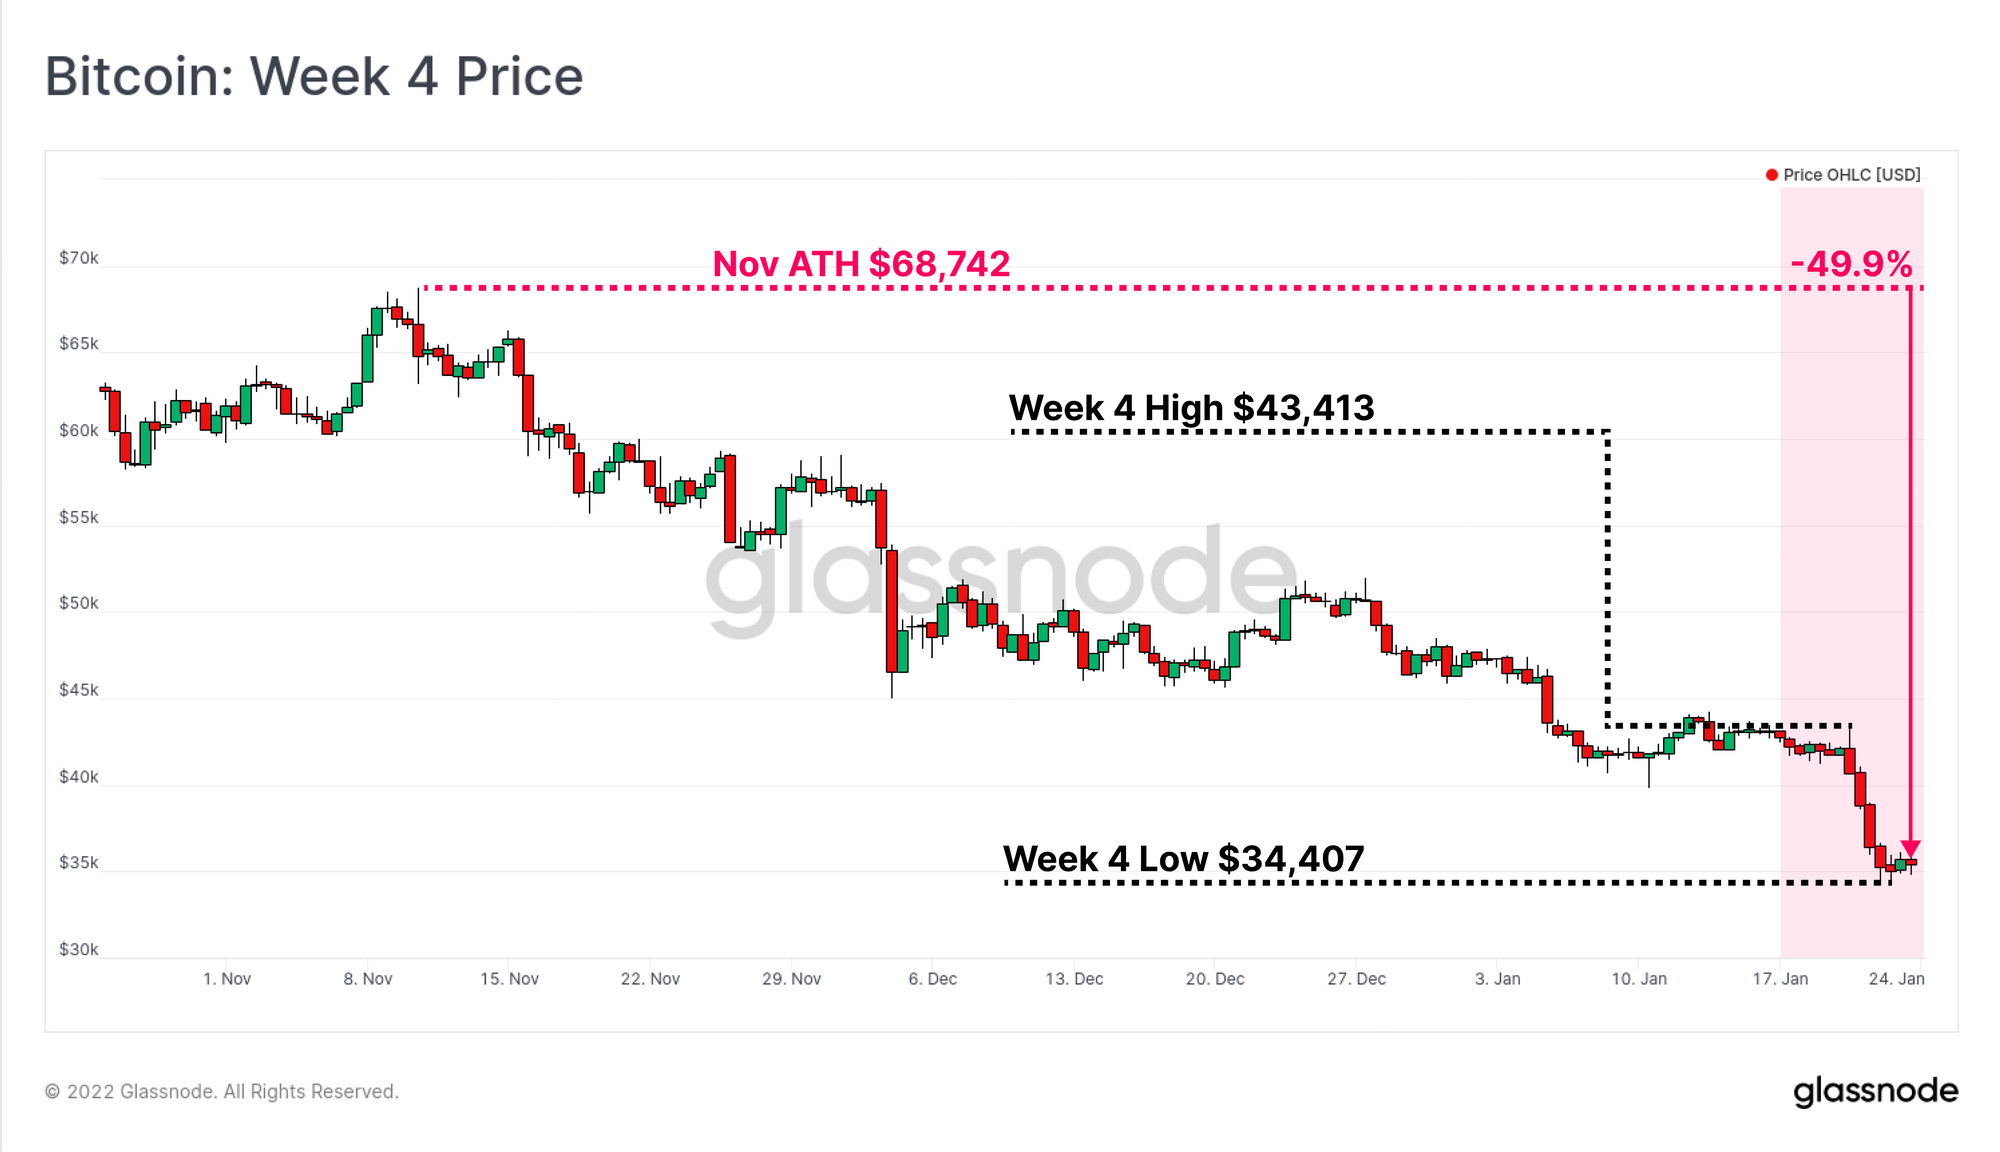
The Bitcoin market has had yet another challenging week, with prices declining from the weekly open of $43,413, down to a new local low of $34,407. This puts the total drawdown relative to the November ATH at 49.9%.
Alongside declining prices, investors have capitulated over $2.5 Billion in net realised value on-chain this week. The lion's share of these losses are attributed to Short-Term Holders whom appear to be taking any opportunity to get their money back.
In this week's newsletter, we will seek to assess the damage, and establish the likelihood that a prolonged bear market is in play. Defining a Bitcoin bear market is no easy task, and in this edition we attempt to add some colour to the debate using historical investor behaviour, and profitability patterns as our guide.
The Week Onchain Dashboard
The Week Onchain Newsletter has a live dashboard with all featured charts available here. This dashboard and all covered metrics are explored further in our Video Report which is released on Tuesdays each week. Visit and subscribe to our Youtube Channel, and visit our Video Portal for more video content and metric tutorials.
Sizing up a Bear
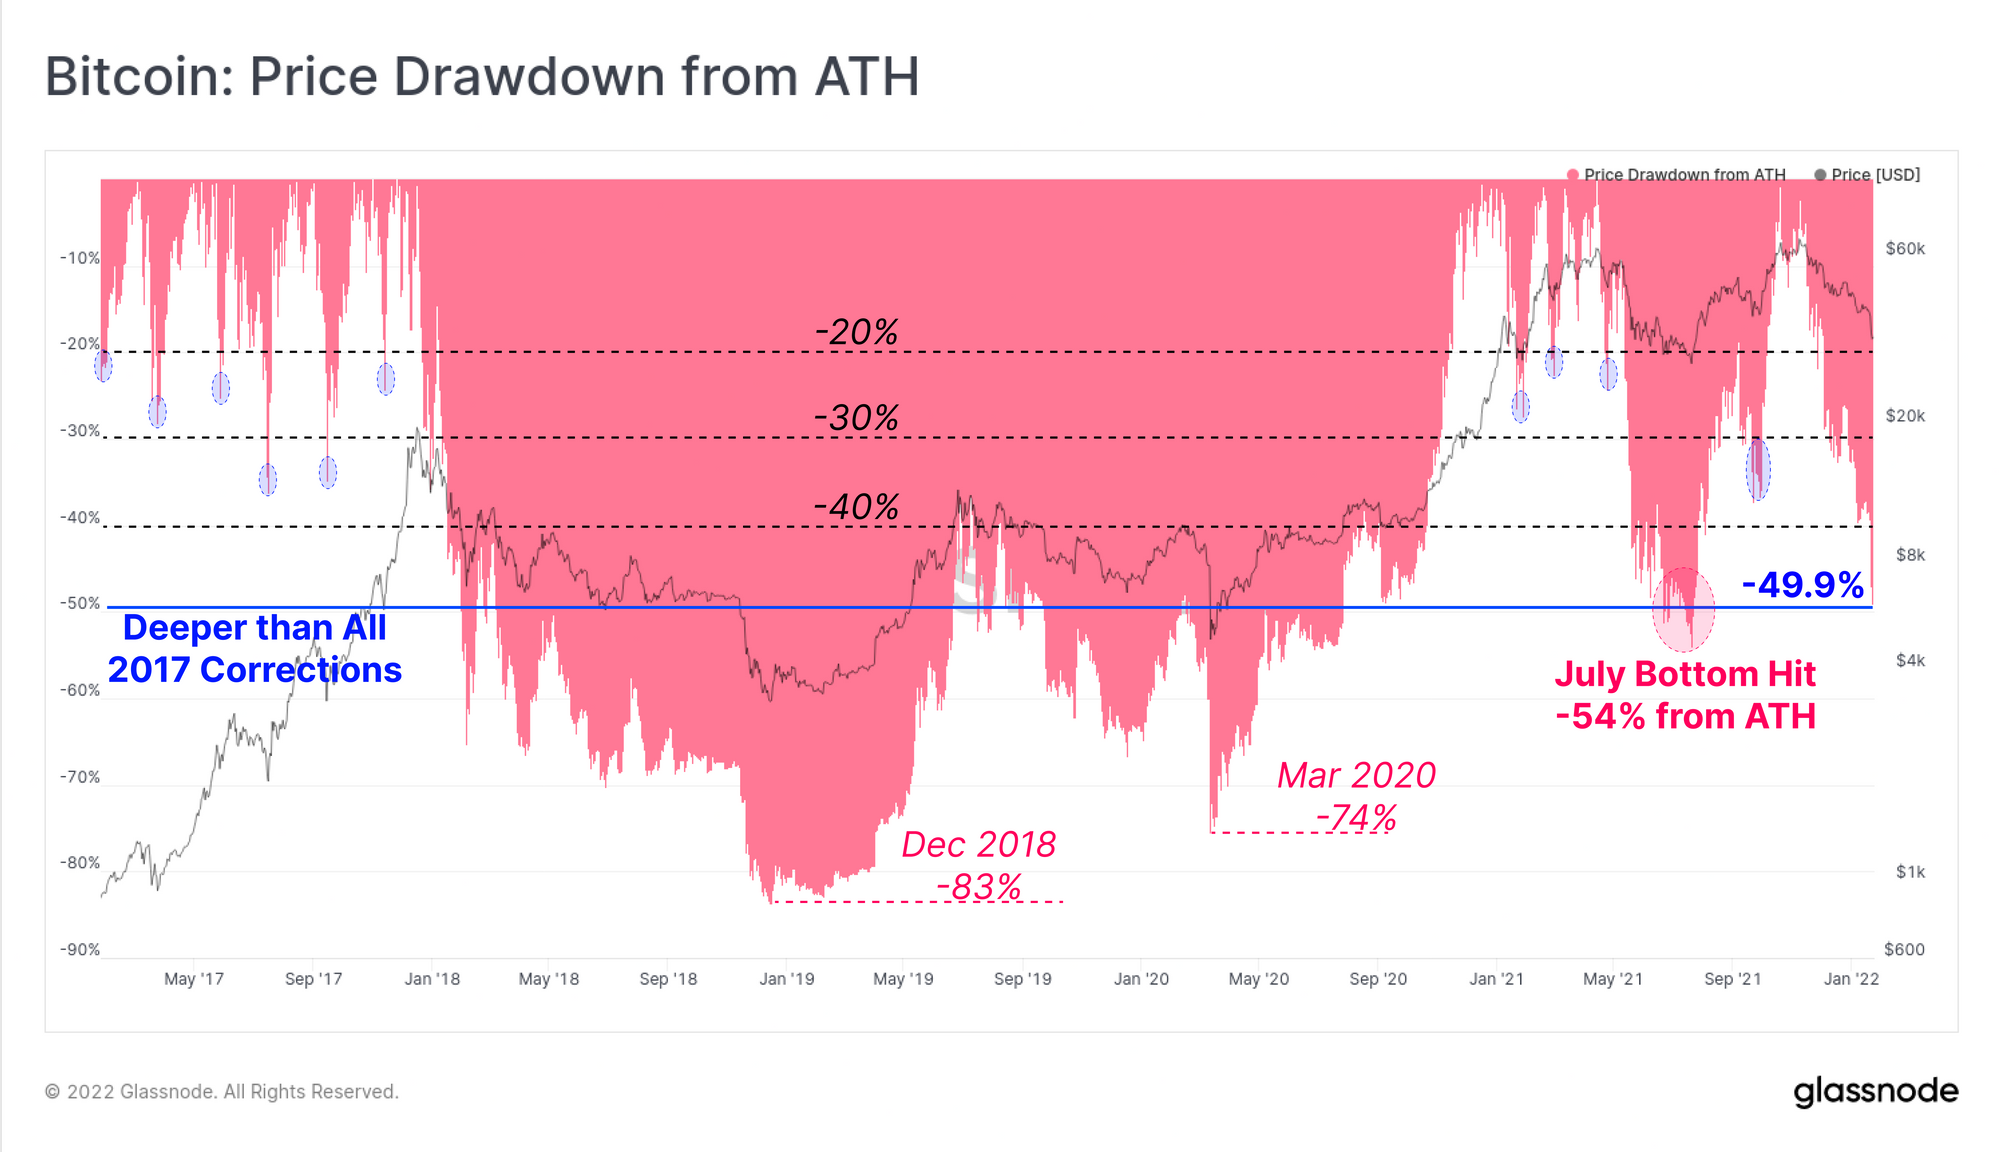
At the weekly low, Bitcoin prices were just shy of being cut in half from the ATH, reaching a total drawdown of 49.9%. This is now the second worst sell-off since the 2018-20 bear market, eclipsed only by July 2021, where the market fell -54% from the highs set in April.
With the bulls now firmly on the back-foot, such a heavy drawdown is likely to change investor perceptions and sentiment at a macro scale. Drawdowns of this magnitude are markedly higher than the -20% to -40% range seen in the 2017 and 2020-21 bull cycle corrections.
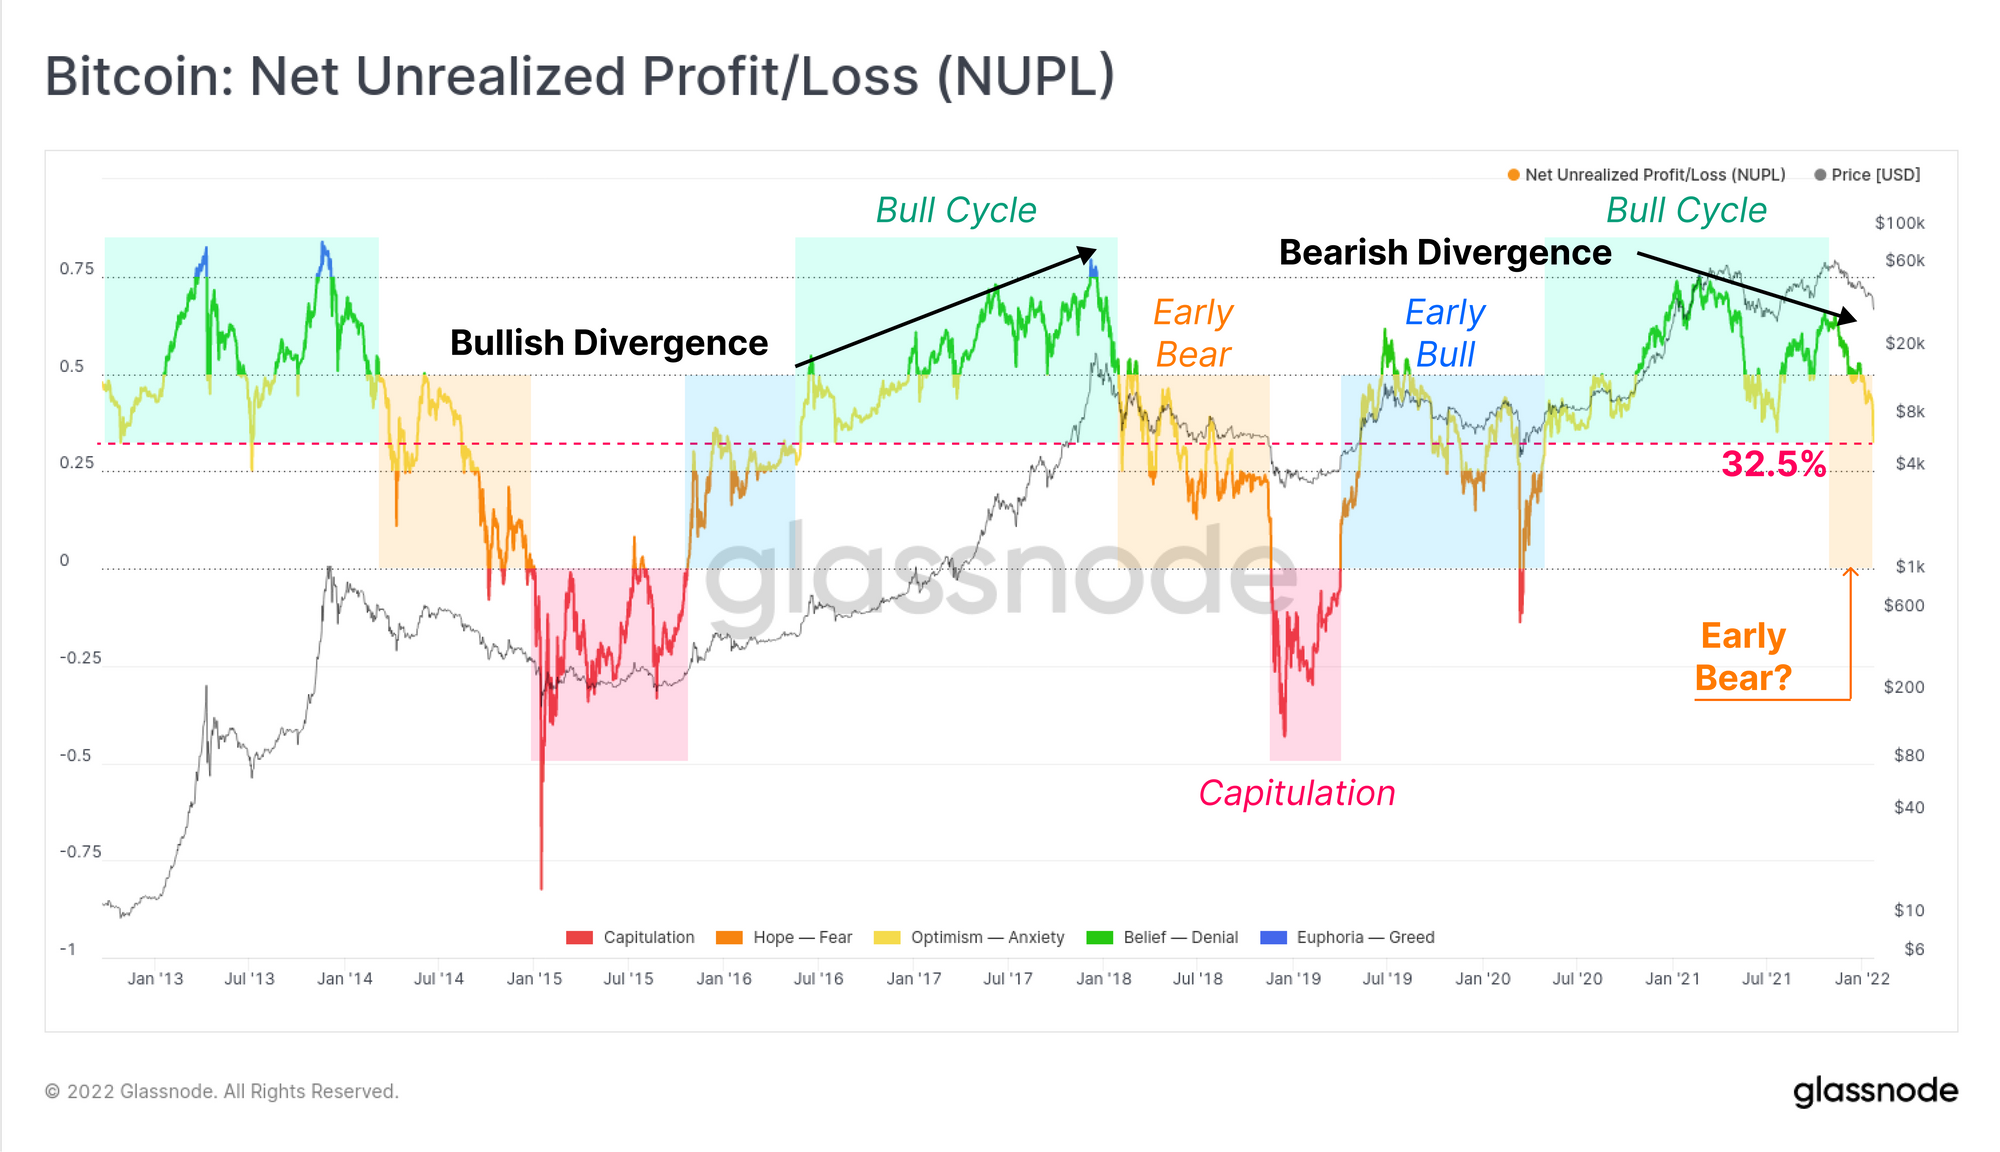
The Net Unrealised Profit/Loss (NUPL) metric presents the overall market profitability as a proportion of market cap. NUPL is currently trading at 0.325 which indicates that an equivalent to 32.5% of the Bitcoin market cap is held as an unrealised profit.
This comes in stark contrast to the much higher profitability values of ~0.75 set in March, and ~0.68 set in October last year. There are a number of indications from this:
- Considering previous cycles, such low profitability is typical in the early to mid phase of a bear market (orange). One could also reasonably argue that a bear market started in May 2021 based on this observation.
- Unlike 2013 and 2017 bull markets, aggregate network profitability actually declined between the ATHs set through Mar-Apr and Oct-Nov tops. This is a result of coins being distributed at the highs, lifting the overall market cost basis, and thus creating a bearish divergence in this indicator.
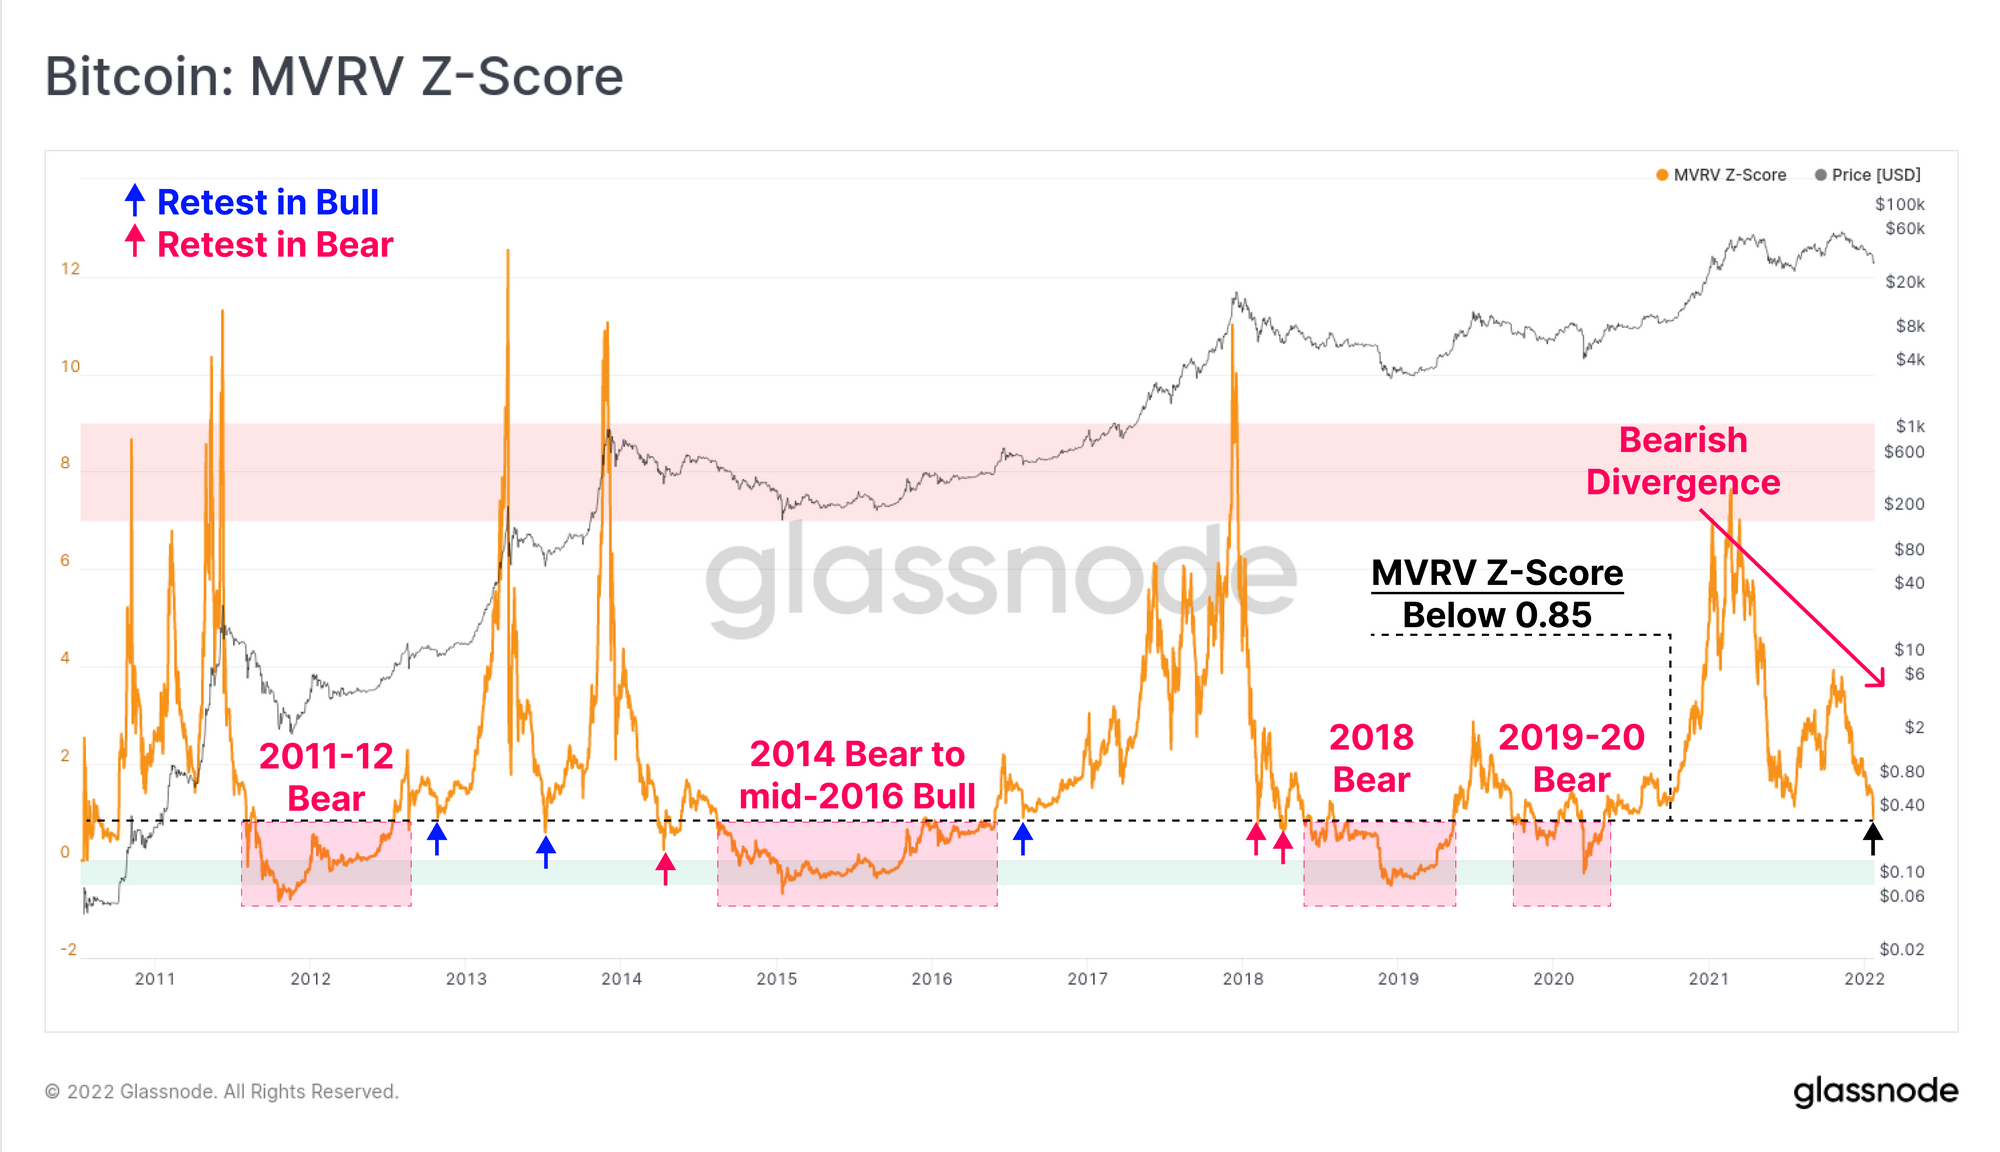
Another measure of network profitability is the MVRV Ratio, presented below as a Z-Score, tracking standard deviations away from the long-term mean. The MVRV Ratio is calculated as the market cap, divided by the realised cap; and is a useful tool for for identifying periods of high, and poor investor profitability.
With a current MVRV-Z reading of 0.85, the market is well within territory visited in bearish markets, and a bearish divergence is noted, similar to the NUPL metric above. Generally speaking, such low values of MVRV-Z are reached in the following cases:
- Steep corrections in bull markets (blue arrows), which are usually followed by a reversal to new highs.
- Early bear markets after blow-off tops (pink arrows), as the market panics, investors capitulate, and also often precedes a strong relief bounce.
- Mid-to-late bear markets (red boxes) where MVRV-Z trades below 0.85, signifying a period of very poor profitability, low sentiment, and sustained investor loses.
By this metric, the bulls either need to step up in a big way, else the probabilities favour the bears. That said, a relief bounce in the near term is also probable if history is to act as a guide.
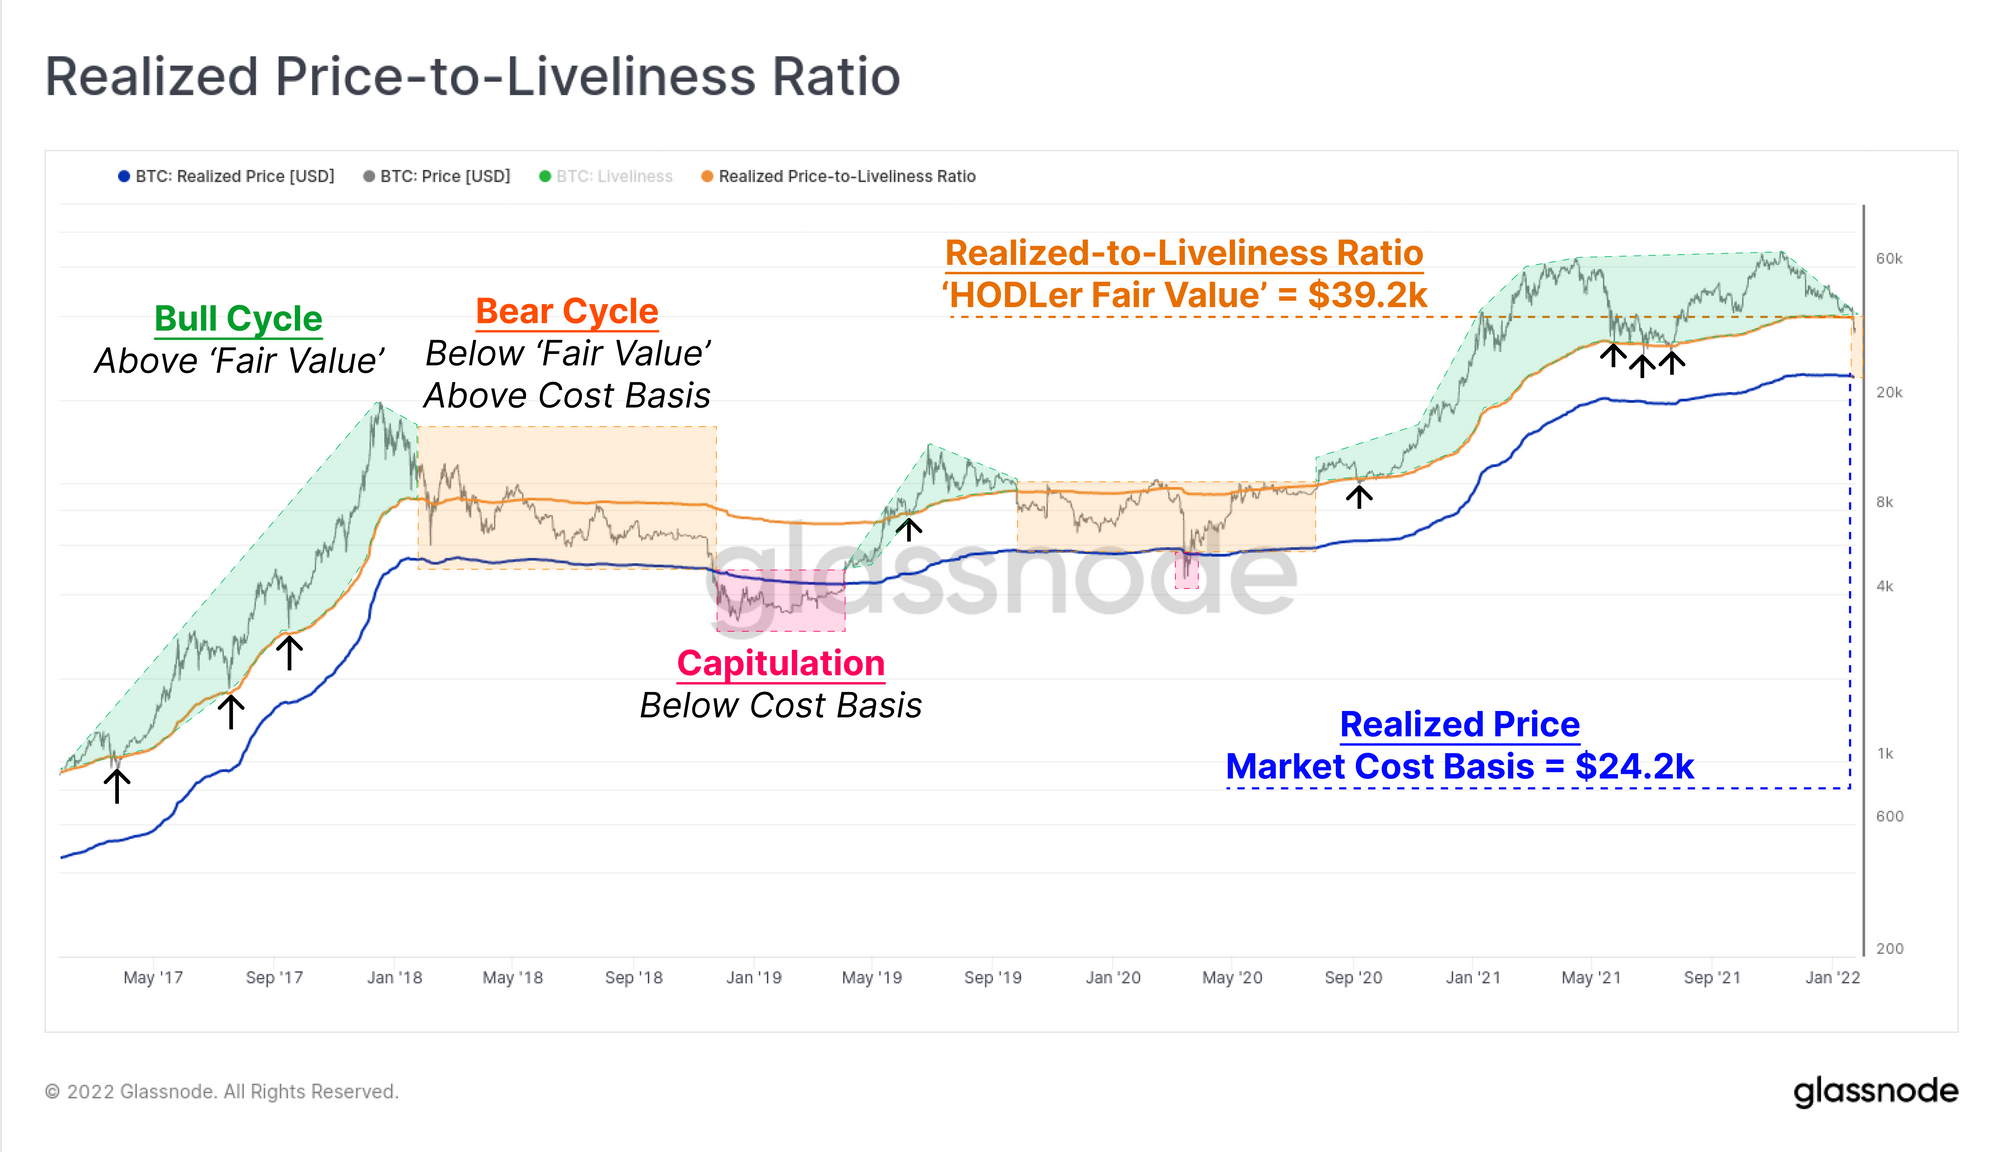
A recently developed on-chain tool is the Realised-to-Liveliness Ratio (RTLR) by Dor Shahar, who a modified the Realised Price using Liveliness in the denominator. It can be though of as a 'Hodler fair value' model, and is designed to amplify, or discount the Realised Price as follows:
- RTLR will indicate a higher fair value for Bitcoin when HODLers are accumulating and keeping coins dormant (fair value > cost basis).
- RTLR will converge to the Realised Price as more HODLers liquidate and distribute their coins (fair value = cost basis)
In the chart below, we can see that the market is now trading below the RTLR price of $39.2k, but above the Realised price of $24.2k. Again, this is often observed during early to mid stage bear markets, adding confluence to the observations above.
Assessing The Damage
We have now established that numerous signals point to a macro scale bear trend in play. With this as prologue, we now turn to investor spending patterns, where the week was punctuated by investors capitulating significant losses onchain.
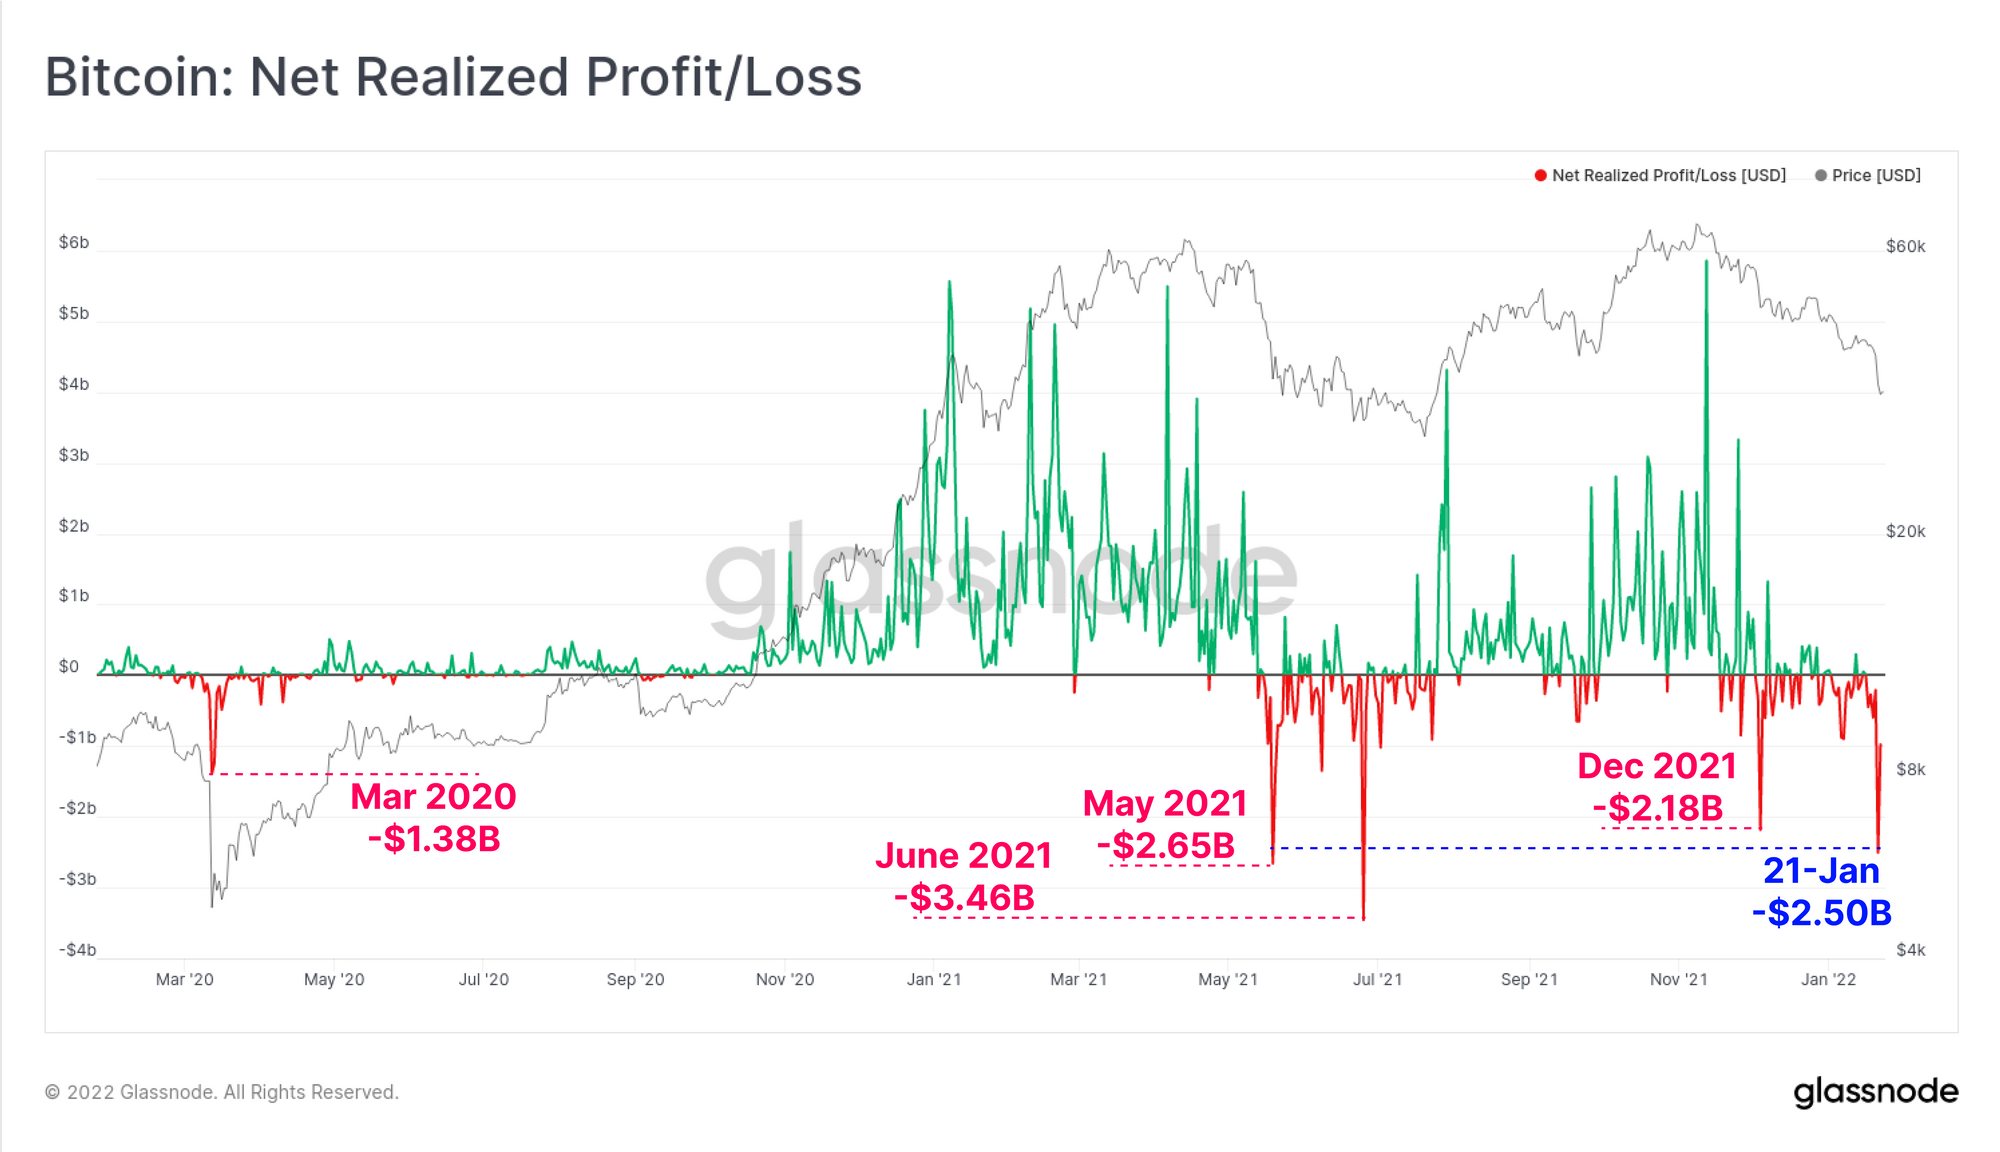
The Net Realised Profit/Loss metric tracks the amount of market wide profit, minus loss realised by on-chain spending. This provides a measure of daily capital flowing in and out of the Bitcoin network.
As the market traded down to the weekly lows on Saturday, over $2.5 Billion in net losses were realised, with investors spending coins held at a loss. This marks the largest capitulation event of this drawdown, and almost matches the $2.61 Billion net loss from May 2021 (read our analysis of that sell-off here).
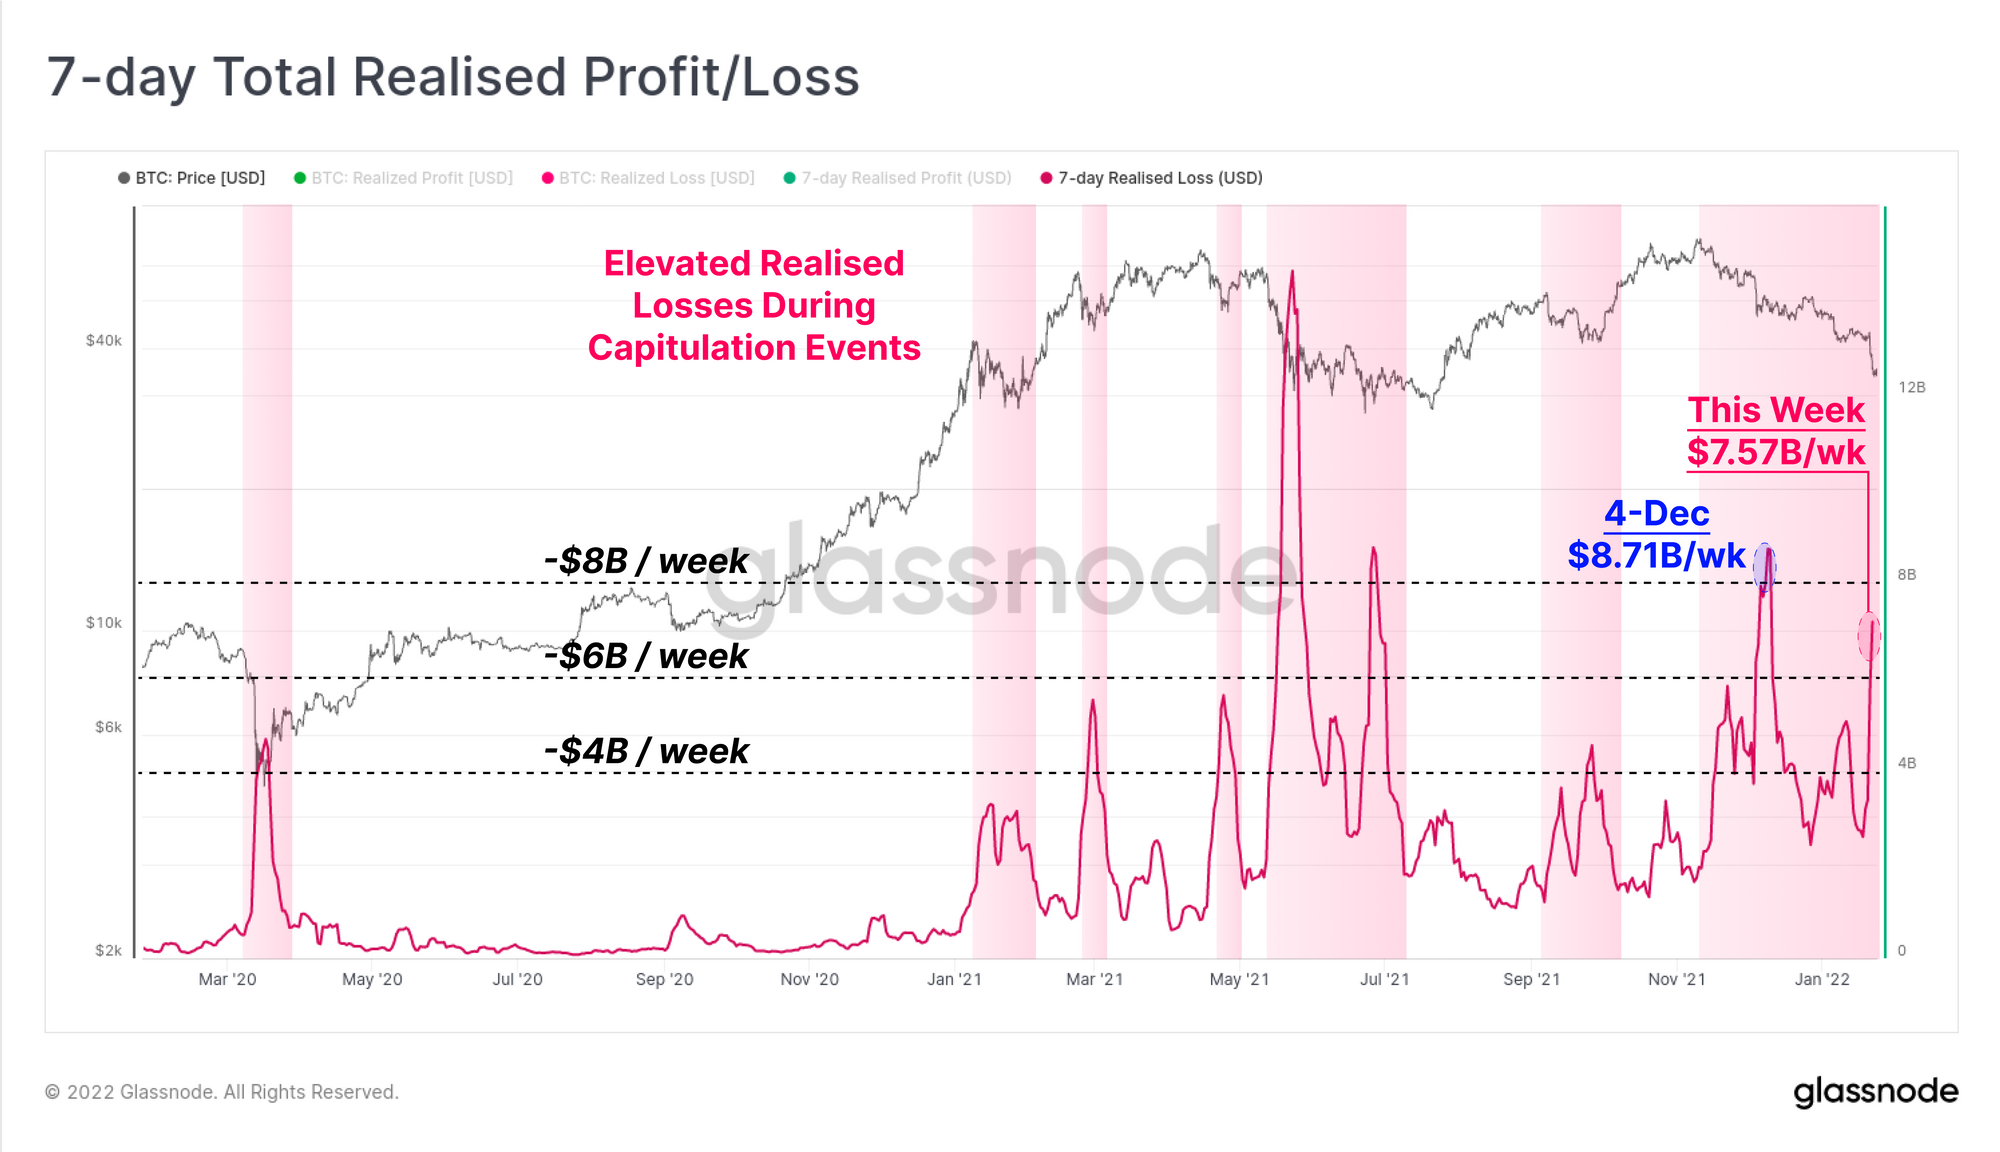
Over the last 7-day period, the total sum of realised losses has now exceeded $7.57 Billion, again in a similar ballpark to major capitulation events over the past 12 months. It can be seen in the chart below that large realised loss events typically correlate with local market lows, as investors who bought the recent top capitulate, and stronger hands and traders drive the market into a relief rally.
Note however that the current drawdown has seen sustained and elevated losses since early November, indicating that this correction has been a particularly painful one.
Short-Term Pain...For Long Term Gain?
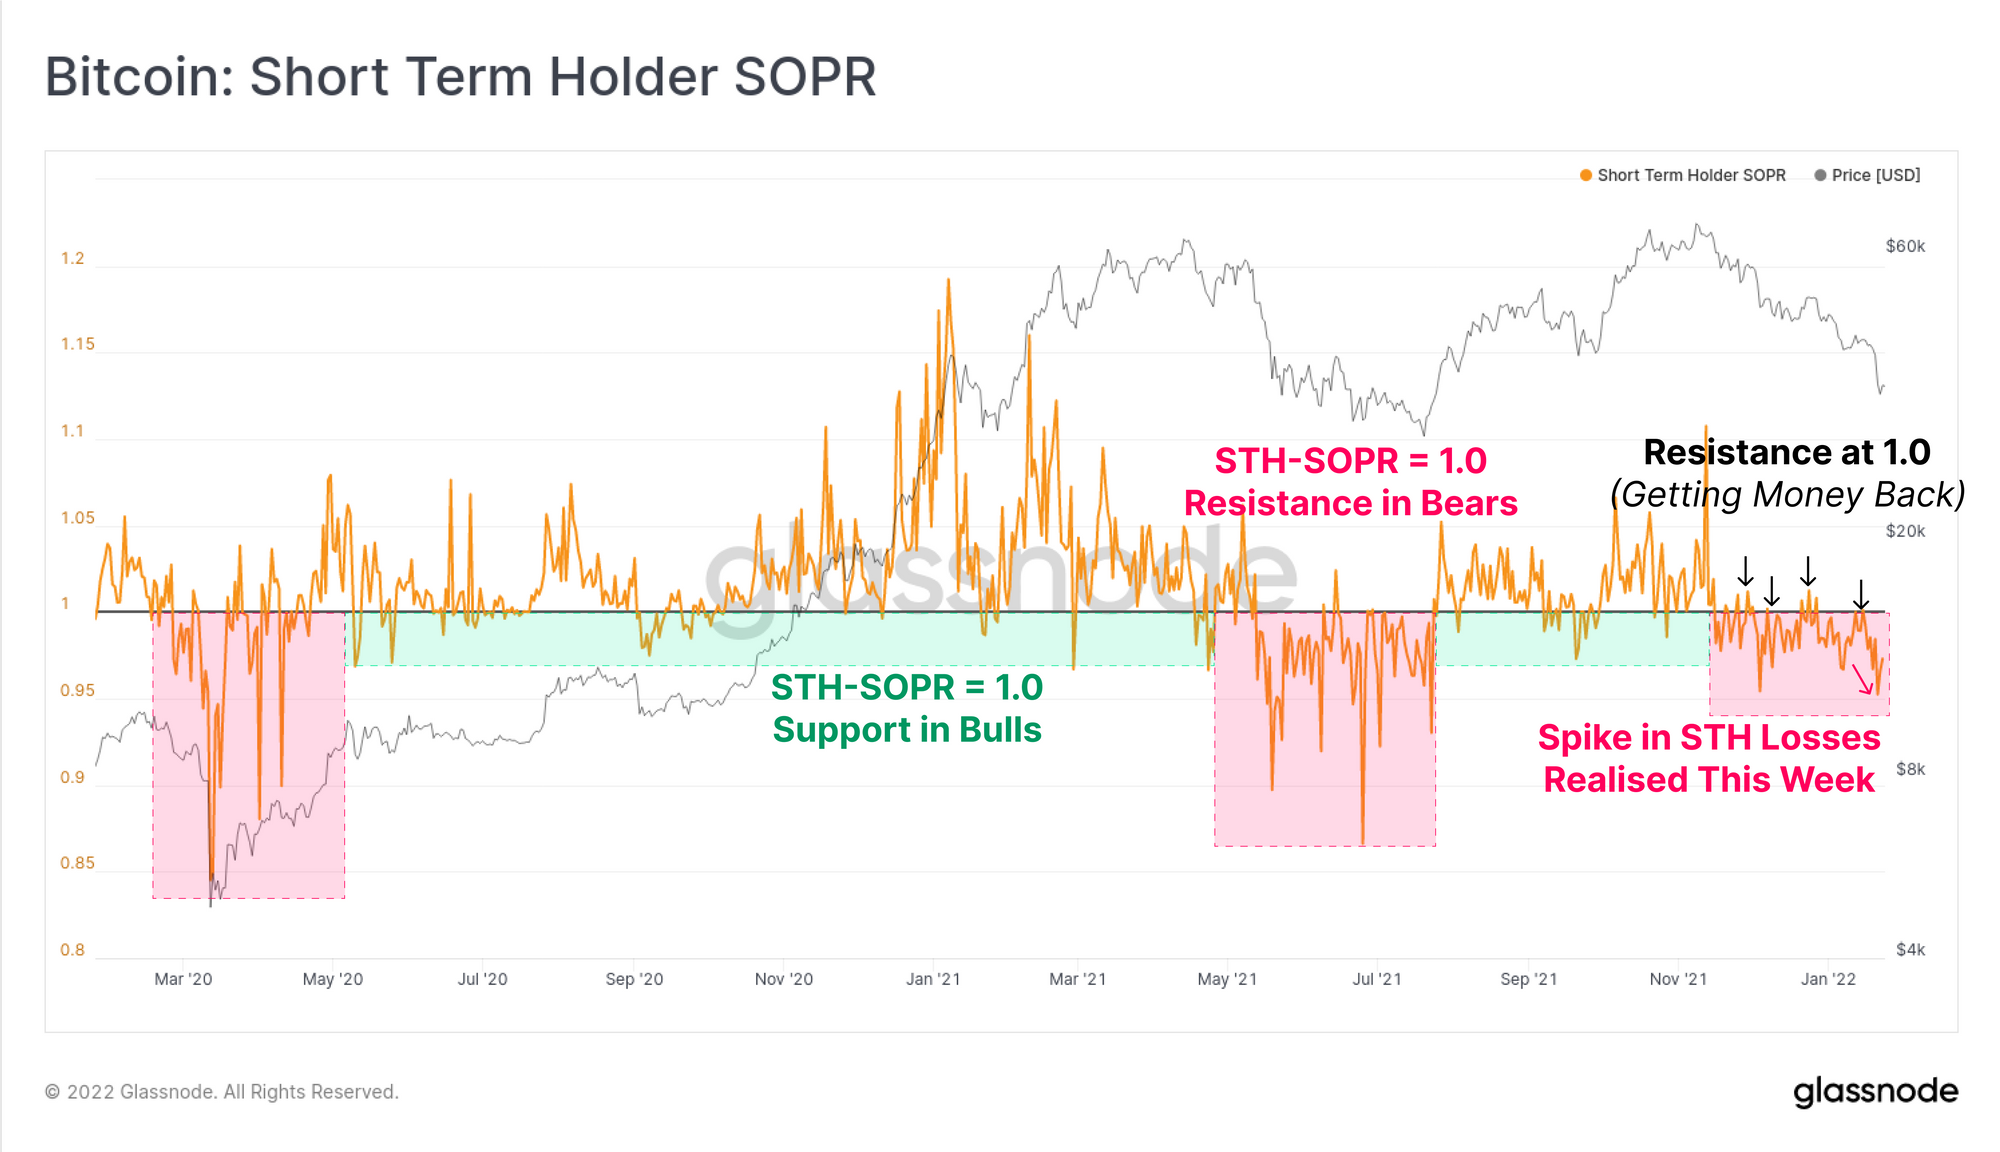
Looking at the cross-sections of investors whom realised the majority of these losses, we can determine that it is largely the Short-Term Holder (STH) cohort. Coins are considered to be owned by STHs when they are younger than ~155-days, and are statistically more likely to be spent in the face of volatility.
The STH-SOPR metric has accelerated downwards this week, after finding resistance at a value of 1.0 throughout this drawdown. Psychologically, this suggests that recent buyers are taking exits at, or below their cost basis to 'get their money back', creating sell-side pressure and resistance. Lower values indicate heavier losses are taken by STHs, who in this instance are disproportionately top buyers.
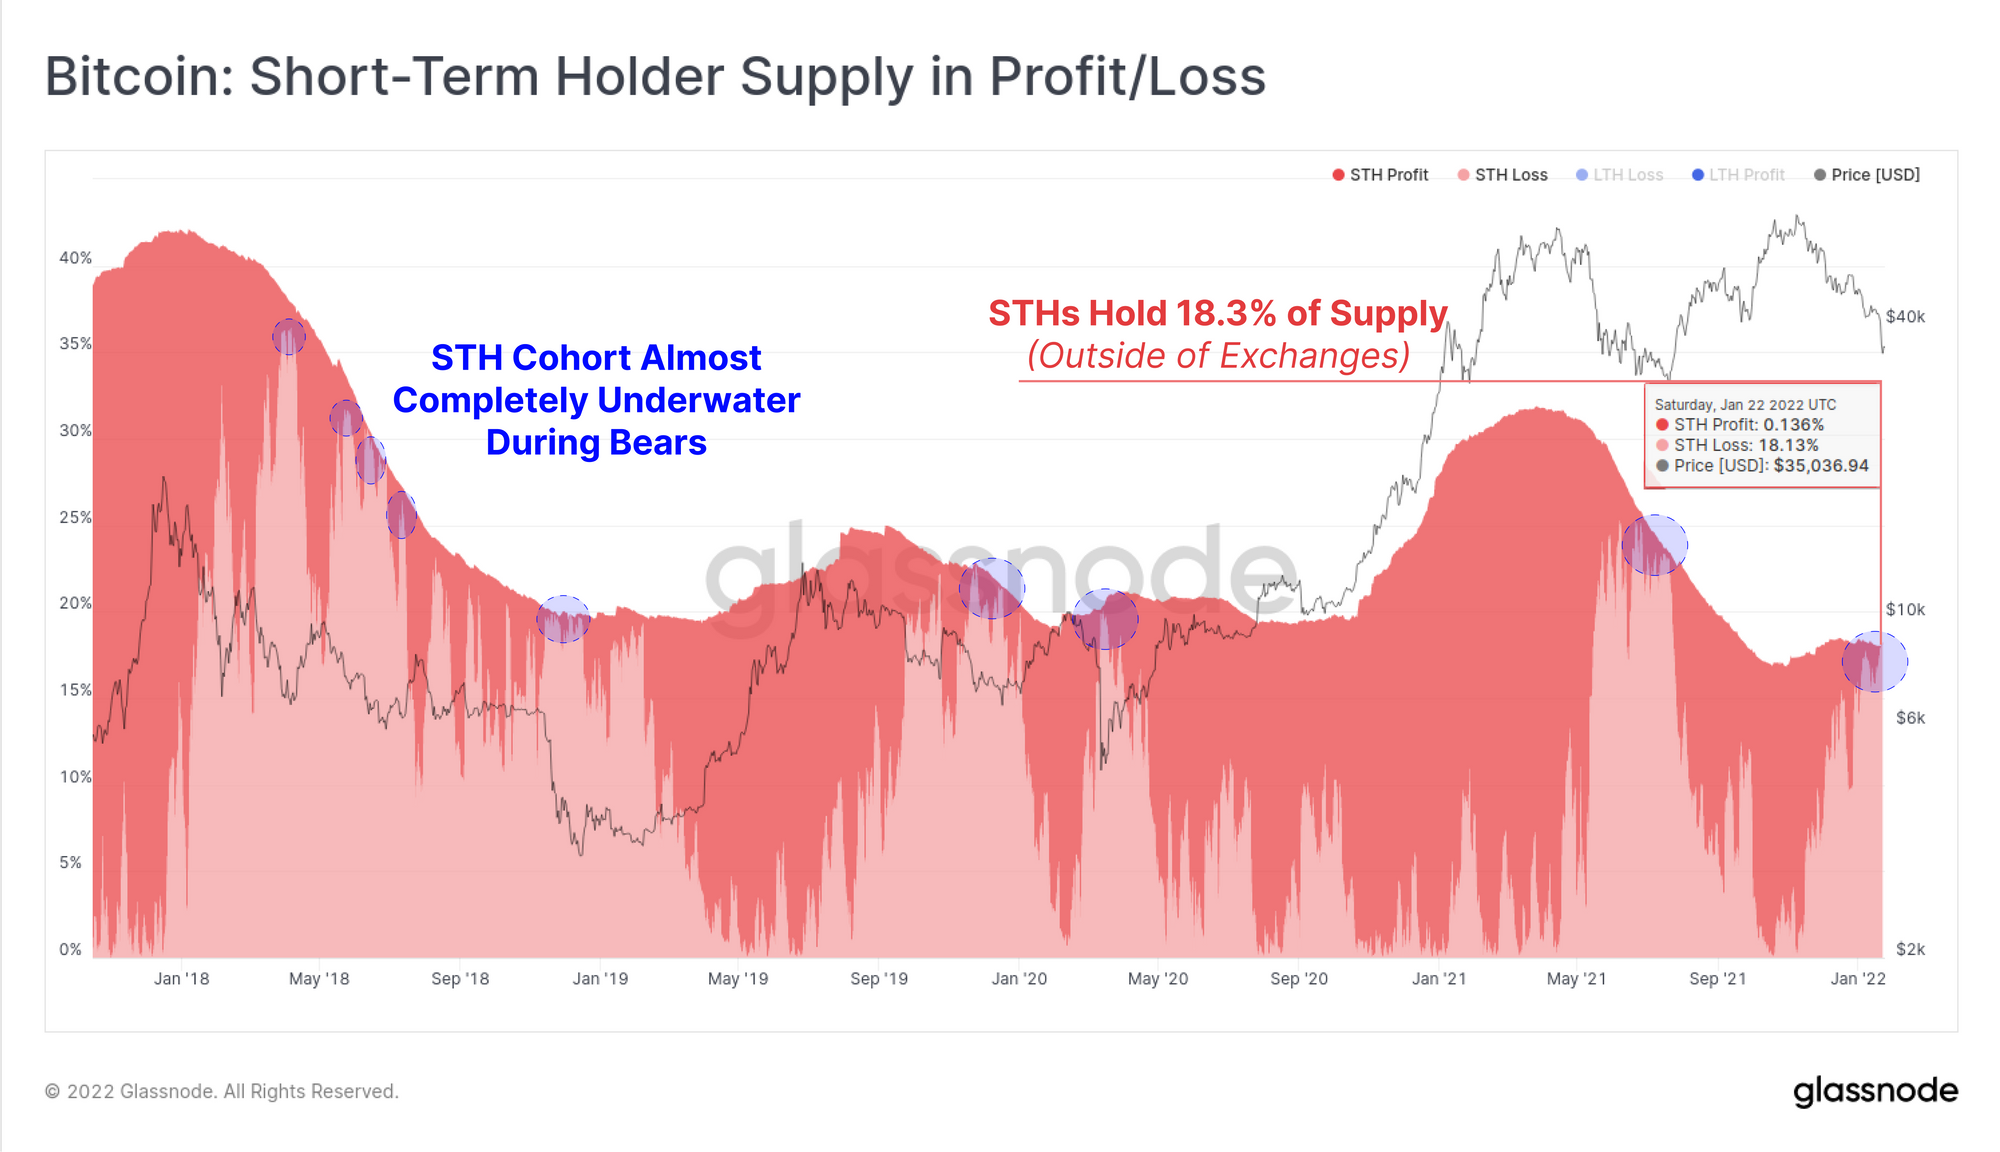
Assessing the supply dynamics, we can see that Short-Term Holders are currently in possession of approximately 18.3% of the coin supply (excluding coins held by exchanges). The light red area in the chart below represent the proportion that are currently held at a loss, and as of this week, almost the entire STH supply is underwater.
This yet again creates a psychological barrier whereby the coins that are already the most likely to be spent and sold, are now also holding an unrealised losses, which further increases the chances of a sale.
Interestingly, STH supply remains near multi-year lows, which is indicative of their counter-part, the Long-Term Holders (LTHs), who appear impressively unfazed by such a severe drawdown.
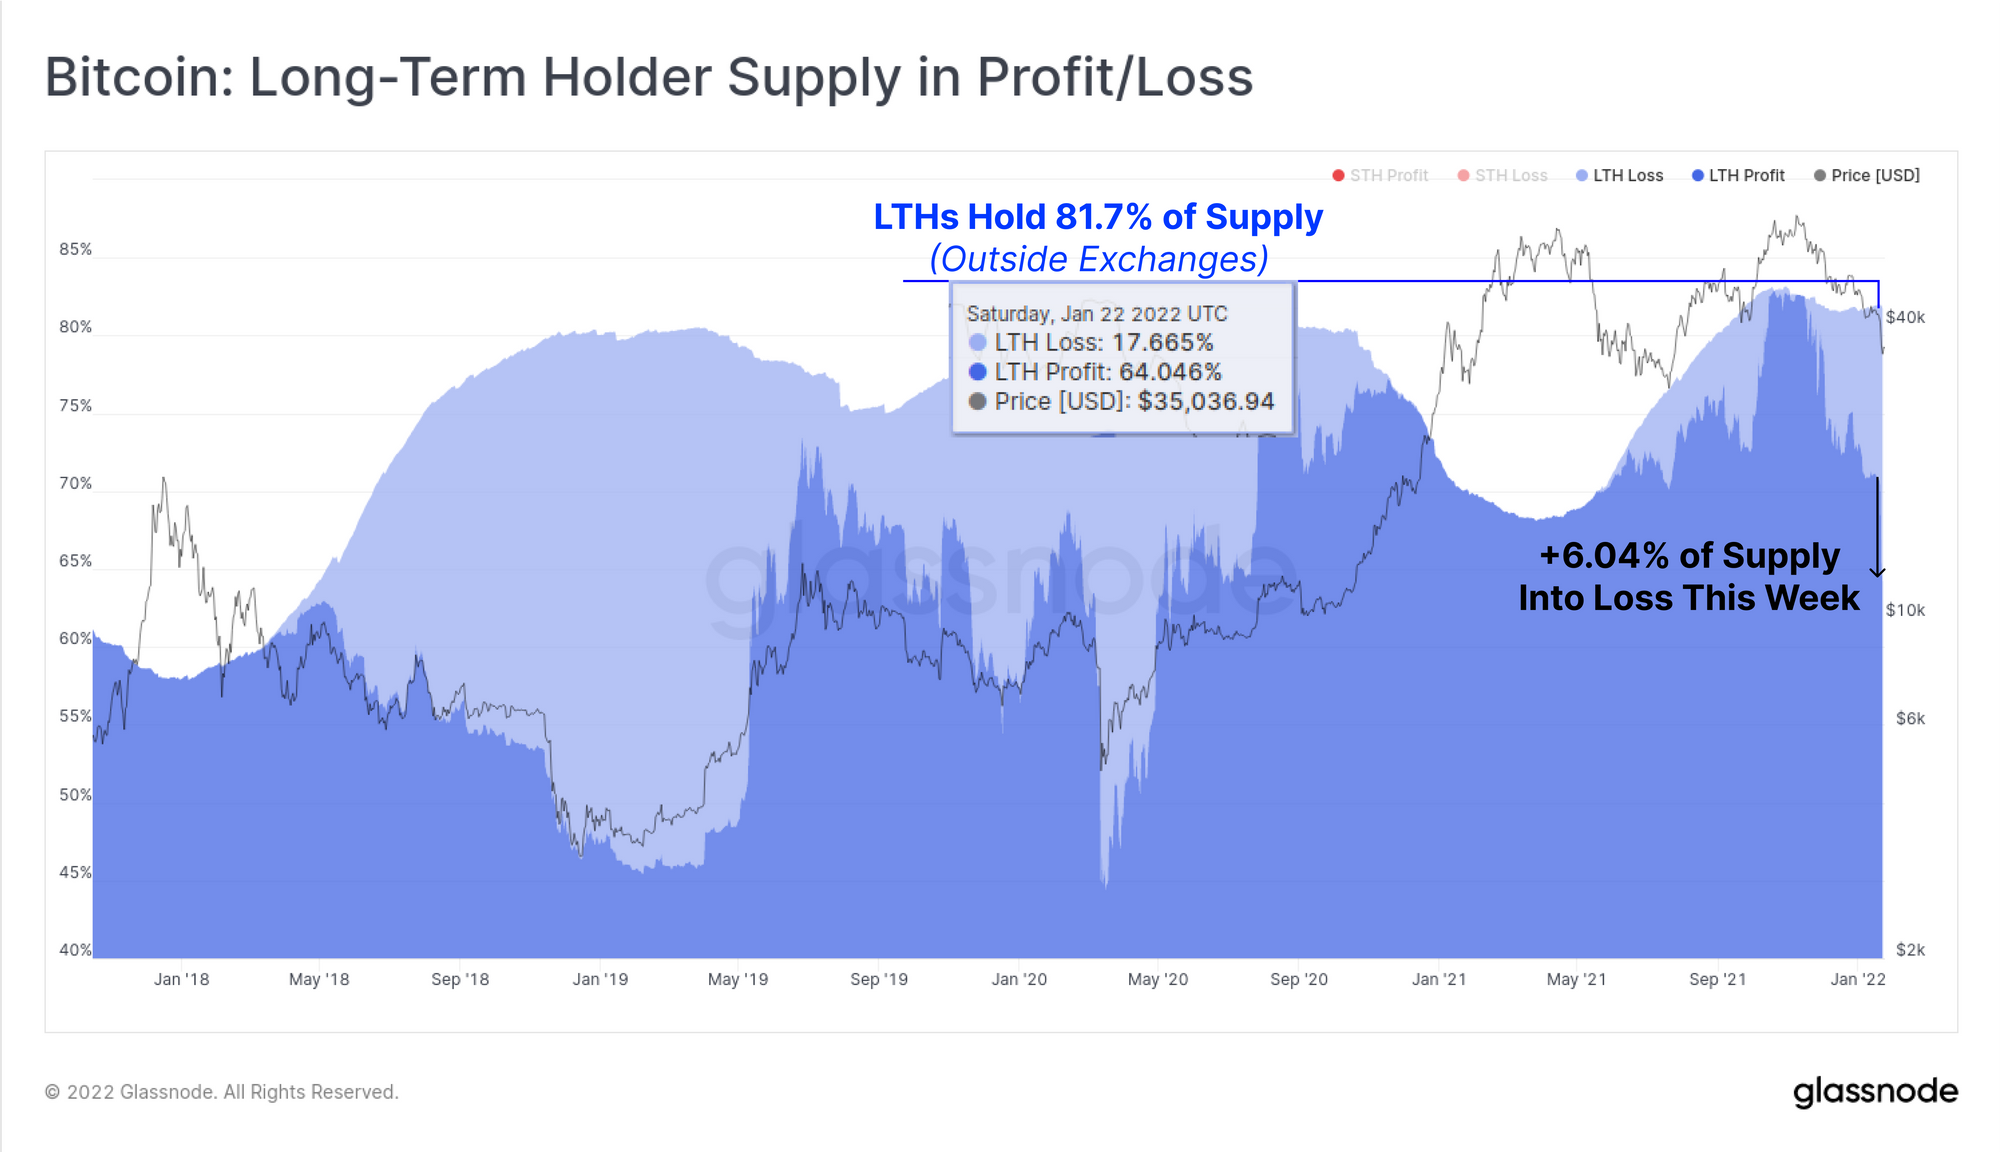
The proportion of LTH supply has actually returned to a modest uptrend, which indicates a general unwillingness for this cohort to liquidate. Faced with what looks like a bear market, LTH coins are firmly in cold storage, which remains a constructive undertone.
Like STHs, the LTH cohort are not without financial pain, with 6.04% of the 81.7% supply held by LTHs falling into an unrealised loss this week. This is the highest volume of LTH supply held at a loss since the March 2020 sell-off.
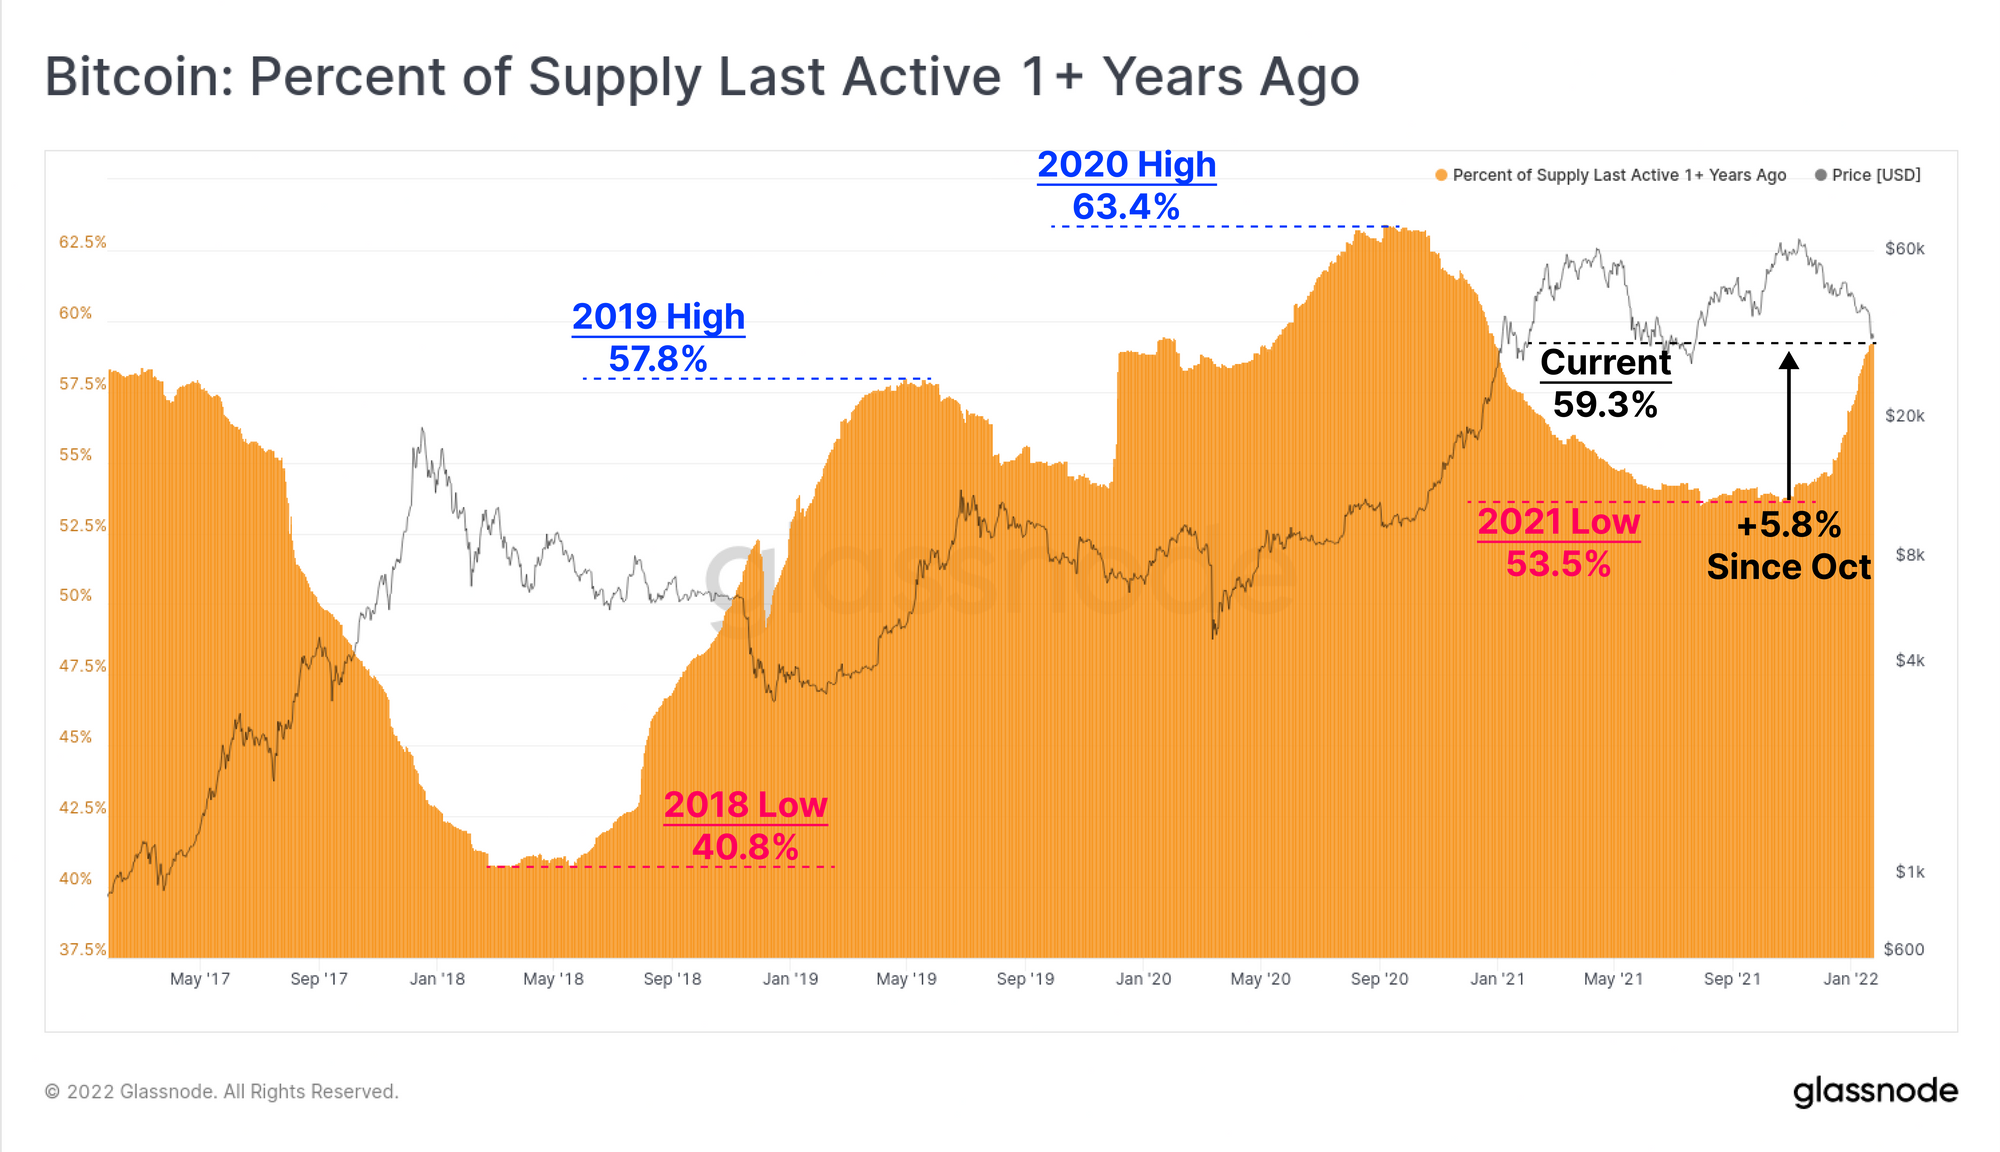
And finally, to close out our analysis for the week, we highlight that the total coin volume older than 1yr has been on a remarkable ascent since October. Over 59.3% of the circulating supply has now been dormant for over 1yr, increasing by 5.8% of circulating supply in the last three months.
These coins reflect those last moved onchain between Oct 2020, and Jan 2021 during the early, and more exciting phase of the bull cycle. Whilst a rising, and large proportion of mature coins is generally considered constructive, it once again bears similarities to a bear market, a time when only the HODLers and patient accumulators remain.
Summary
Bear markets are hard to define in Bitcoin, as the traditional 20% drawdown metric would trigger a bear almost every second Tuesday given the volatility. Thus we look to investor psychology and profitability as a gauge of likely, and actualised sell-side activity.
What we identified this week are significant realised losses, a steep drawdown, a return to HODLer led accumulation, and top buyers taking any opportunity to get their money back. If it looks like a bear, and walks like a bear, it could very well be a bear. But as with many things over the last two years...could this time different?
This is a question we will continue to explore over the coming weeks. See you then.
Surveying the 21-Jan Sell-off
In this video analysis, we use both on-chain, and off-chain derivatives metrics to identify and explain the mechanics driving recent downside price-action. When markets sell-off, we can use these tools to investigate which cohorts of coin holders are spending, and whether a leverage flush out is occurring in futures markets.