Range-Bound Under Pressure
Bitcoin has broken below the True Market Mean (~$79k), entering a defensive range between $79k and the Realized Price (~$54.9k). Spot flows and ETF demand remain weak, accumulation is fragile, and options positioning shows panic hedging fading, but not renewed bullish conviction.


Executive Summary
- Bitcoin has slipped below the True Market Mean (~$79k), with the Realized Price (~$54.9k) defining the lower structural boundary. In the absence of a macro catalyst, this range is likely to frame the mid-term environment.
- Sell pressure continues to be absorbed within the $60k–$69k demand cluster formed in H1 2024. The Holder conviction at breakeven has supported a transition into consolidation.
- Accumulation has shifted from strong distribution (<0.1) toward a fragile balance (~0.43). A sustained recovery would require renewed large-entity accumulation.
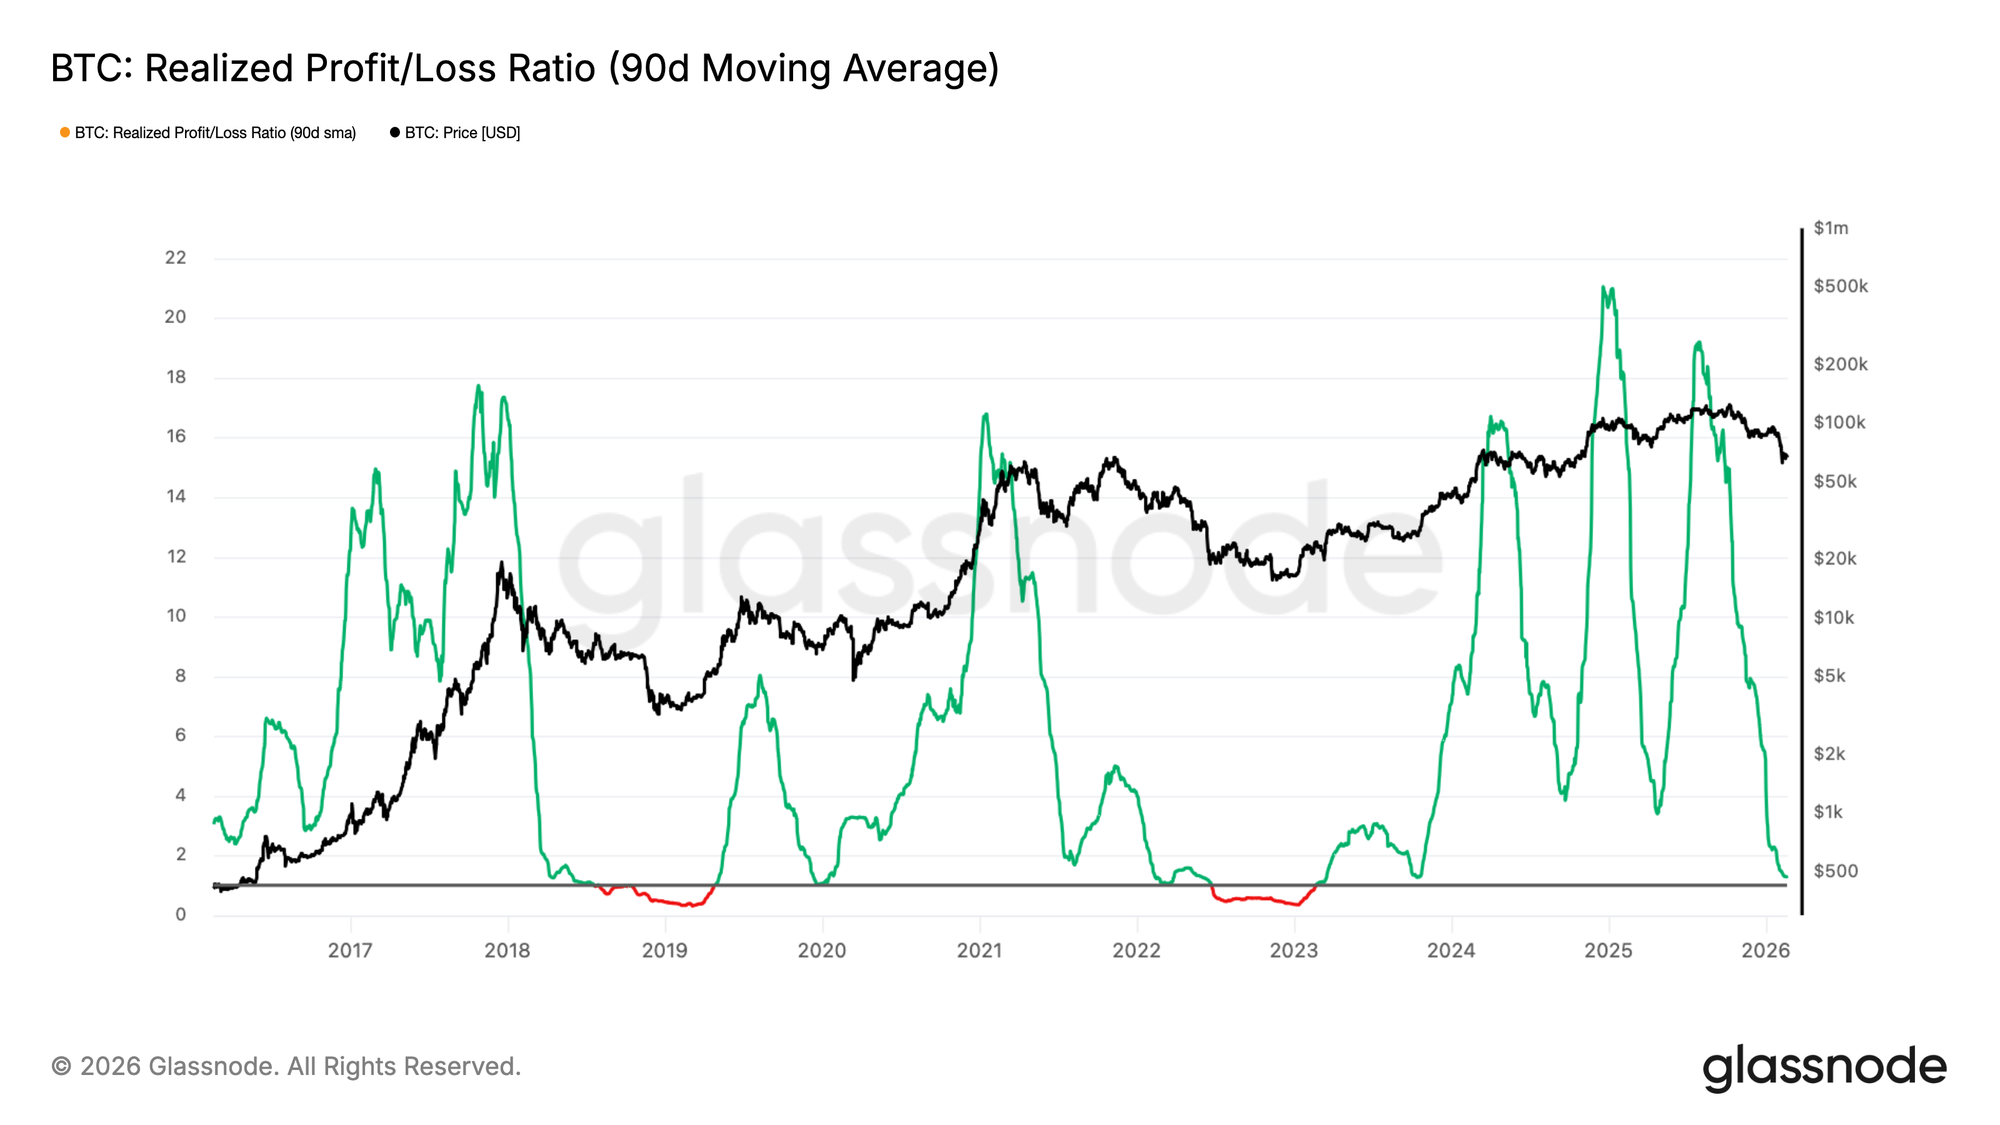
- Liquidity remains constrained, with the 90D Realized Profit/Loss Ratio stuck between 1–2. Capital rotation is limited, and the broader backdrop remains cautious.
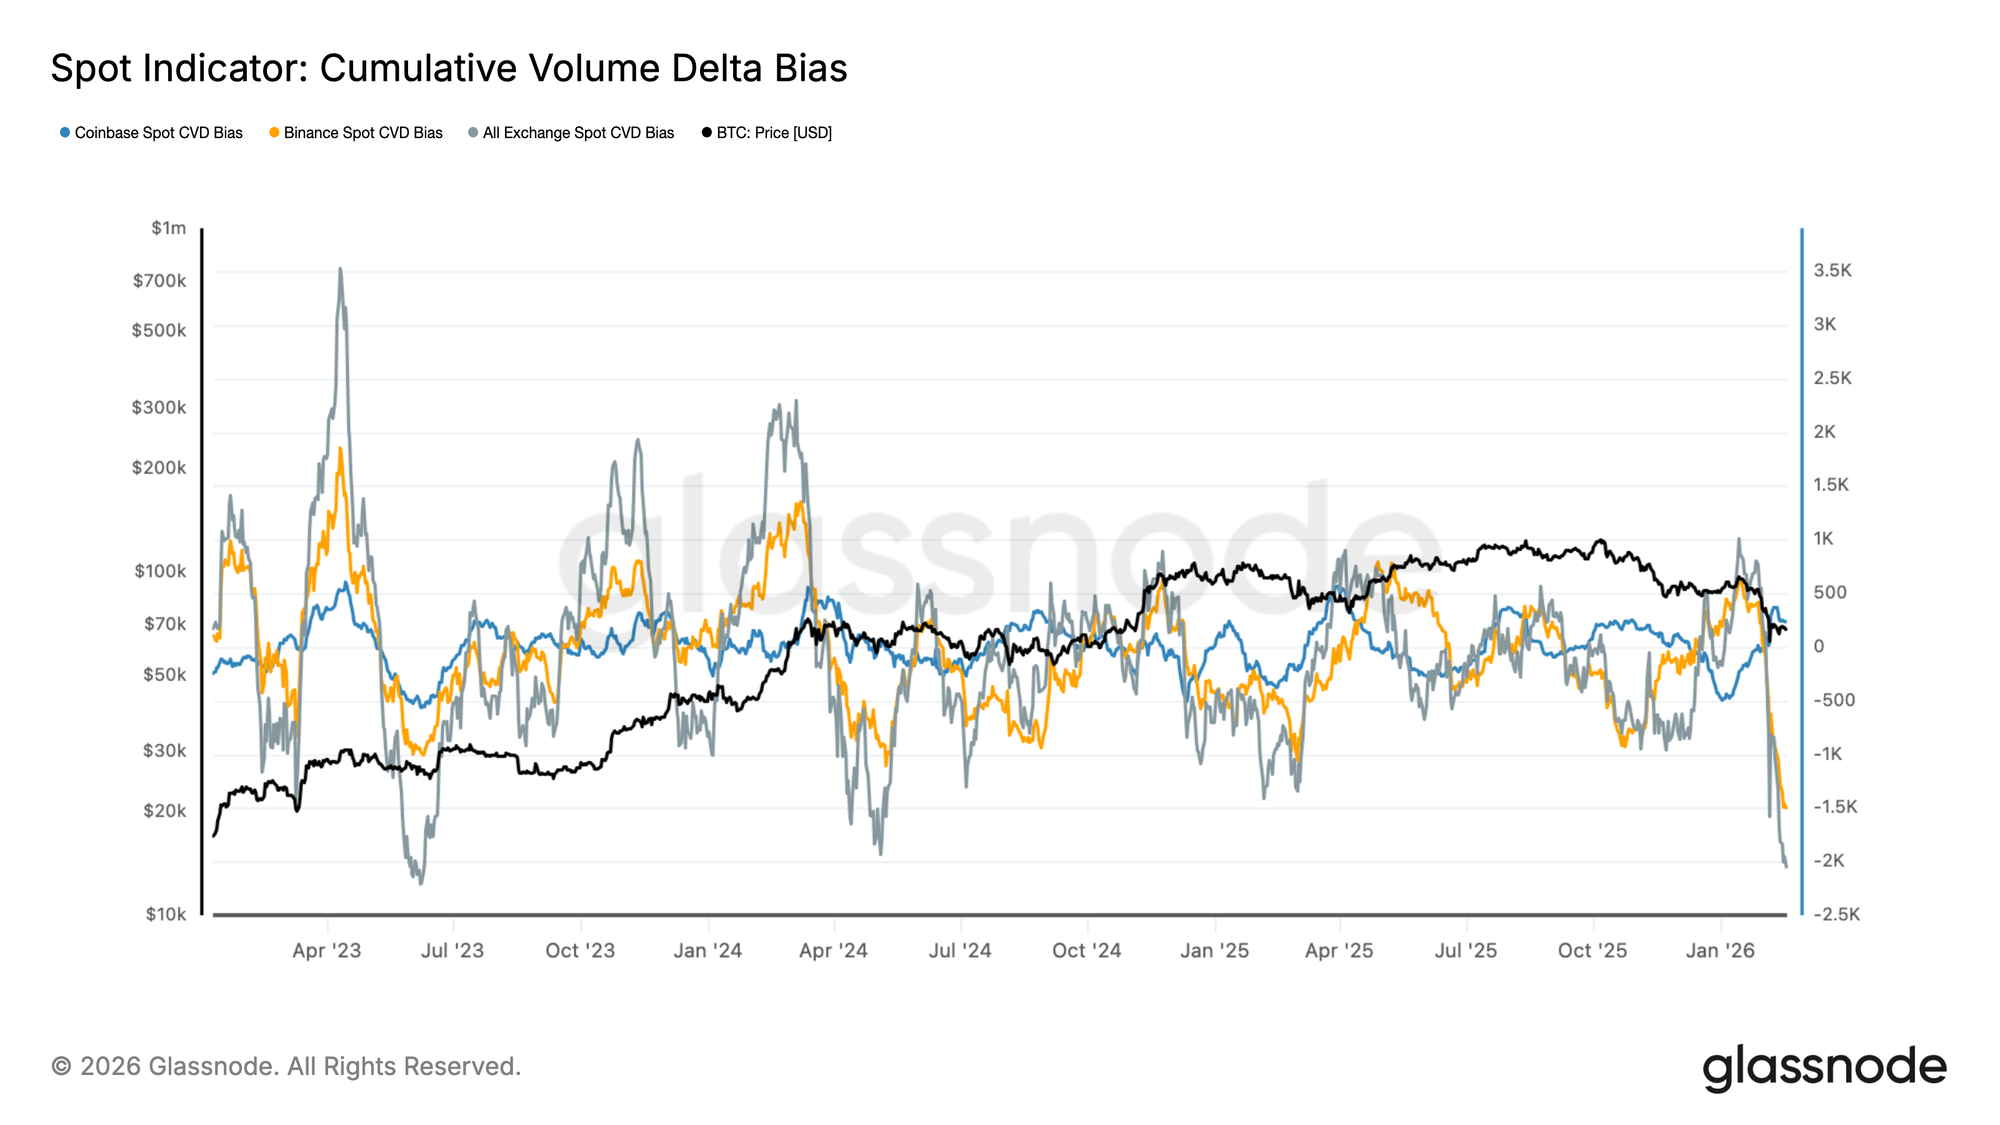
- Spot CVD has turned firmly negative across major venues, reflecting active sell-side aggression. Organic demand has yet to show consistent absorption.
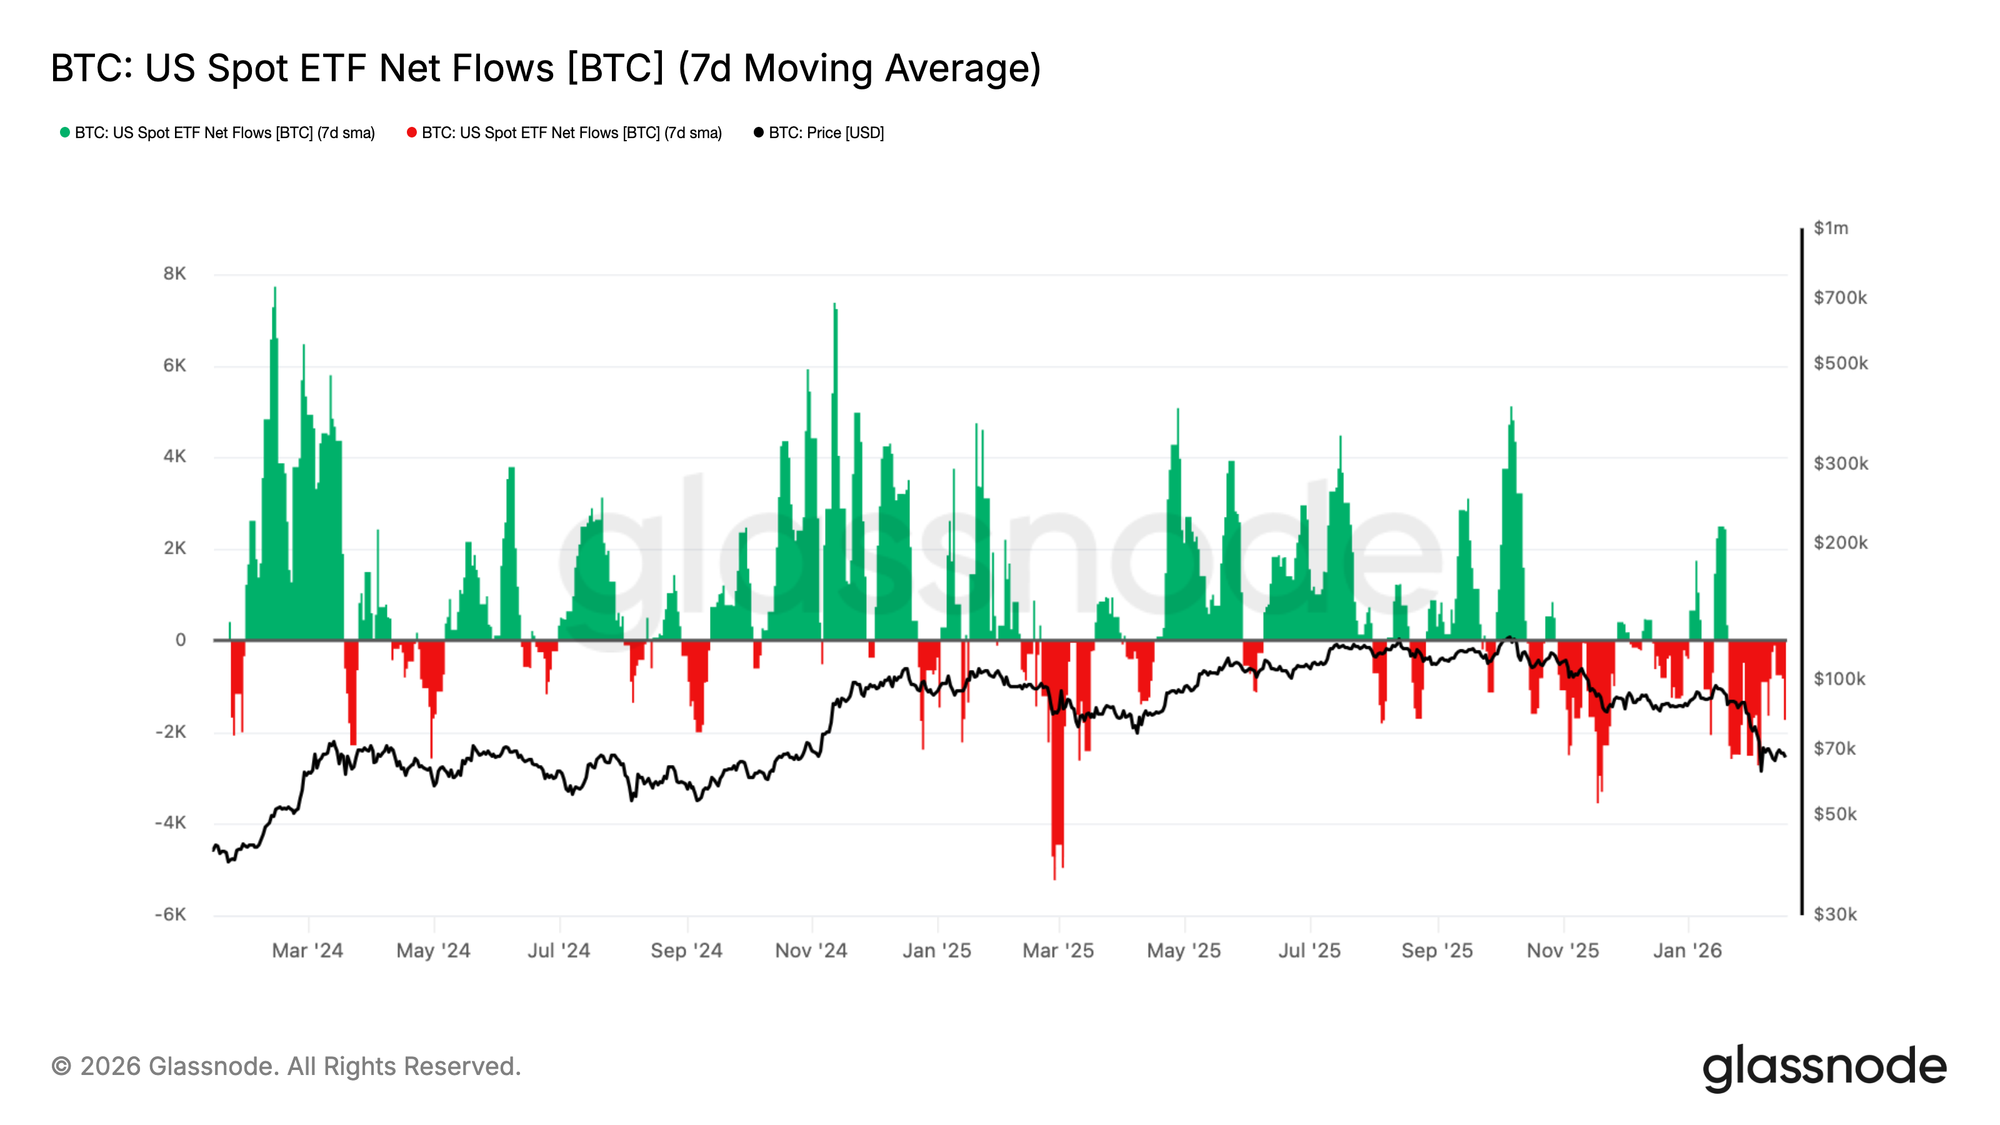
- ETF flows have rotated back into persistent outflows, removing a key structural bid. Institutional demand is no longer cushioning downside.
- Implied volatility and 25-delta skew have compressed, signalling that extreme crash hedging has eased. However, positioning remains defensive rather than constructively bullish.
- The volatility risk premium is normalizing as realized volatility remains elevated and implied retraces. Panic-driven flows are fading, with markets shifting toward range-bound expectations.
This report is also available for download in PDF format.
On-chain Insights
Defining the Bear Market Range
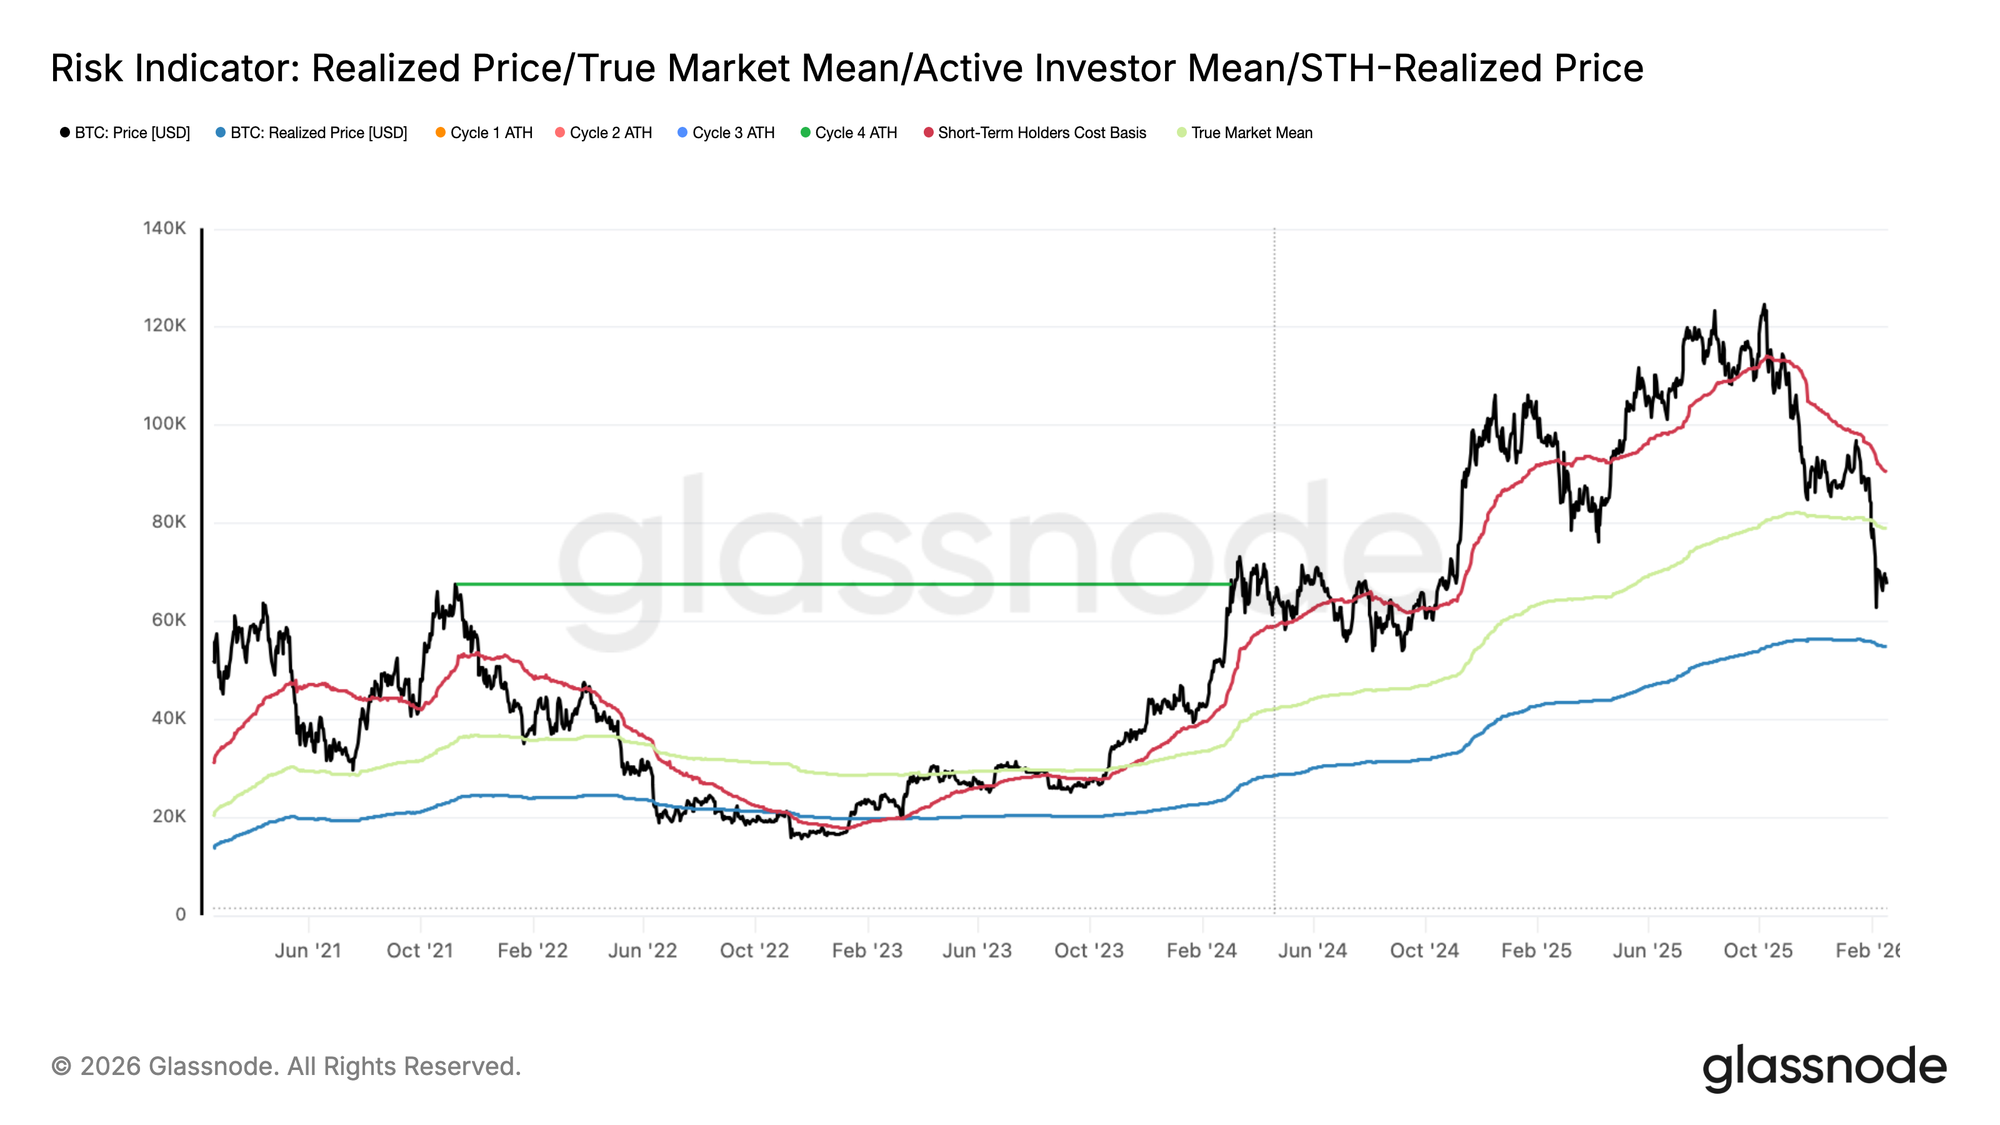
The market’s renewed contraction phase began in late January, marked by a decisive break below the True Market Mean, a core on-chain price model tracking the aggregate cost basis of active supply, currently positioned near $79k. Historically, deeper bear market phases have found their lower structural boundary around the Realized Price, which estimates the average acquisition cost of all circulating coins and now stands near $54.9k.
In prior cycles, these two valuation anchors have framed extended periods of compression and absorption. In the absence of an unexpected macro catalyst, the $79k True Market Mean and the $54.9k Realized Price are likely to define the primary resistance and support corridor for the mid-term market structure.
Demand Cluster Absorbing Pressure
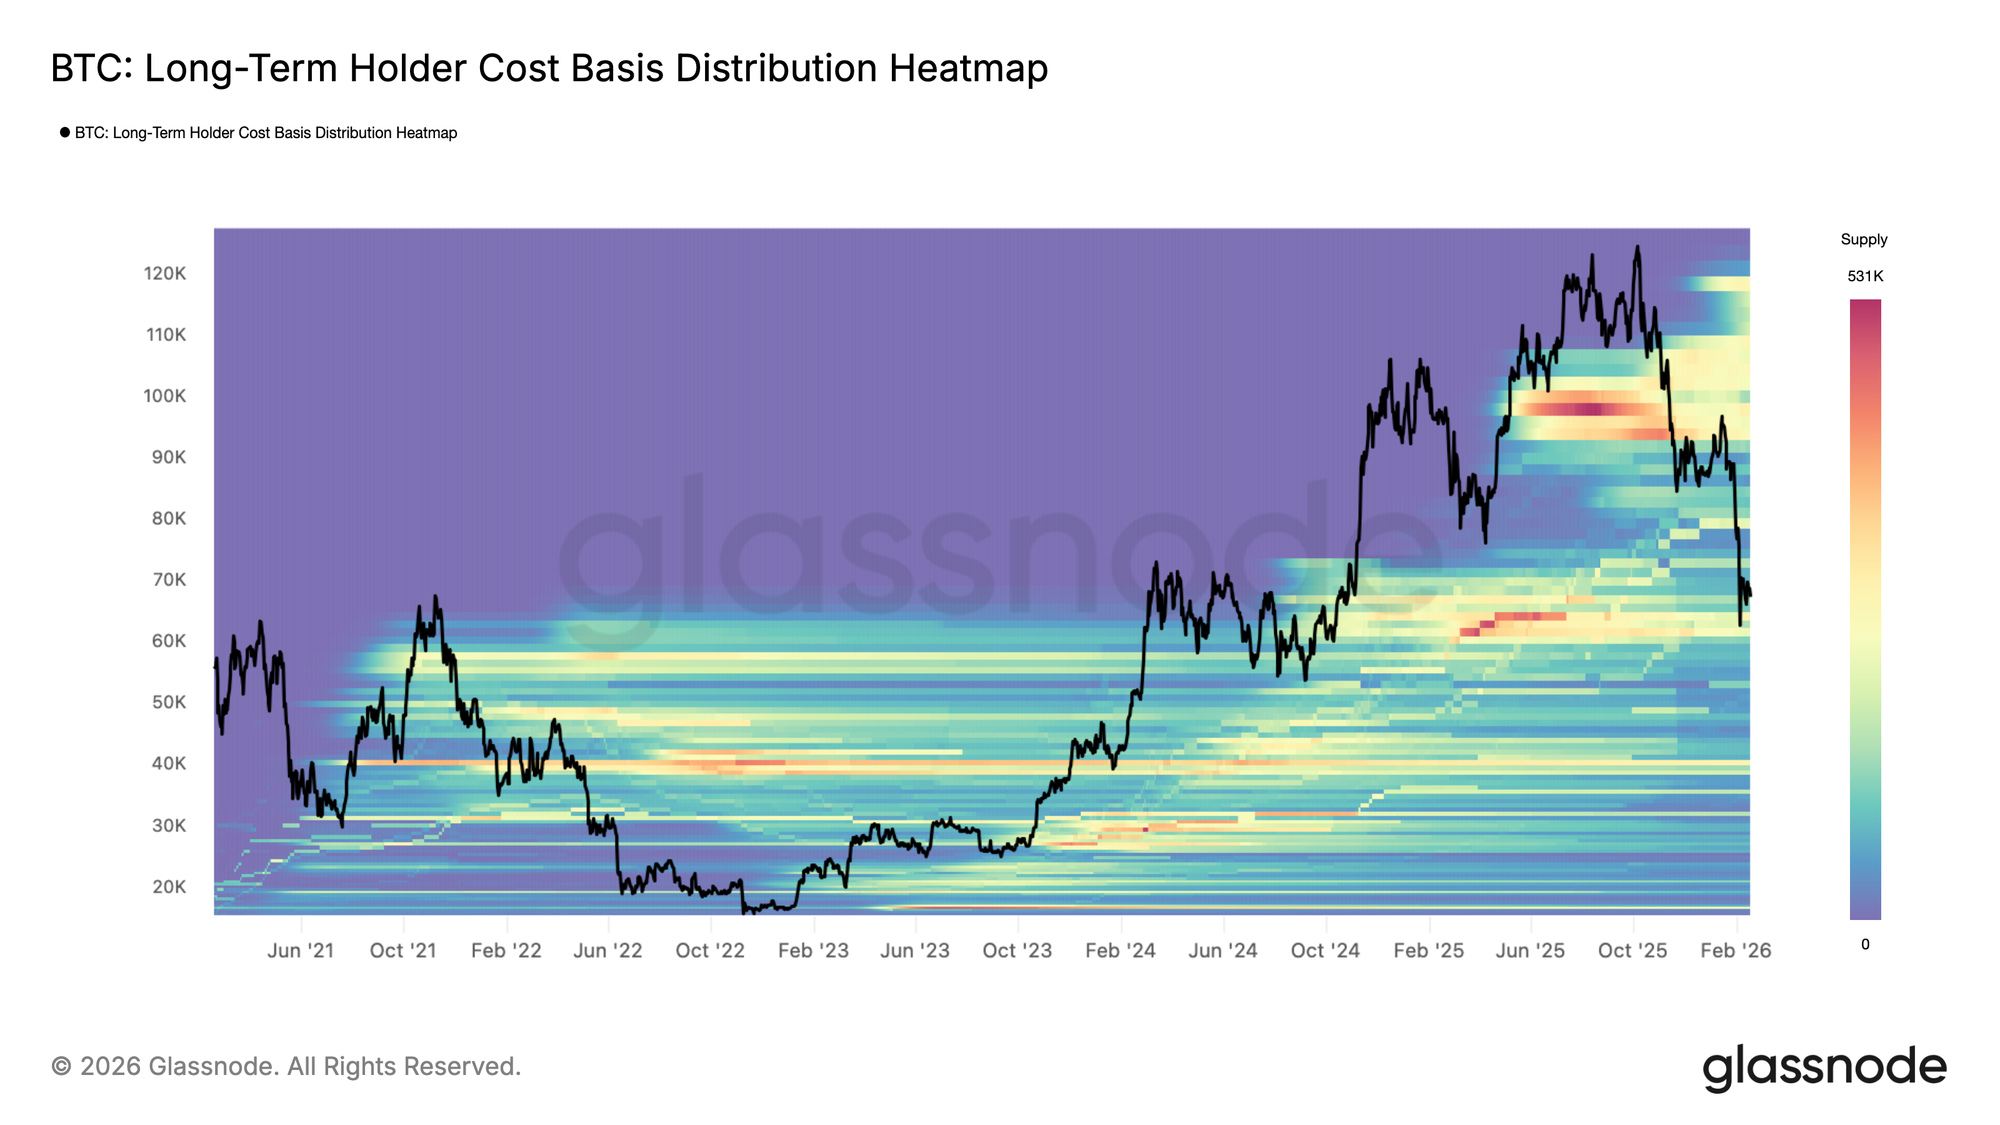
A closer inspection of price behavior since the breakdown below the True Market Mean indicates that downside pressure has largely been absorbed within a dense demand zone between $60k and $69k. This cluster was primarily established during the H1 2024 consolidation phase, where investors accumulated within a prolonged range and have since held their positions for over a year.
The positioning of this cohort near breakeven levels appears to have moderated incremental sell pressure, contributing to the development of another sideways structure since late January 2026. The defense of the $60k–$69k range suggests that medium-term holders remain resilient, allowing the market to transition from impulsive decline into range-bound absorption.
Buyer Aggression in Focus
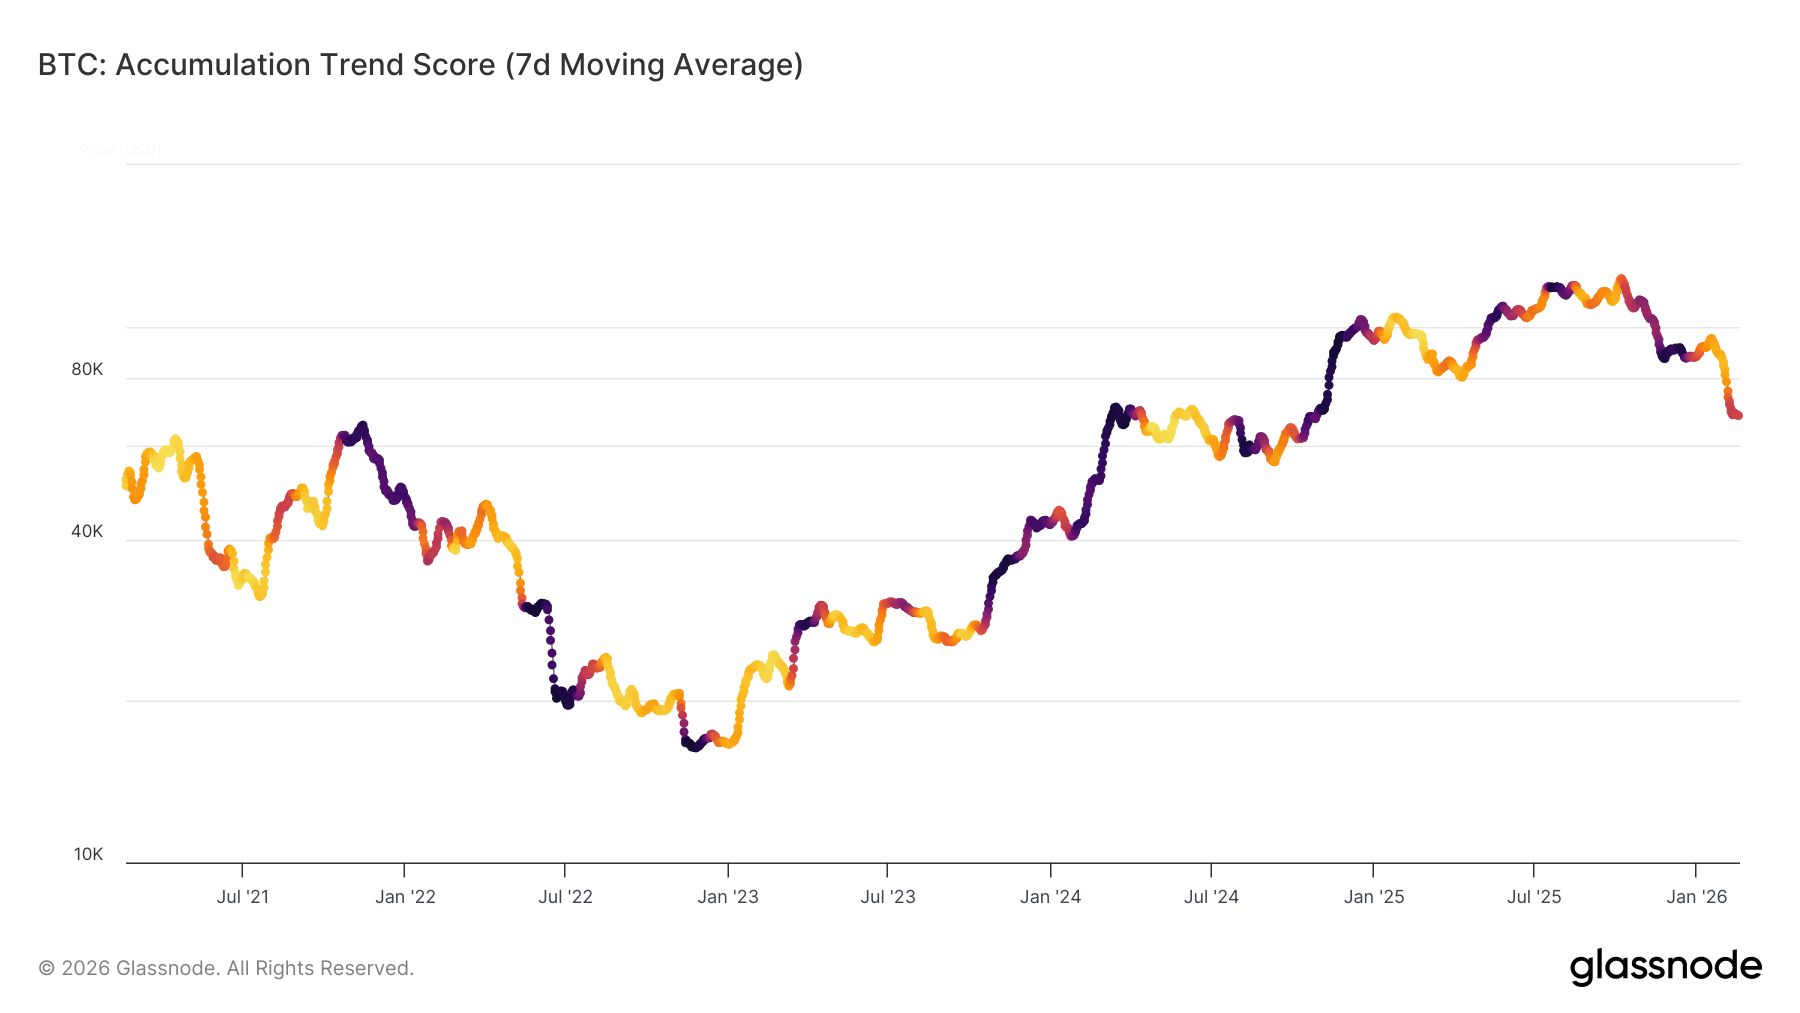
The duration of the current range-bound structure will largely depend on the strength and persistence of buy-side activity. To quantify this behavior, we examine the Accumulation Trend Score (ATS), which measures balance changes across wallet cohorts, assigning greater weight to larger entities.
The 7-day moving average of ATS reflects a notable behavioral shift, moving from strong distribution following the loss of the True Market Mean (ATS < 0.1) toward a more neutral and fragile equilibrium near 0.43. This moderation suggests that aggressive selling has eased, but conviction-driven accumulation has yet to fully re-emerge.
A sustained rise in ATS toward 1 would signal renewed large-entity accumulation, potentially extending the current range, whereas a failure to strengthen would reinforce underlying structural fragility.
Liquidity Remains Constrained
Beyond the absence of strong accumulation, broader liquidity conditions continue to reflect structural weakness. As a proxy for market liquidity, the Realized Profit/Loss Ratio provides insight into capital flow dynamics by measuring the average USD value of realized profit for every dollar realized in loss.
The 90-day moving average of this metric has been declining back into the 1–2 range, a zone that historically characterizes transitions from early bear phases toward more stressed conditions, where realized losses begin to dominate (Realized P/L Ratio < 1). This compression indicates that profit-taking remains subdued and capital rotation is limited.
Until the Realized Profit/Loss Ratio decisively reclaims levels above 2, signalling renewed profitability and stronger liquidity inflows, the broader market bias is likely to remain structurally negative.
Off-Chain Insights
ETFs are Still Seeing Outflows
Demand across US Spot ETFs has deteriorated materially, with the 7-day moving average of net flows rotating back into persistent outflows as BTC retraces toward the $70K region. What previously acted as a steady structural bid has now softened, signalling a contraction in marginal institutional demand.
This marks a notable shift from the prior expansionary regime, where consistent inflows helped absorb supply and support higher price discovery. Instead, flows are now broadly negative, reinforcing the view that capital allocators are stepping back rather than deploying into weakness.
With ETF demand no longer providing a reliable cushion beneath the market, downside risk remains elevated, and any recovery attempts are likely to struggle unless netflows stabilize and re-accelerate into sustained inflows.
Spot Bias Turns Firmly Negative
Spot Cumulative Volume Delta across major exchanges has rolled over sharply, with both Binance and the broader all-exchange CVD bias flipping decisively negative. This shift reflects an acceleration in aggressive sell-side activity, as market orders increasingly lift bids rather than offers.
Notably, Coinbase spot CVD has also softened, signalling that US-based demand is no longer providing a consistent counterbalance to global sell pressure. The alignment of negative CVD across venues suggests that recent weakness is driven by active distribution rather than passive liquidity gaps.
With spot flows skewed toward sell aggression, price action remains vulnerable. A stabilization in CVD, particularly a constructive divergence between price and spot delta, would be required to signal that organic demand is beginning to absorb supply more effectively.
Perpetual Funding Still Defensive
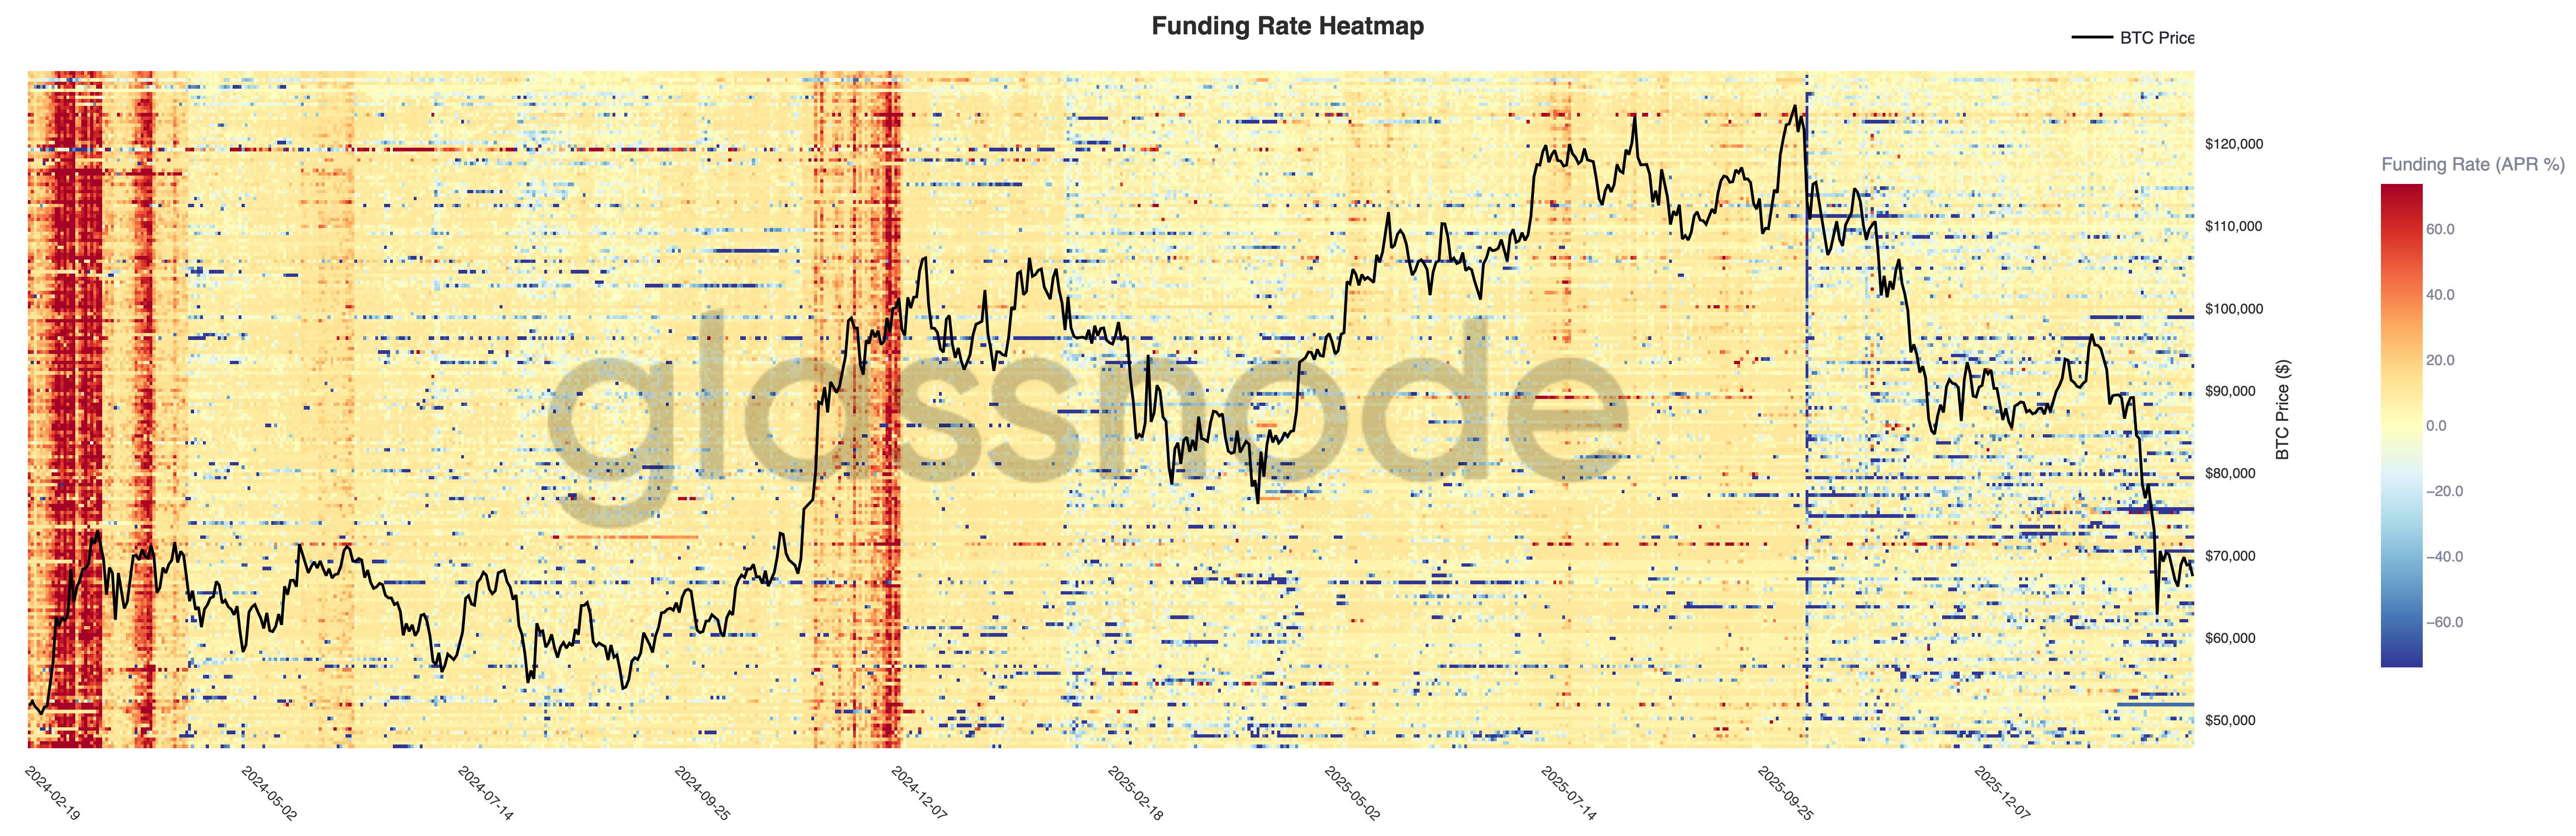
Perpetual funding rates have compressed sharply across venues, with the heatmap showing a broad shift from sustained positive funding during the advance toward $120K to increasingly neutral and negative prints as price retraces toward $70K. This transition reflects a meaningful unwind in long-side positioning.
Earlier expansion phases were characterised by persistent positive funding, signalling aggressive long leverage and trend reinforcement. In contrast, the current regime is marked by episodic negative funding spikes, suggesting traders are either hedging downside exposure or positioning tactically short into weakness.
With leverage no longer structurally skewed long, the derivatives complex has shifted into a more defensive posture. A sustained recovery would likely require funding to stabilize alongside renewed spot demand, rather than relying solely on short-covering flows.
Panic Premium Is Resetting
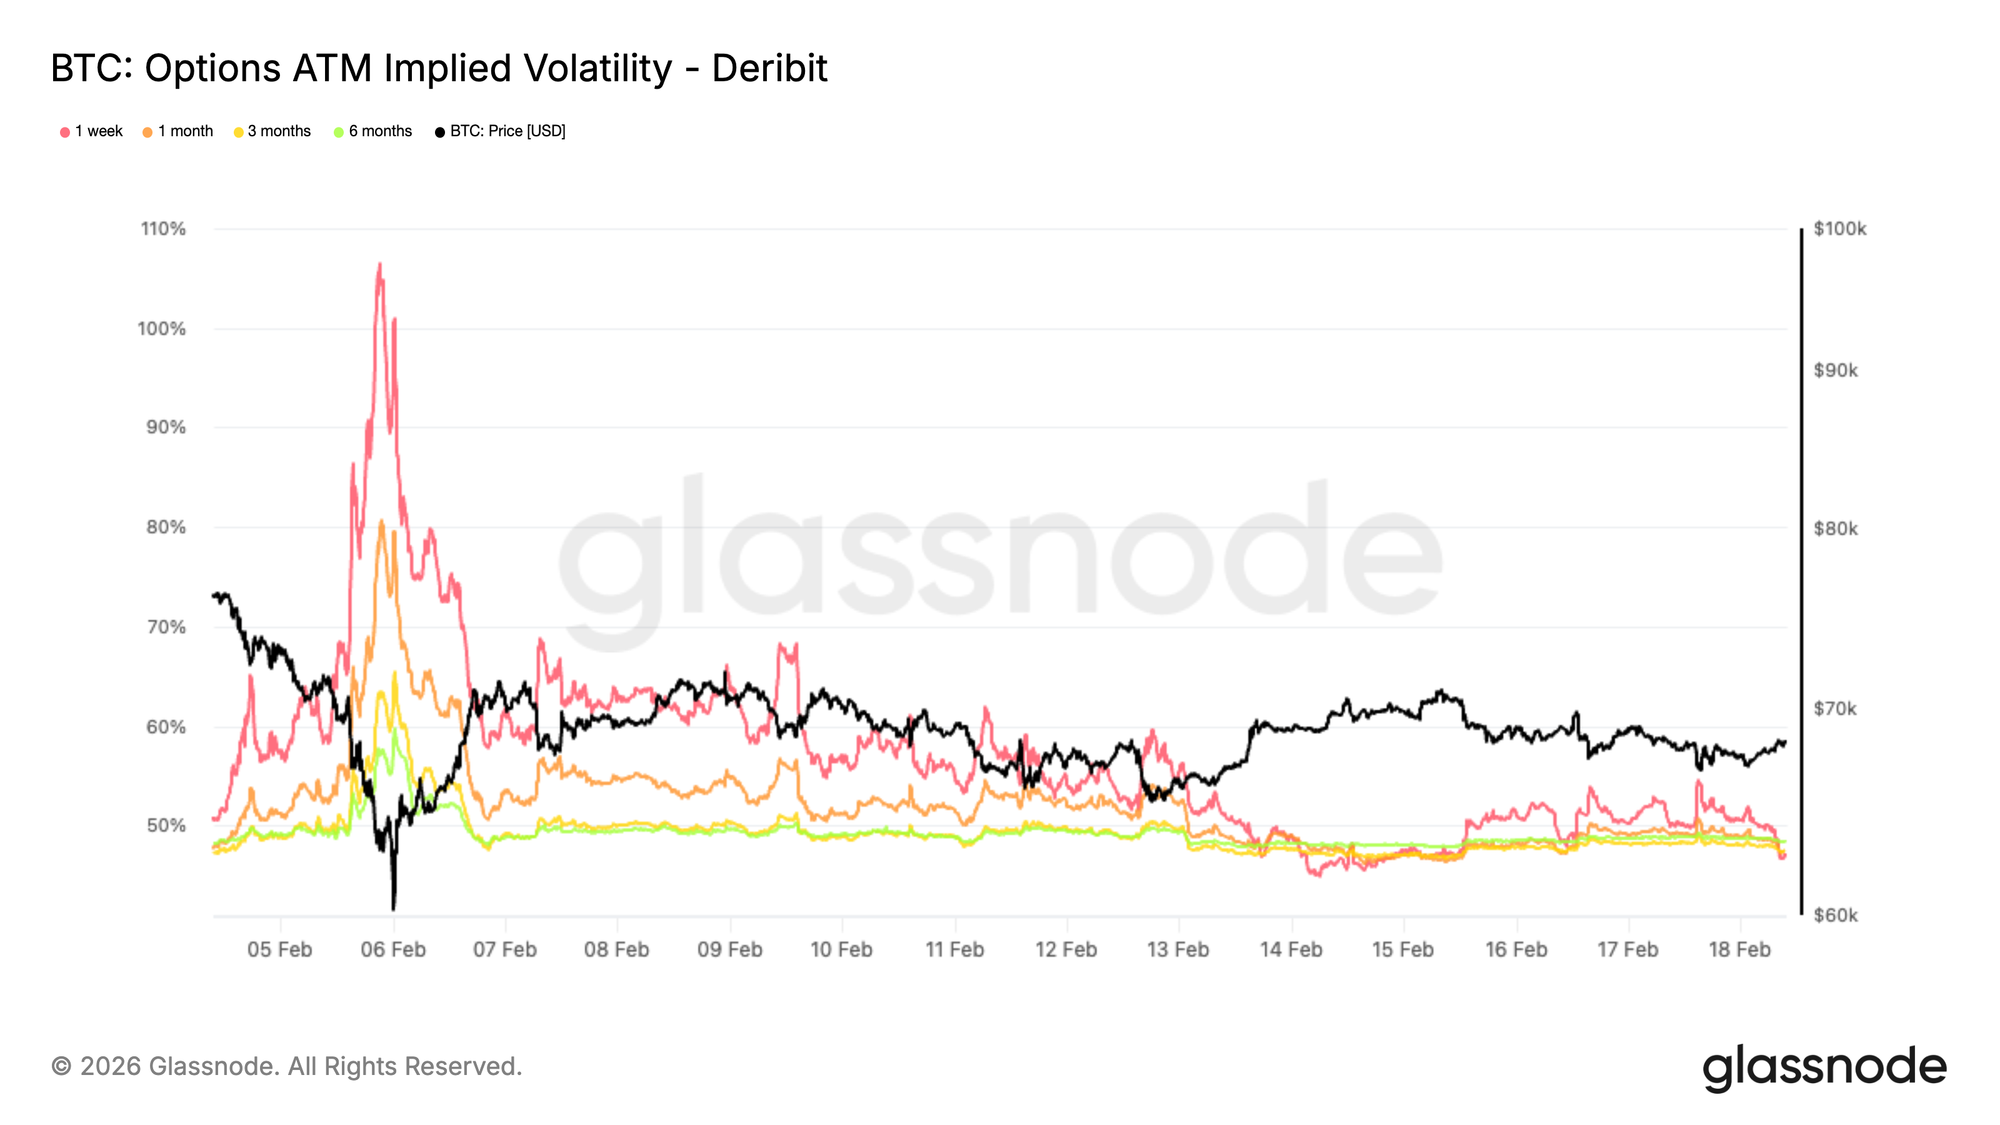
One-month ATM implied volatility has compressed sharply from recent panic highs, which reached 80% for the one-month tenor and 65% for the three-month, to roughly 47% across both maturities.
That decline reflects a meaningful reduction in immediate downside hedging demand. During the liquidation phase, traders aggressively paid up for short-term protection. That urgency has now faded.
The volatility risk premium is being unwound as defensive positioning is reduced. The market is no longer pricing an imminent crash scenario and instead reflects expectations of consolidation, with volatility contained within a narrower range.
This does not imply renewed bullish conviction. Rather, it signals that stress pricing has normalized and that positioning is being reset. The takeaway is structural. The forced hedging phase appears to be behind us, and volatility expectations are recalibrating lower as market positioning stabilizes.
Extreme Downside Skew Eases
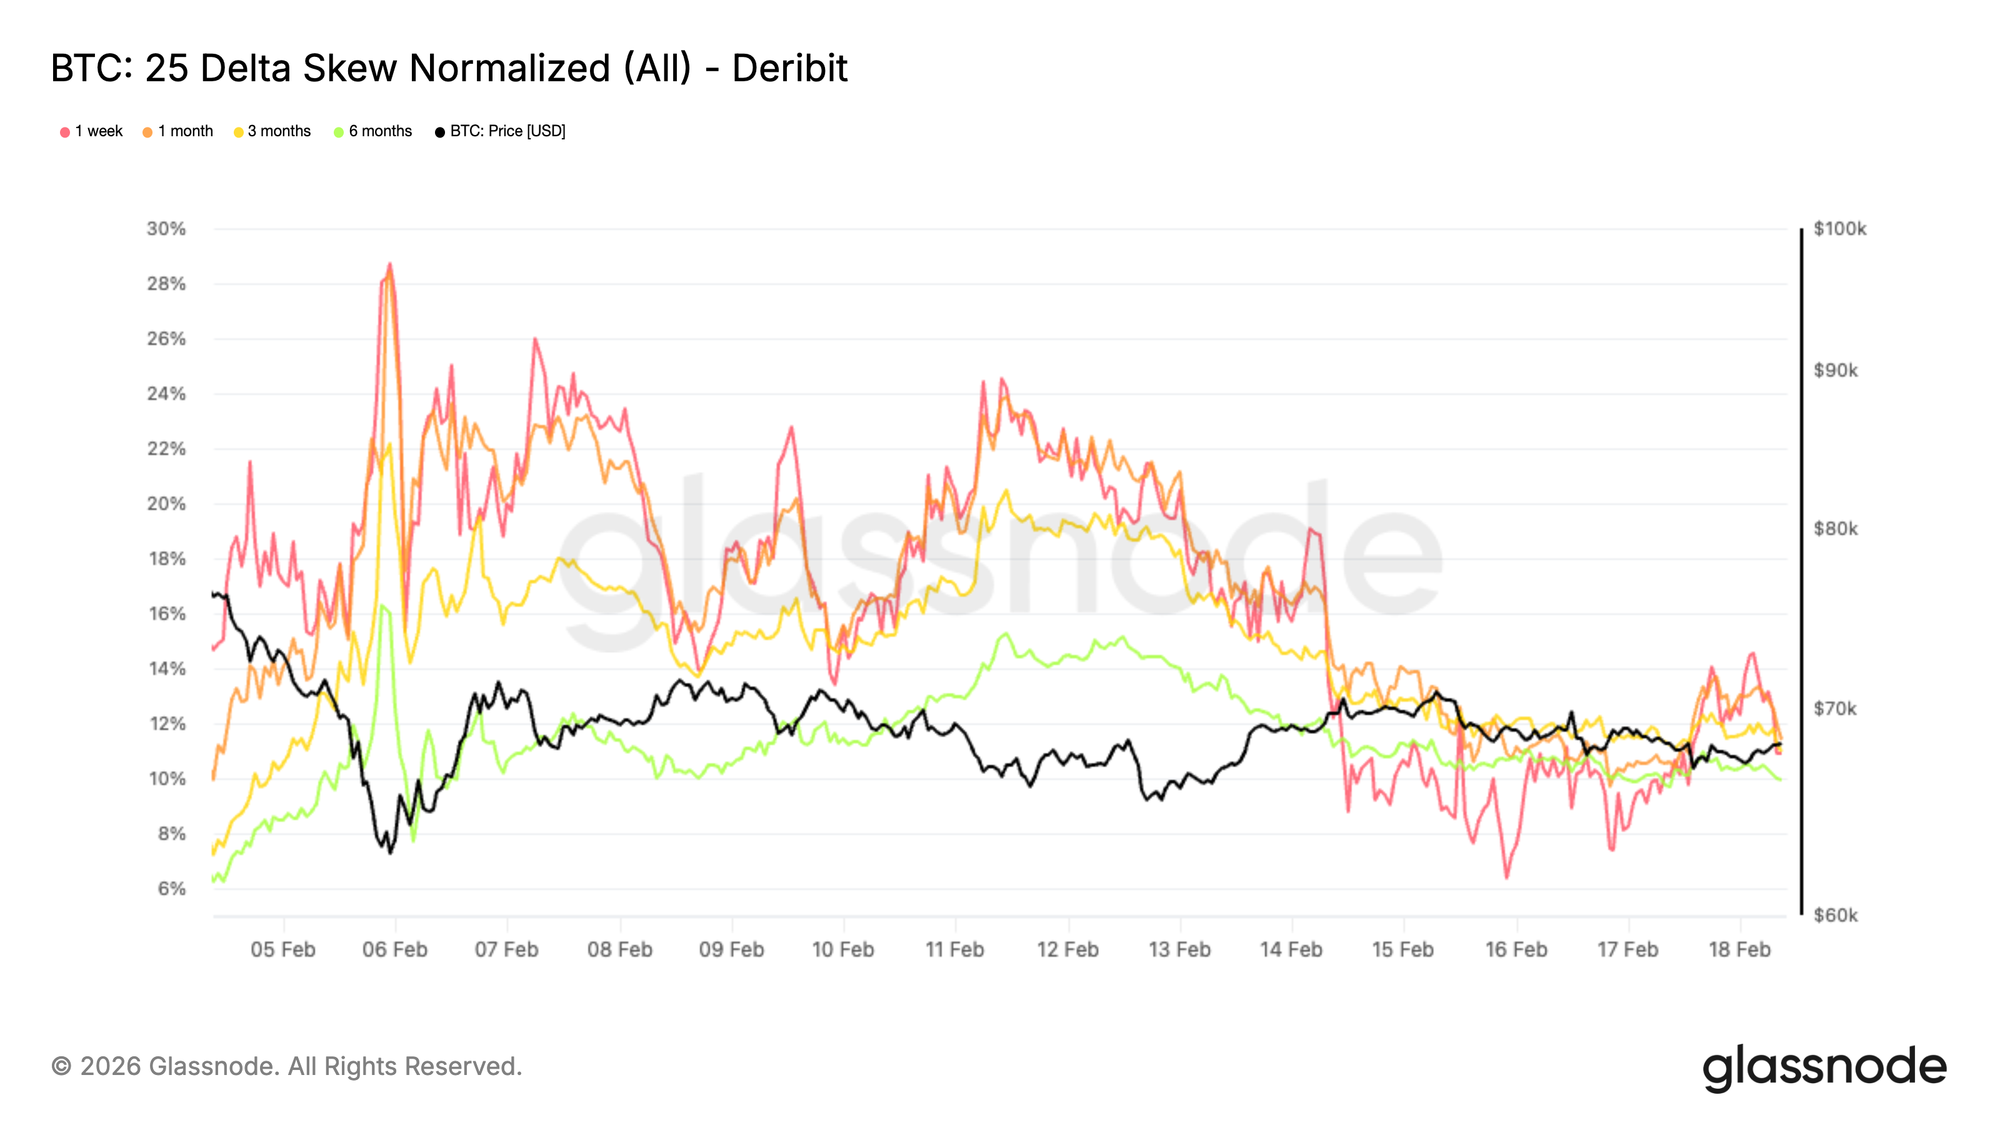
The 25-delta skew, which measures the volatility differential between downside puts and upside calls, has compressed meaningfully. A positive reading indicates that puts are priced richer than calls, signaling stronger demand for downside protection.
Following the retest of the $60K region, skew held near 20%. It has since eased to roughly 11% across tenors, marking a sharp 9-point moderation over recent sessions.
At the lows, puts traded at a significant premium as traders rushed to secure crash protection. That urgency has subsided. However, skew remains elevated relative to pre-selloff levels, indicating that downside hedging is still favored over upside exposure.
Traders are scaling back extreme tail hedges, but they are not rebuilding upside convexity. The takeaway is balanced. Stress has moderated, yet positioning remains cautious rather than constructive.
Volatility Risk Premium Diverges
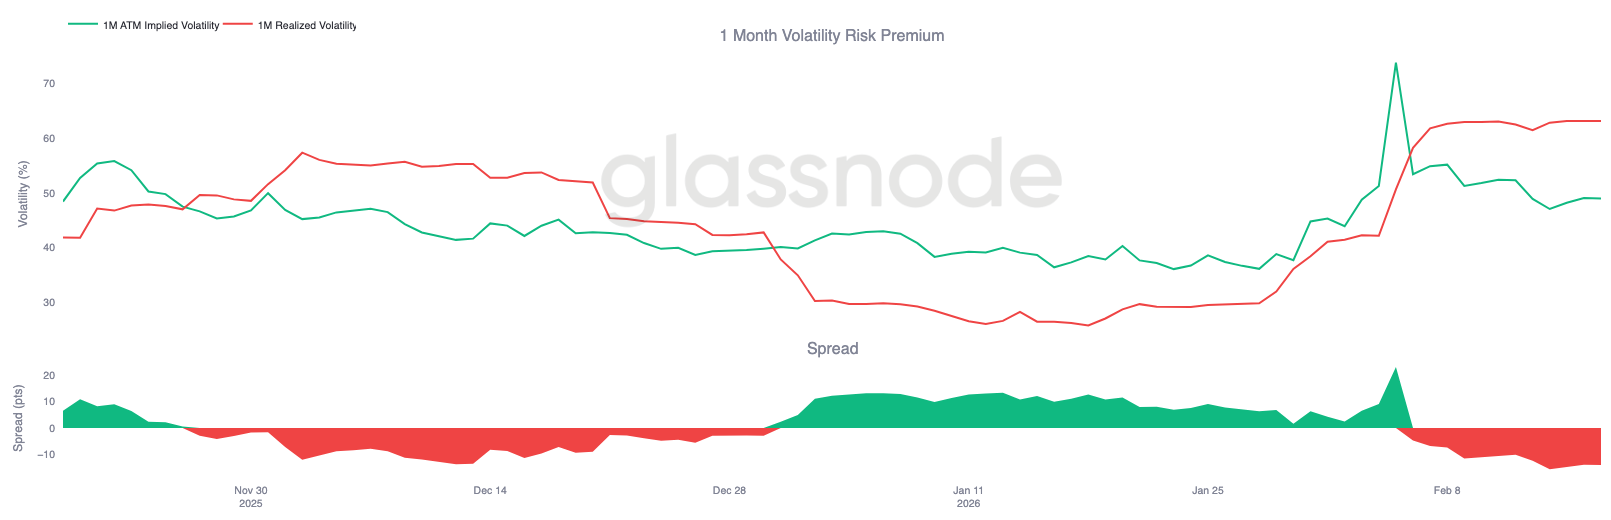
As implied volatility compresses and skew normalizes, the one-month volatility risk premium provides additional context. This metric compares implied volatility to realized volatility, assessing whether options markets are pricing more or less movement than has actually materialized.
During the liquidation-driven move, realized volatility expanded sharply, with large daily ranges pushing short-term realized metrics materially higher.
At the same time, implied volatility has begun to retrace as panic-driven hedging demand fades. This divergence often appears in the later stages of a stress episode.
When realized volatility spikes while implied volatility declines, it typically suggests that the forced component of the move has largely passed.
With crash hedges being unwound and positioning stabilizing, realized volatility is likely to moderate from elevated levels as the market transitions from reactive flows toward more deliberate positioning dynamics.
60K Put Premium: Hedge Unwinds Emerging
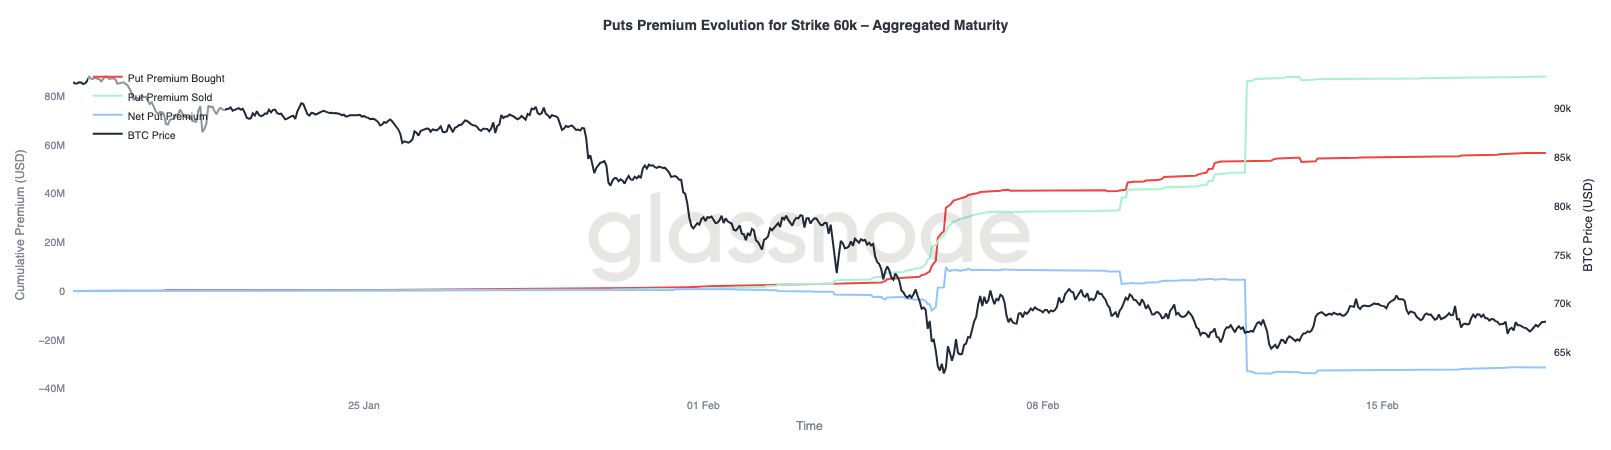
Zooming in on the $60K put premium evolution, the behavioral shift becomes clearer. During and immediately after the crash, put premium bought dominated flows, as traders aggressively accumulated downside protection at that strike, reinforcing demand for crash insurance.
As price stabilized, this dynamic began to reverse. Downside hedges were gradually unwound, and put premium sold increased meaningfully. The gap between premium bought and premium sold has widened in favor of sellers, pushing net premium lower. Some participants are now monetizing previously acquired protection while volatility at that strike remains relatively elevated.
The broader picture is consistent. The market remains cautious, but the urgency to own crash protection is fading. Rather than rebuilding upside exposure, traders appear to be repositioning for a more contained environment, where range-bound dynamics replace panic-driven flows.
Conclusion
Bitcoin remains confined within a structurally defined corridor between the True Market Mean near $79k and the Realized Price around $54.9k. The breakdown below active cost basis has shifted the regime firmly defensive, with price now relying on the $60k–$69k demand cluster to absorb persistent sell pressure. While this zone has so far moderated downside momentum, conviction remains fragile.
On-chain accumulation has improved from outright distribution but has yet to transition into strong, large-entity buying. Liquidity conditions remain constrained, as reflected by the Realized Profit/Loss Ratio hovering in a compressed 1–2 range, indicating limited capital rotation. Spot flows continue to skew negative, and ETF outflows confirm that institutional demand is not currently providing a structural bid.
In derivatives, the panic phase appears to be fading. Implied volatility and skew have compressed, and crash hedges are being unwound. However, this normalization reflects stabilization rather than renewed bullish positioning.
Taken together, the market is transitioning from reactive liquidation to controlled consolidation. For a durable recovery to emerge, renewed spot demand, sustained accumulation, and improving liquidity conditions will be required. Until then, range-bound absorption between key valuation anchors remains the dominant structural theme.
Disclaimer: This report does not provide any investment advice. All data is provided for informational and educational purposes only. No investment decision shall be based on the information provided here, and you are solely responsible for your own investment decisions.
Exchange balances presented are derived from Glassnode’s comprehensive database of address labels, which are amassed through both officially published exchange information and proprietary clustering algorithms. While we strive to ensure the utmost accuracy in representing exchange balances, it is important to note that these figures might not always encapsulate the entirety of an exchange’s reserves, particularly when exchanges refrain from disclosing their official addresses. We urge users to exercise caution and discretion when utilizing these metrics. Glassnode shall not be held responsible for any discrepancies or potential inaccuracies.
Please read our Transparency Notice when using exchange data.