Bybit Hack Postmortem
Bybit’s historic $1.48B hack triggered panic withdrawals and a market-wide sell-off, pushing the price 20% below its ATH. With the market trading 5% below the cost basis of short-term holders, new investors faced severe pain, intensifying their loss realization.


Executive Summary
- Bybit suffered one of the largest hacks in crypto history, losing 403,996 ETH (~$1.13B) from its cold wallets due to a smart contract exploit. This breach led to panic withdrawals, with total exchange outflows reaching approximately $4.3B across Bitcoin and stablecoins.
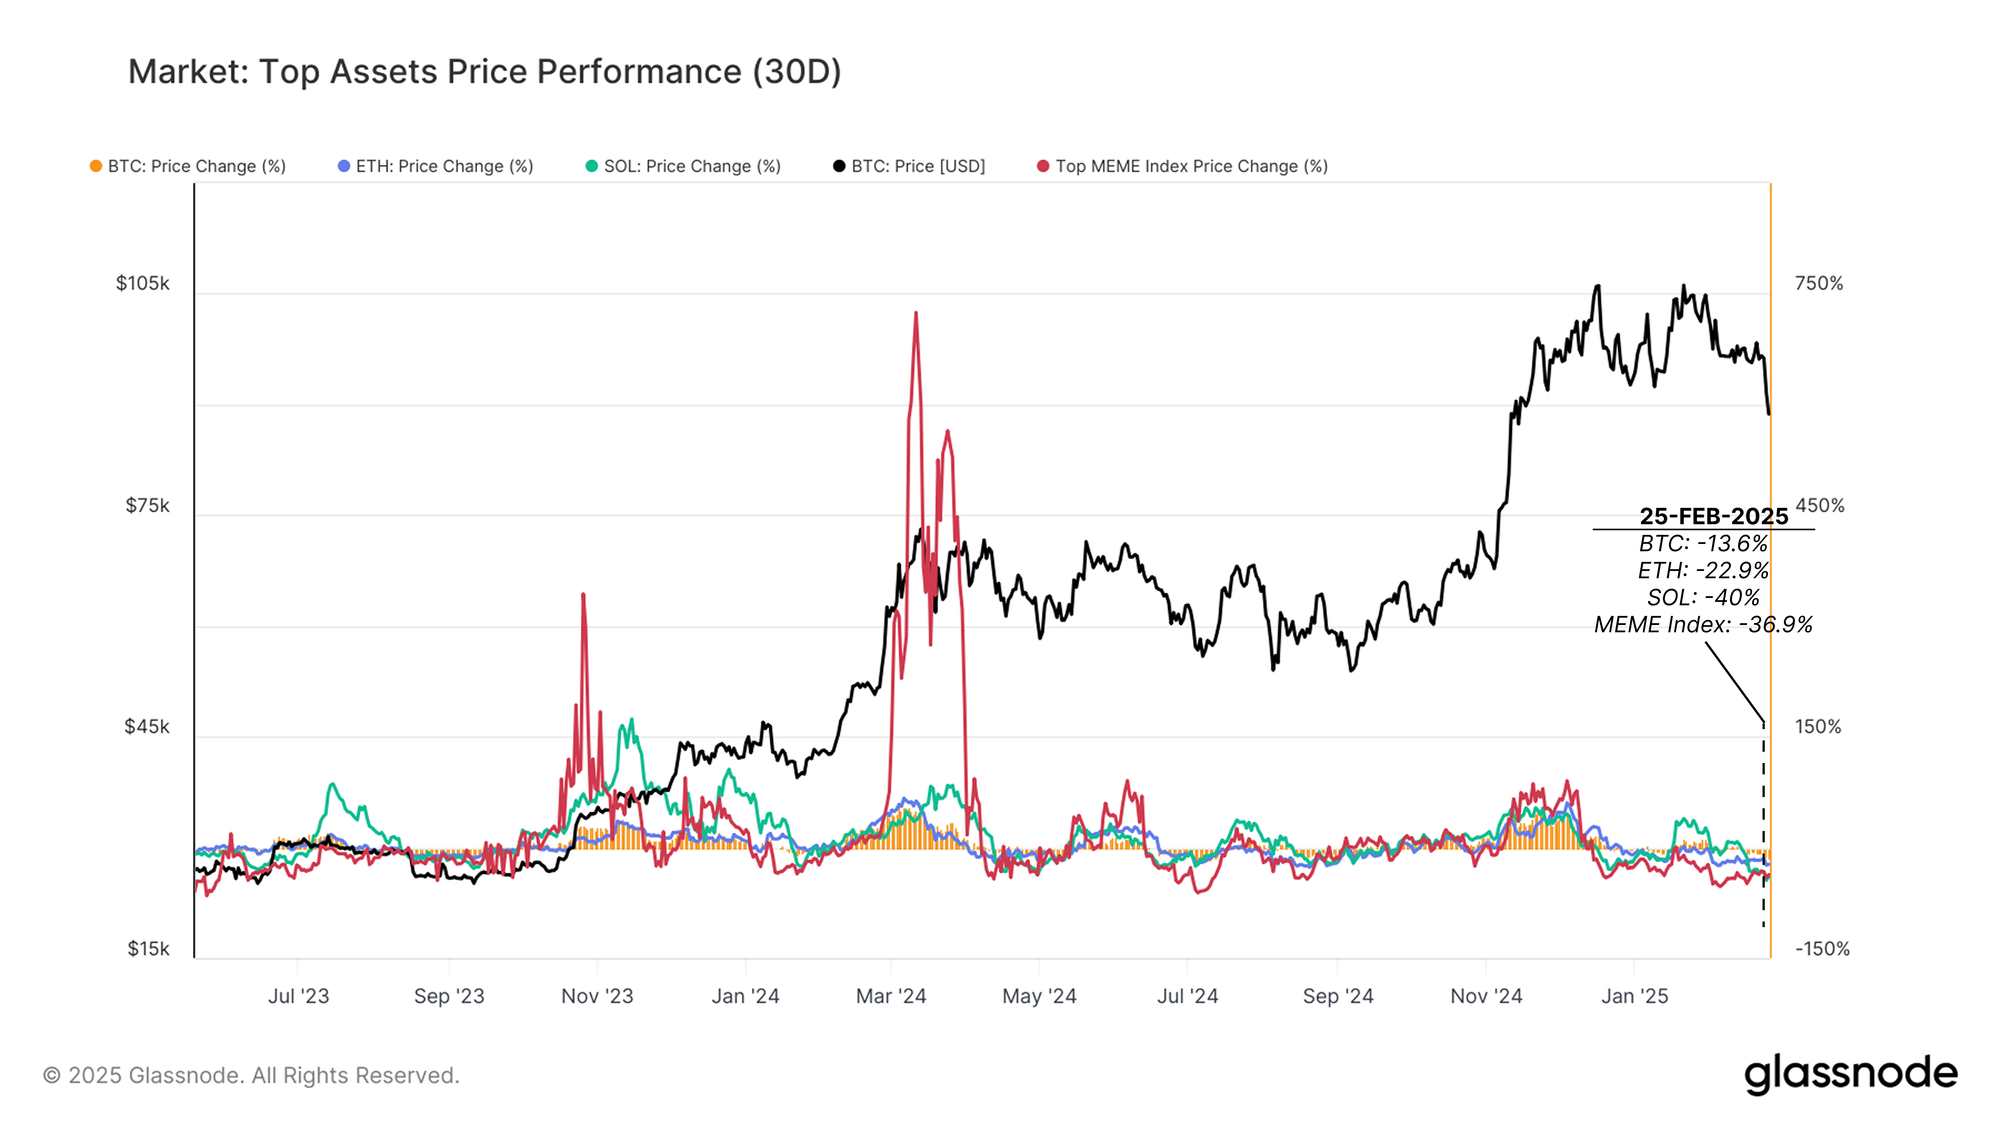
- Market sentiment deteriorated rapidly, triggering a broad sell-off. Bitcoin monthly performance dropped to -13.6%, while Ethereum (-22.9%), Solana (-40%), and Meme Coins (-36.9%) erased months of gains, resetting market momentum to April 2024 levels.
- The price drop pushed Bitcoin back into the realized supply “air gap” between $70K and $88K, a zone with a low-cost basis density. Initially driven by long-term holder sell-offs, this weakness was exacerbated by the Bybit hack, increasing downside momentum.
- With the price dropping below the Short-Term Holder Cost-Basis, new demand investors are under severe pressure and are beginning to realize significant losses. Historically, this has signalled a period of seller exhaustion, however, a continued lack of demand could extend the current downtrend.
A Historic Hack Shakes the Market
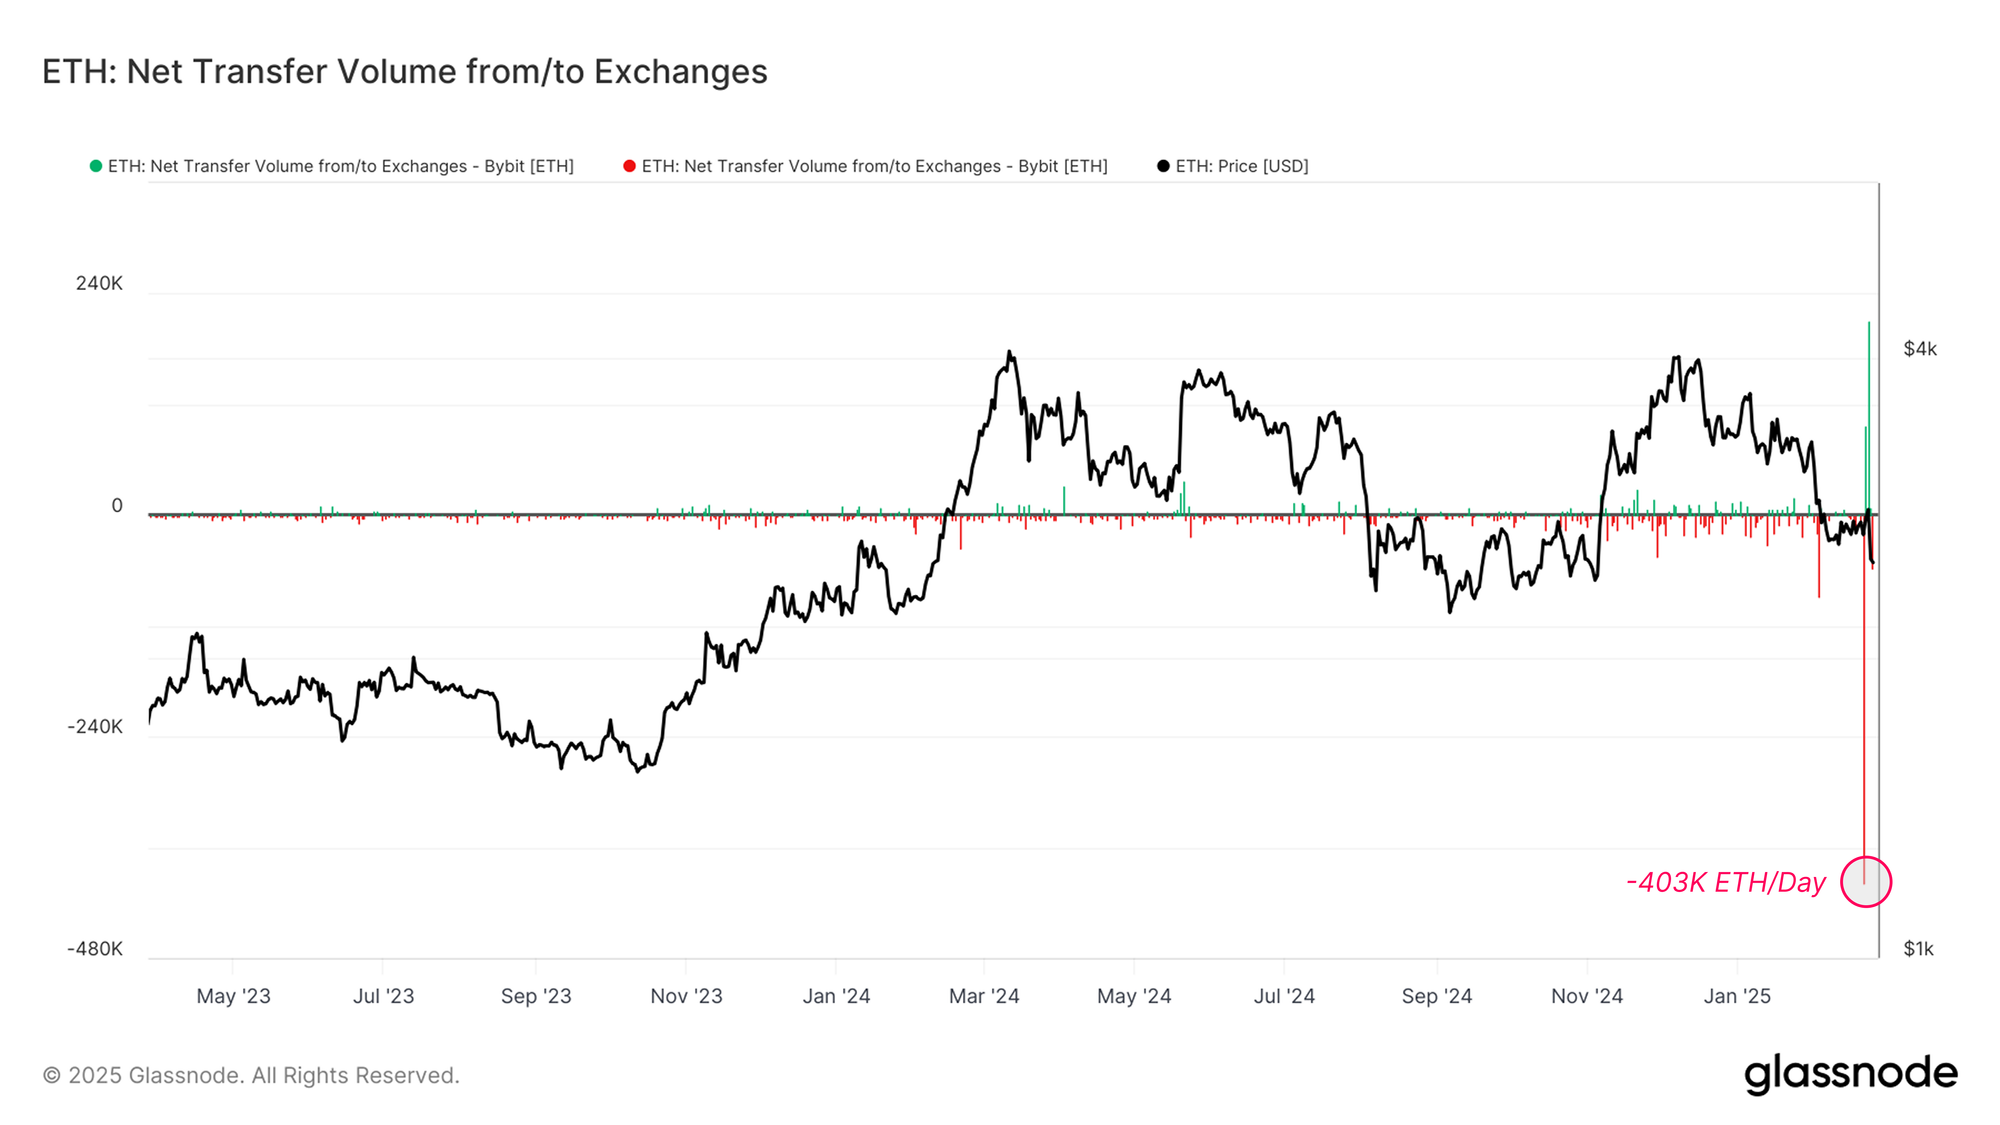
On February 21, 2025, the market was rattled by one of the largest exchange hacks in crypto history, as Bybit suffered a massive security breach. The attacker drained 403,996 ETH (~$1.13 billion) from the platform’s Ethereum cold wallet, exploiting smart contract permissions to reroute funds to an unidentified address.
Bybit CEO Ben Zhou explained that the attack was executed through a "Musked UI," where a fraudulent interface deceived signers into approving a malicious transaction. Despite the severity of the breach, Bybit assured users that other cold wallets remained secure and withdrawals were still operational.
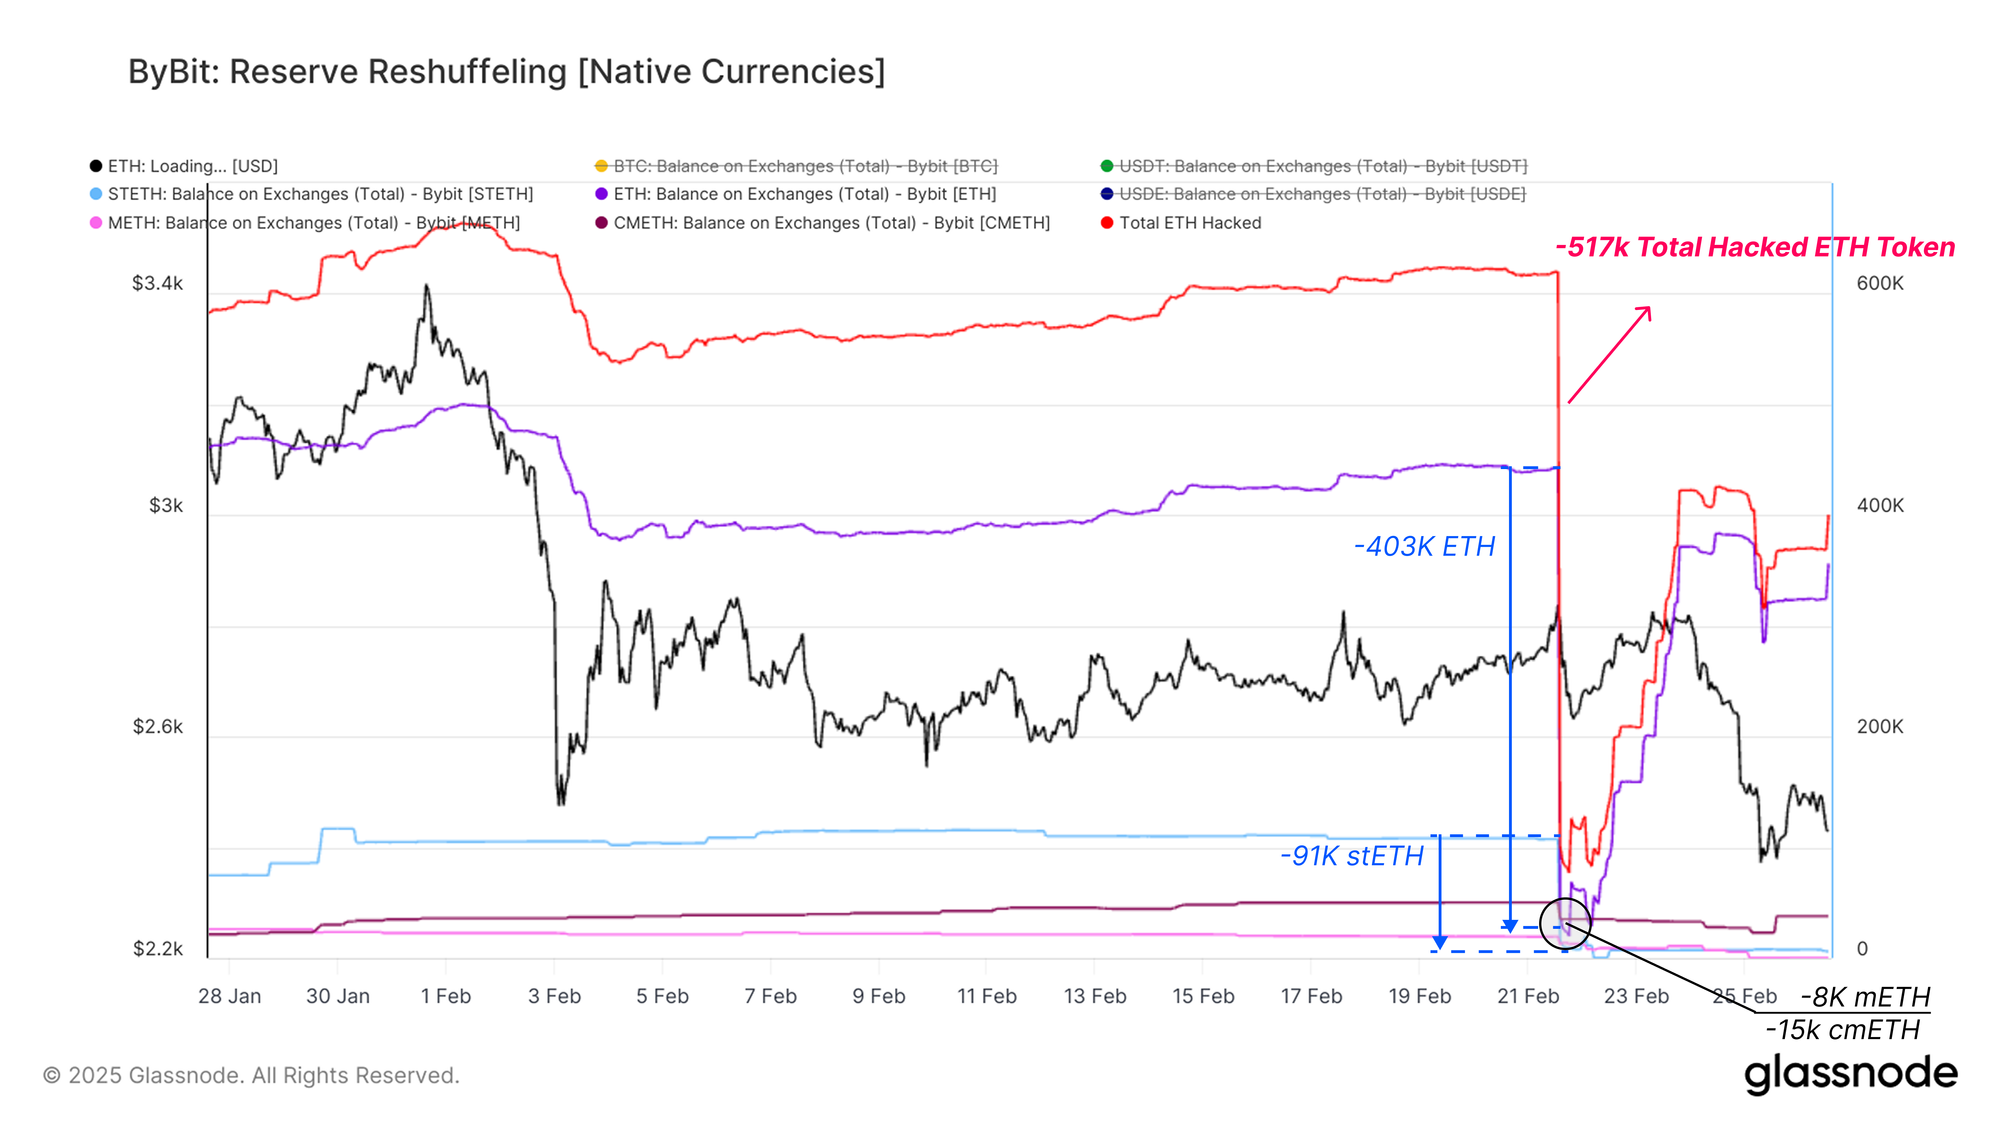
The hacker's transactions revealed that the stolen assets were not limited to Ethereum, with substantial losses across multiple assets:
- Ethereum (ETH): 403,996 ETH hacked
- Staked Ethereum (stETH): 91,076 stETH hacked
- mETH: 8,000 mETH hacked
- cmETH: 15,000 cmETH hacked
With nearly $1.48B in stolen funds, the hack left the market on edge, triggering concerns over exchange security, fund safety, and potential market-wide sell pressure.
Market Fallout and Exchange Outflows
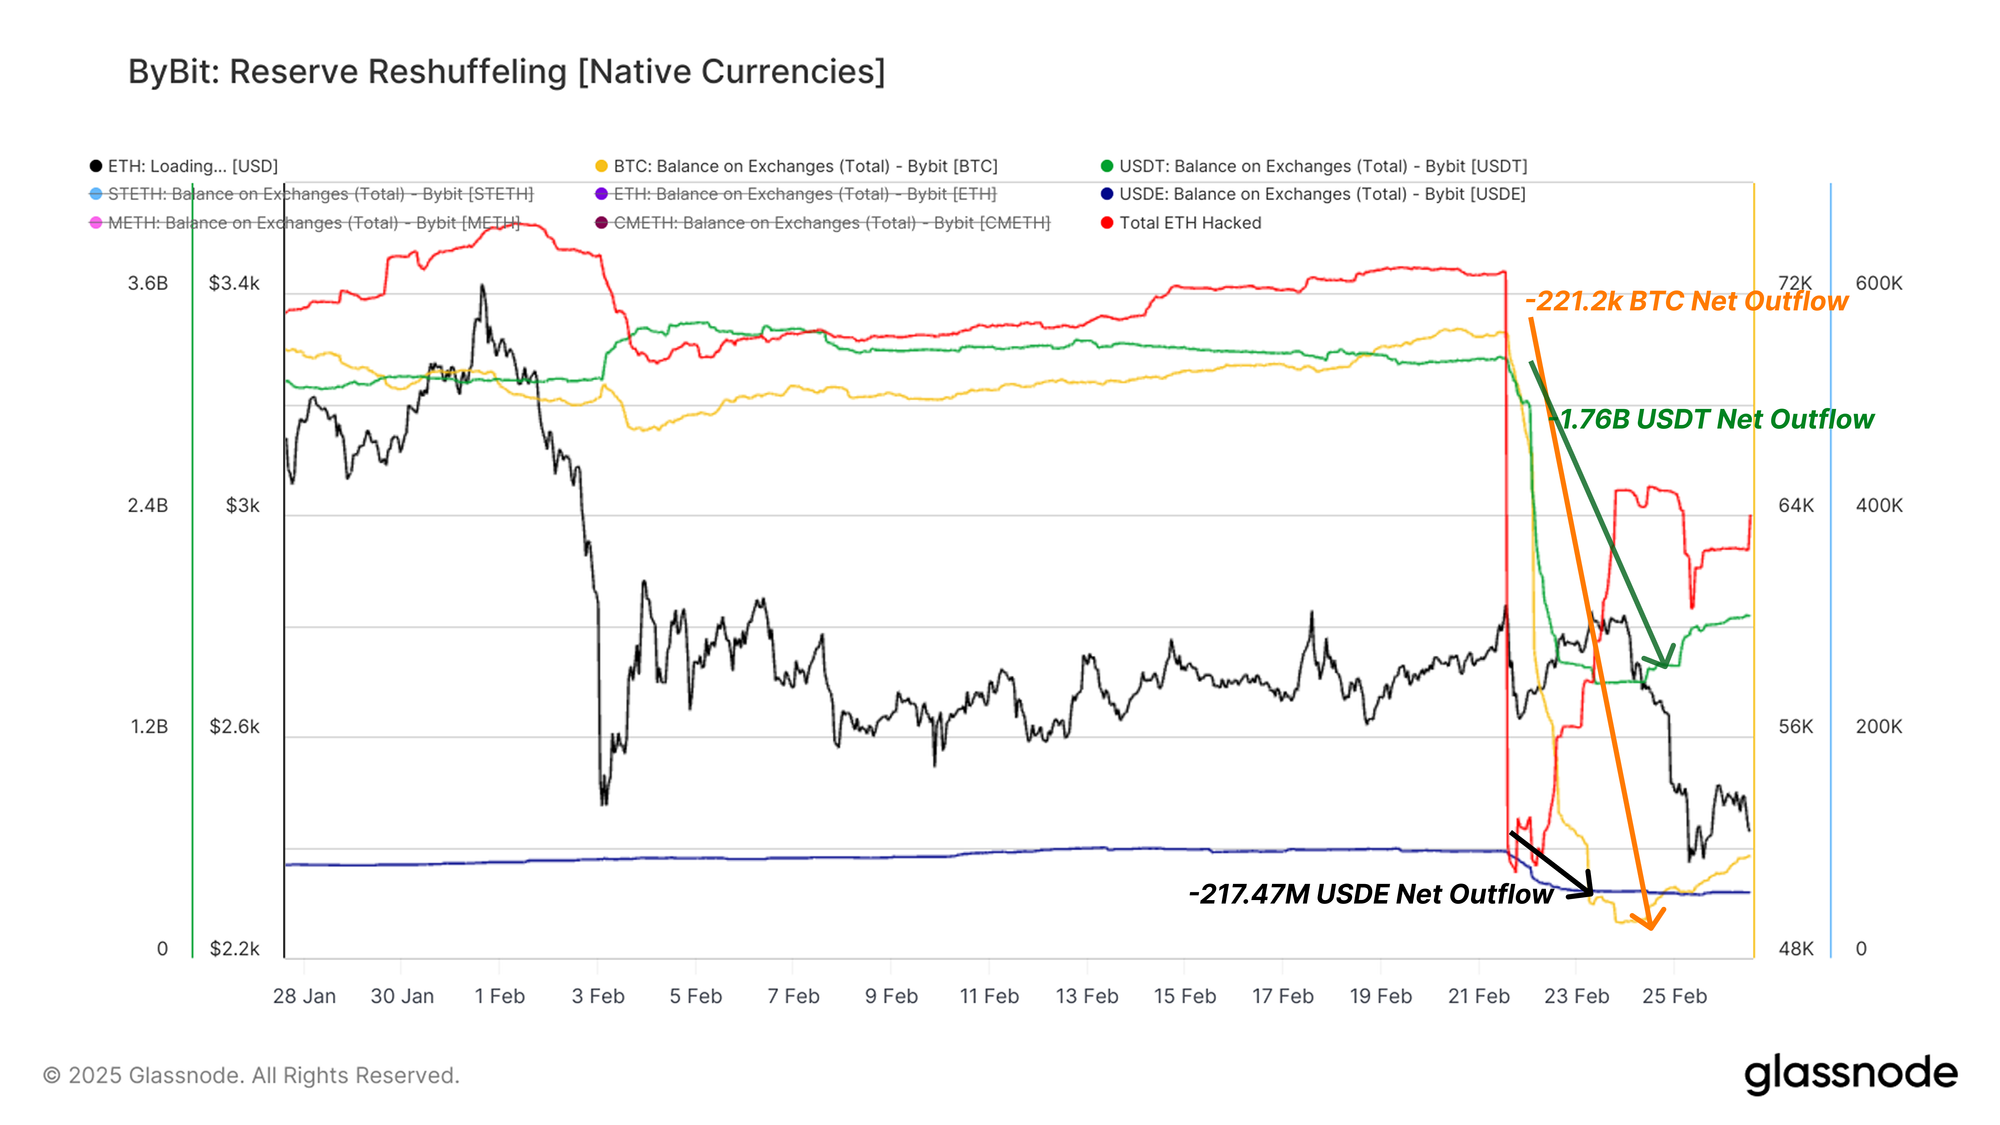
Following the hack, the market reacted with heightened volatility and panic withdrawals, leading to a significant decline in Bybit’s reserves as users rushed to secure their assets.
By February 24, 2025, Bybit’s BTC, USDT, and USDE reserves experienced substantial outflows:
- Bitcoin (BTC): 21,248 BTC net outflow (70,604 BTC → 49,356 BTC)
- Tether (USDT): $1.76B USDT net outflow (3.25B → 1.50B USDT)
- USDE: $217.47M USDE net outflow (578.37M → 360.90M USDE)
These figures illustrate the liquidity drain across Bybit, reinforcing broader concerns over centralized exchange security.
Outflows Peak
By February 24, 2025, Bybit’s reserves of major assets - including Bitcoin and stablecoins - dropped from $10.8B at the time of the hack to $6.5B, highlighting a cumulative outflow of $4.3B. While the initial wave of panic-driven withdrawals was severe, the rate of outflows has since moderated, suggesting a gradual stabilization.
At the same time, Ethereum reserves - including both native ETH and staked ETH - rebounded to $1.19B, aided by Bybit’s efforts to replenish holdings. ETH price action remained weak, declining to $2,490, while a subsequent ~$117M outflow after the buyback suggests that investor confidence is still fragile.

Ethereum Reserve Recovery
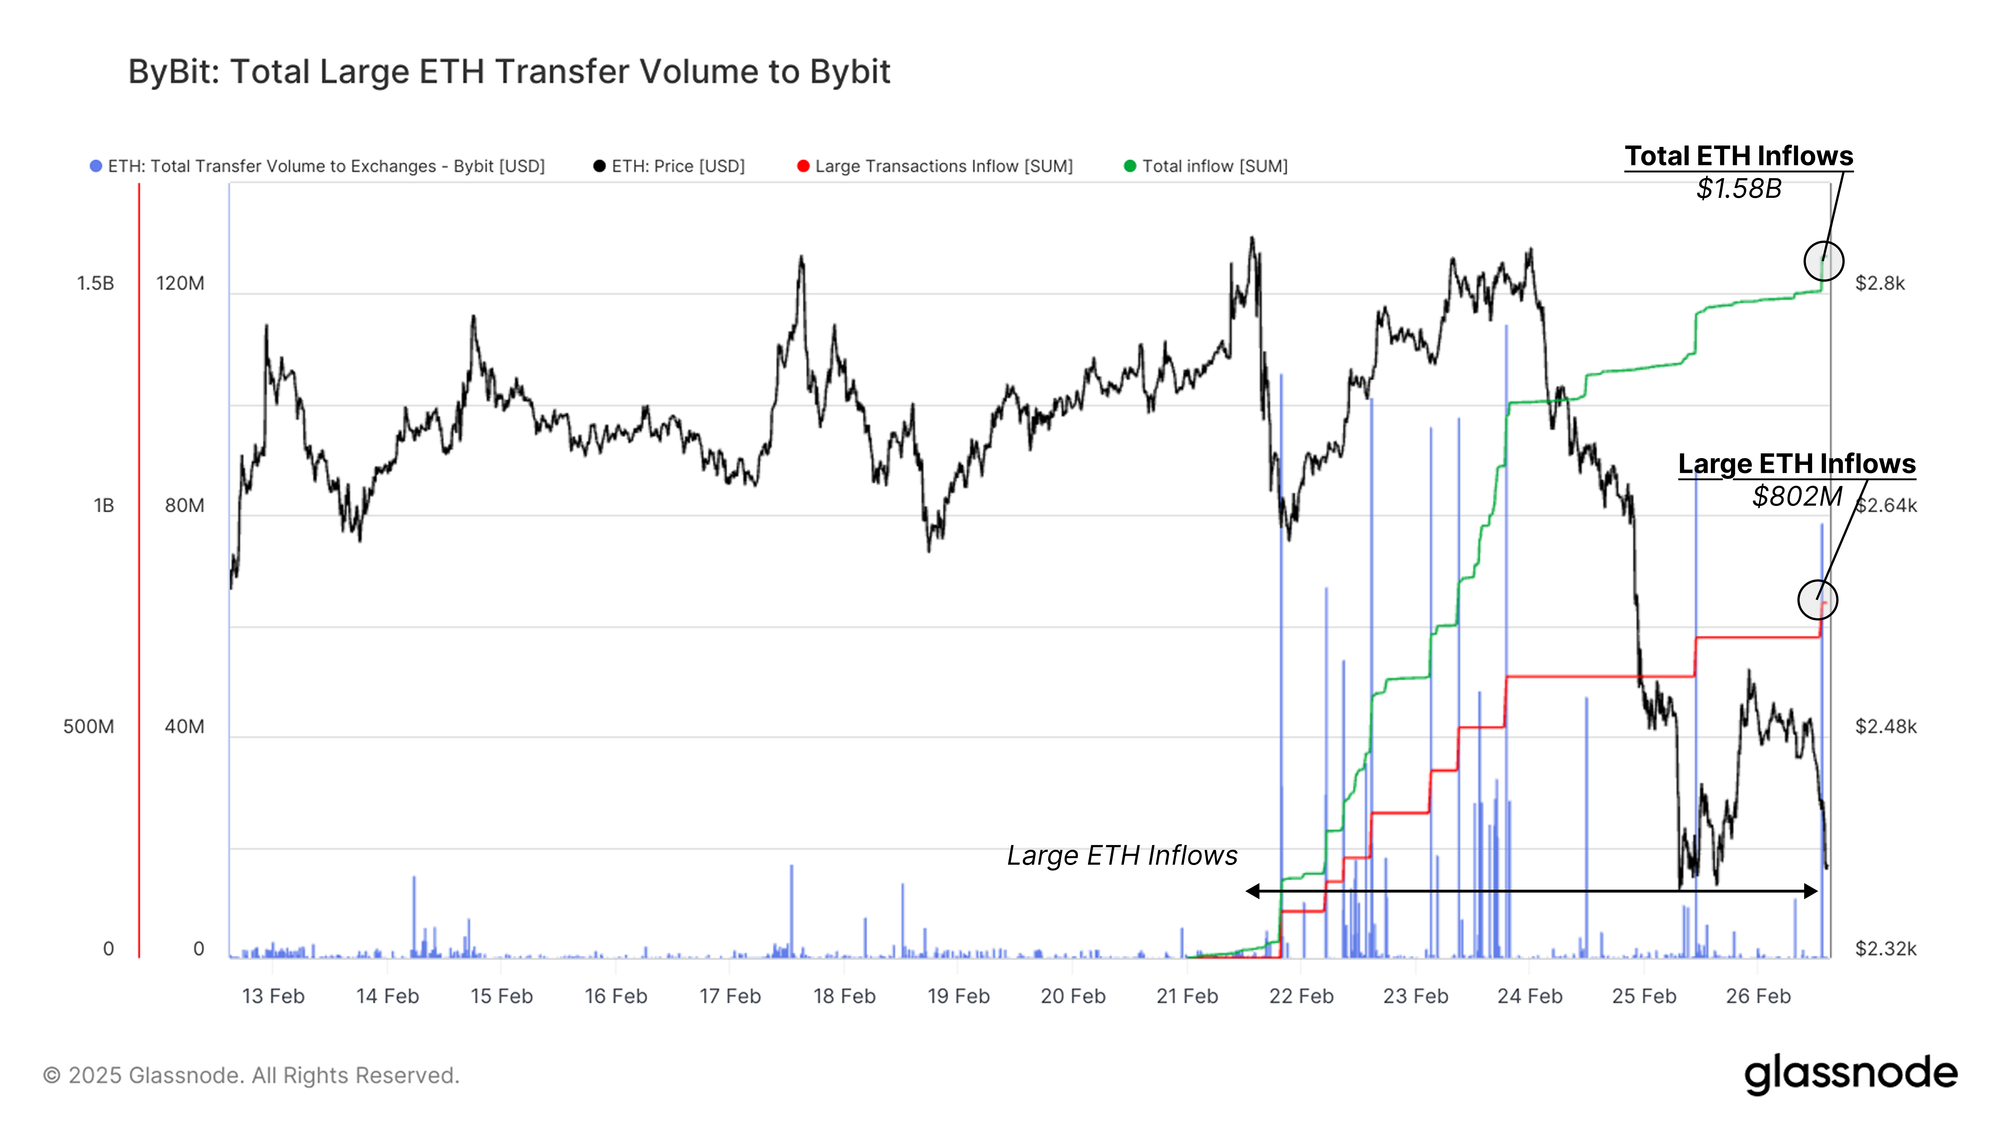
By February 26, 2025, Bybit received a total Ethereum inflow of $1.58B, with $802M (50.7%) originating from just eight large transactions.
These inflows suggest a deliberate effort to replenish reserves, likely through intra-exchange transfers, strategic acquisitions, or external deposits from institutional liquidity providers.
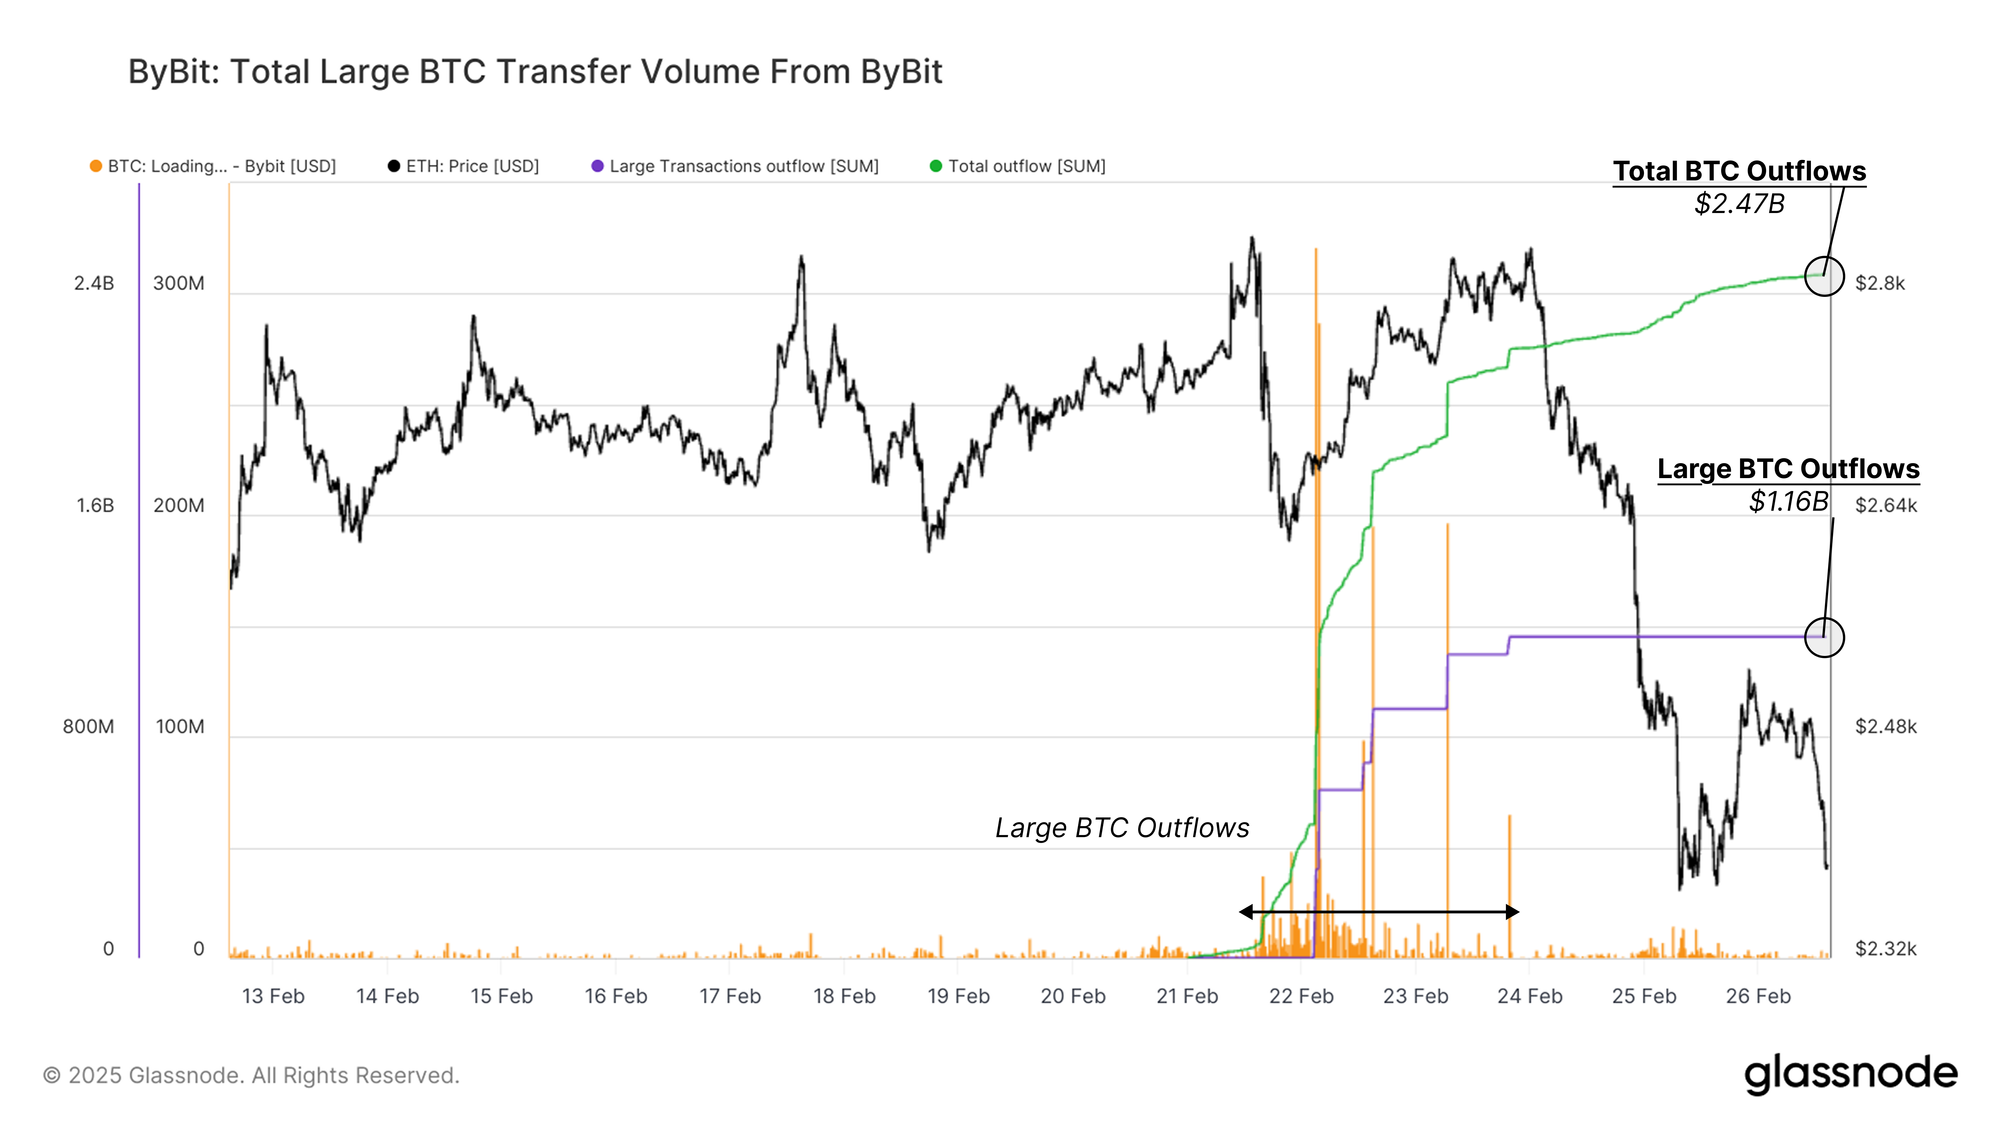
While Bybit worked to replenish its Ethereum reserves, Bitcoin outflows from the exchange have been substantial. Since the time of the hack, Bitcoin outflows totalled $2.47 billion, with 47.2% ($1.16B) exiting via five large transactions.
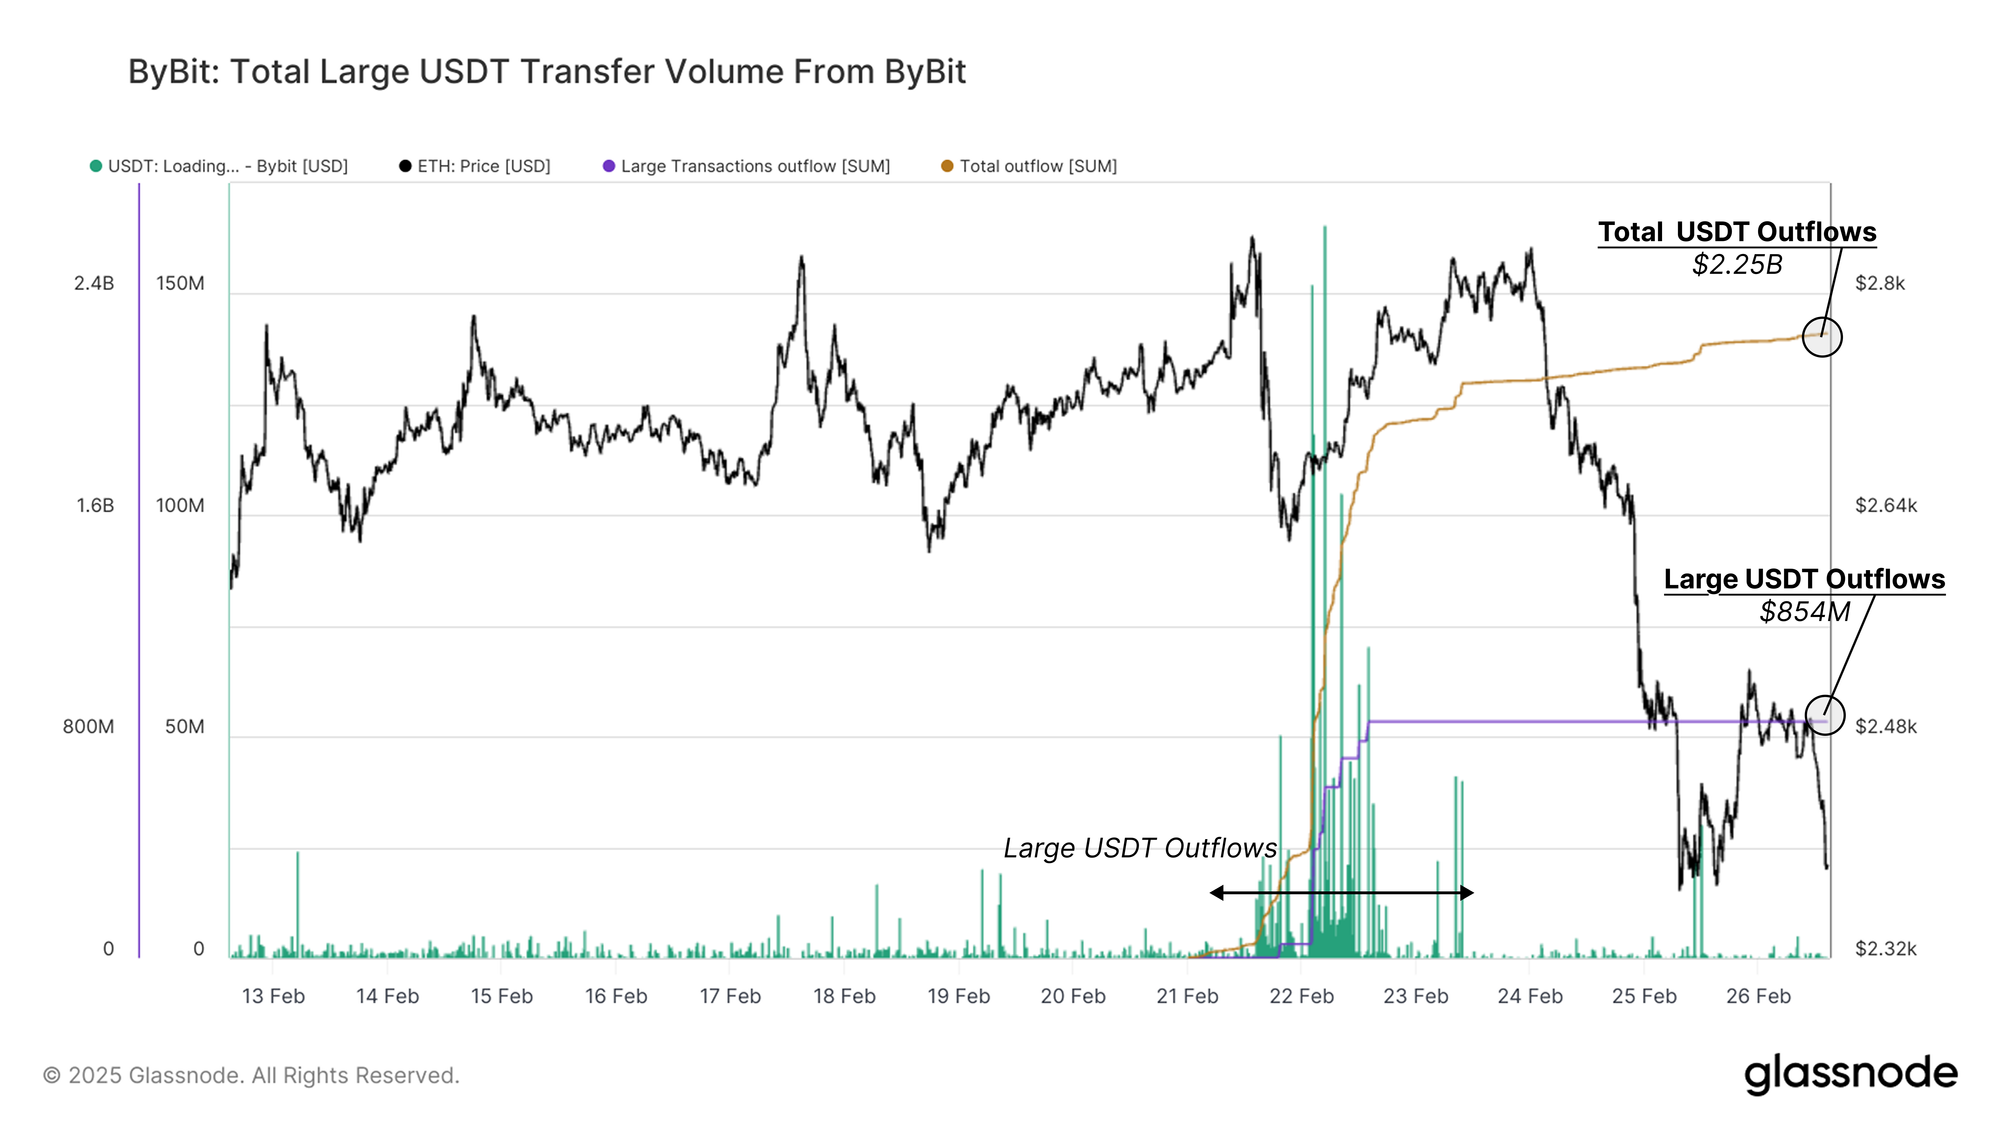
A similar wave of outflows occurred with Tether (USDT). Over the same period, outflows reached $2.25 billion, with 38.1% ($854M) via eight large transactions.
By analyzing Bybit’s Ethereum replenishment efforts alongside significant Bitcoin and Tether outflows, we gain insight into how the exchange - and, by extension, larger entities - responded to one of the largest hacks in crypto history.
Market Turmoil Following the Hack
As the fallout from the Bybit hack unfolded, the market reacted with heightened volatility and a sharp downturn. With declining liquidity across the market and spot demand cooling down, sell pressure intensified, triggering a broader correction.
The intensified market-wide weakness led to Bitcoin price monthly momentum plunging by -13.6% while Ethereum and Solana saw even steeper declines of -22.9% and -40%, respectively. The Meme Coin Index also collapsed by -36.9%, underscoring the sharp risk-off sentiment.
This downturn has reversed months of positive price uptrend, bringing the momentum back to levels last seen in April 2024. The scale of the decline highlights broader fragility in market confidence following the recent ATH in December 2024.
Bitcoin Re-Enters a Low-Liquidity Zone
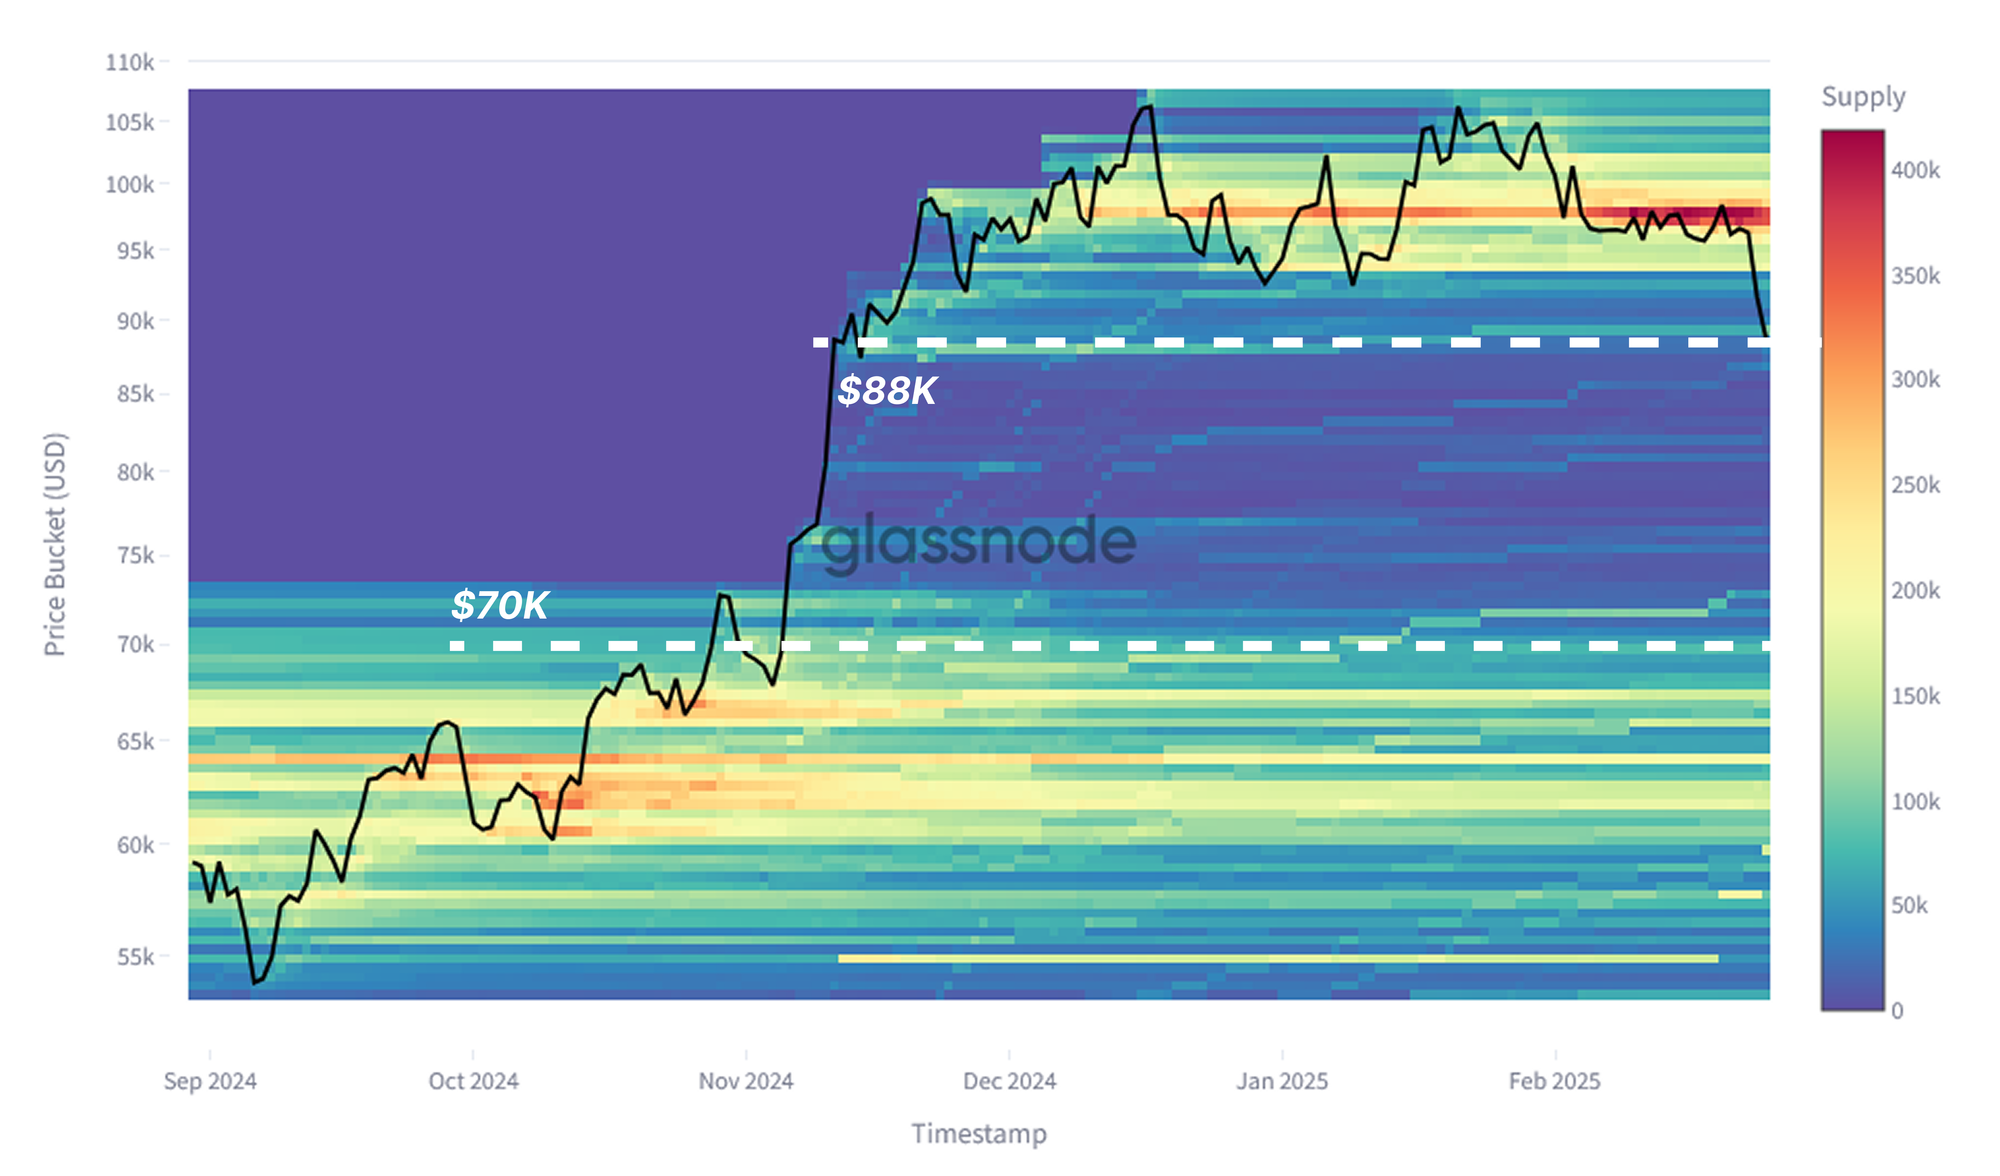
The Cost Basis Distribution (CBD) heatmap illustrates how Bitcoin’s December 2024 ATH created an air gap in realized supply between $70K and $88K. During strong trends, price appreciation tends to outpace capital inflows, leading to lower realized supply concentration in these ranges.
As the market rallied to new highs, long-term holders began distributing supply, weakening price momentum. The Bybit hack further intensified this downtrend, pushing Bitcoin back into the low-liquidity air gap shown in the following chart. With price now retesting this zone, the market is seeking demand, as further downside could trigger heightened volatility and additional sell pressure.
Short-Term Holders Under Pressure
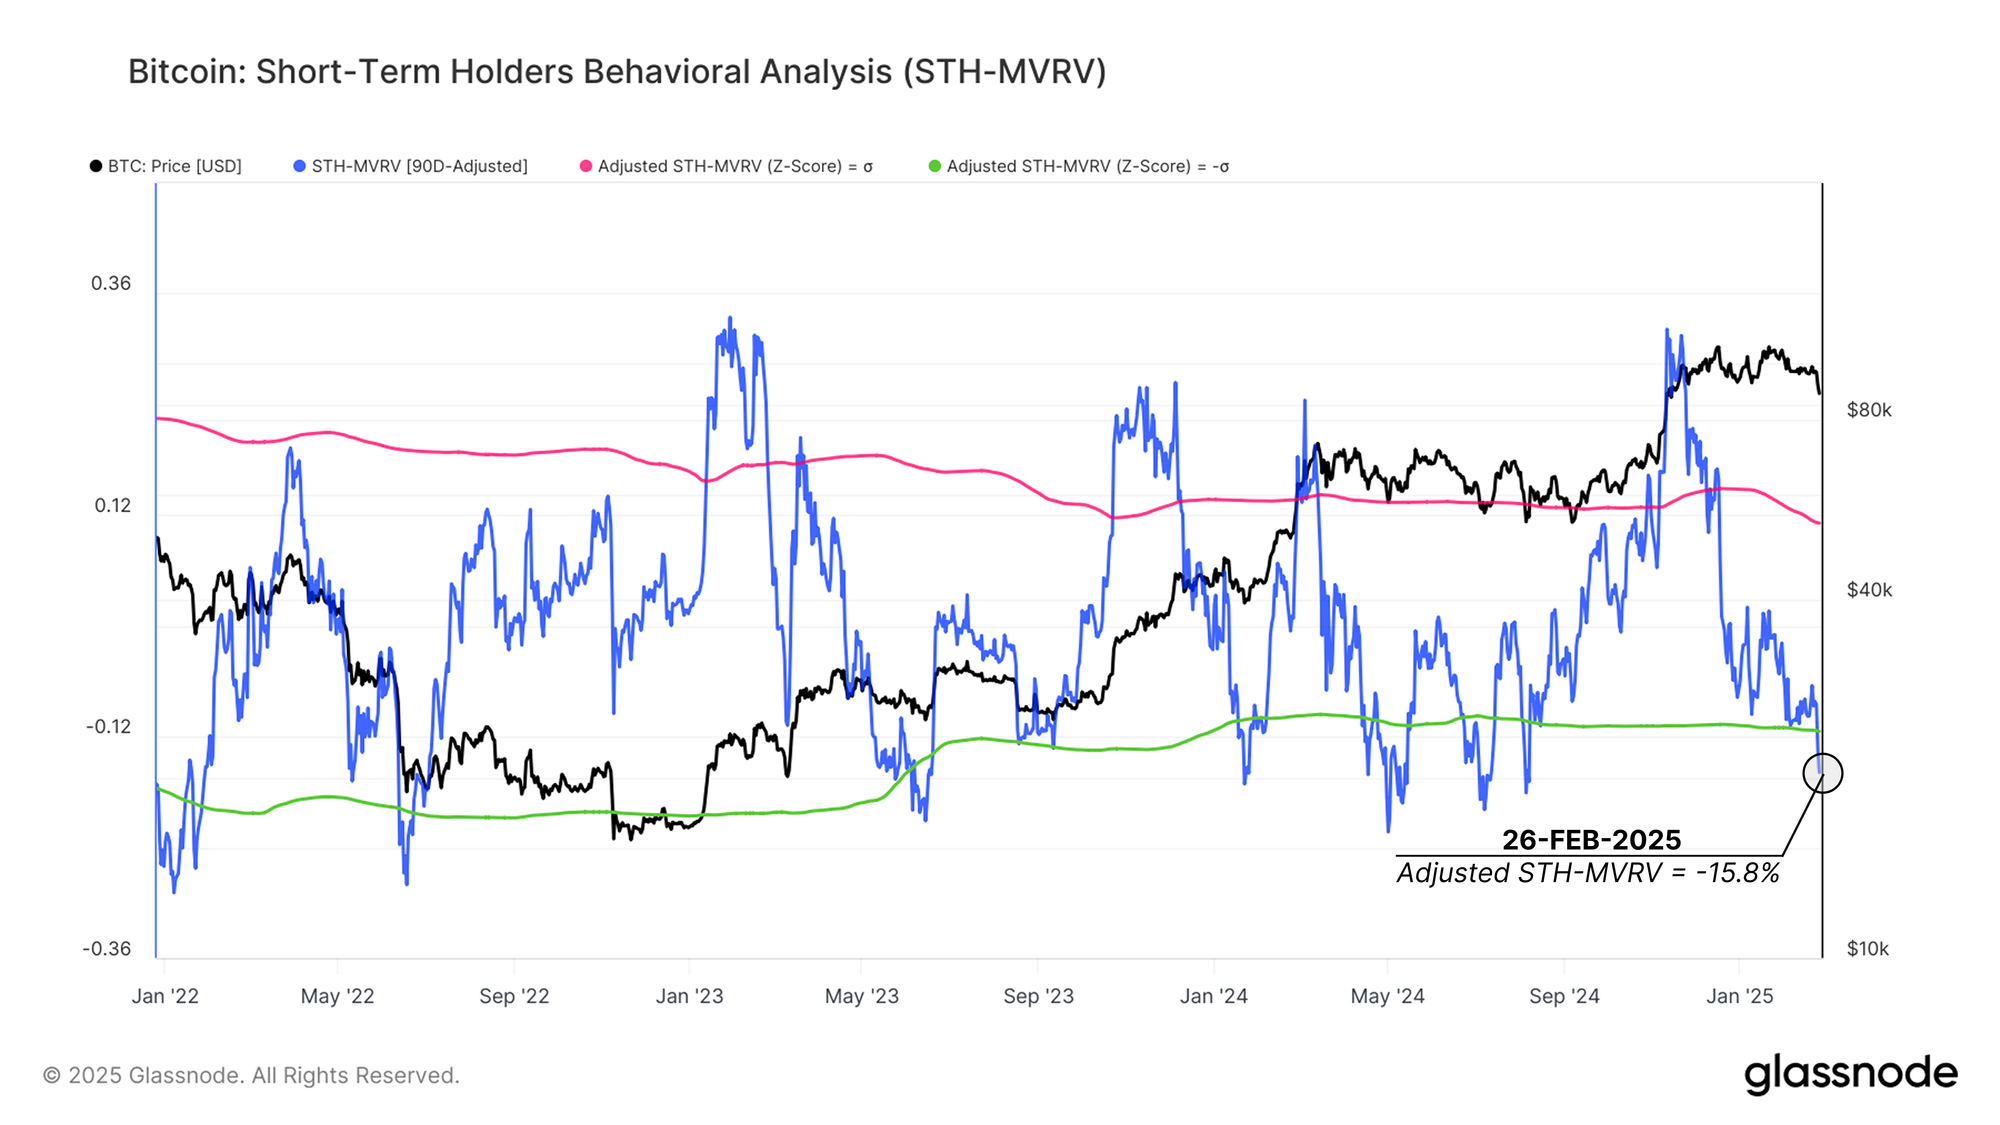
With Bitcoin plunging to $87K, now 20% below its ATH of $109K, recent investors are experiencing severe psychological stress as the price trades ~5% below their cost basis (STH-MVRV = 0.95).
Adjusting STH-MVRV, we observe that new investor profitability has declined -15.8% from its quarterly median, falling below the one standard deviation threshold (-11%). This signals significant unrealized losses, a condition historically leading to capitulation events or forced sell-offs during market downtrends.
Short-Term Holders Begin Realizing Losses
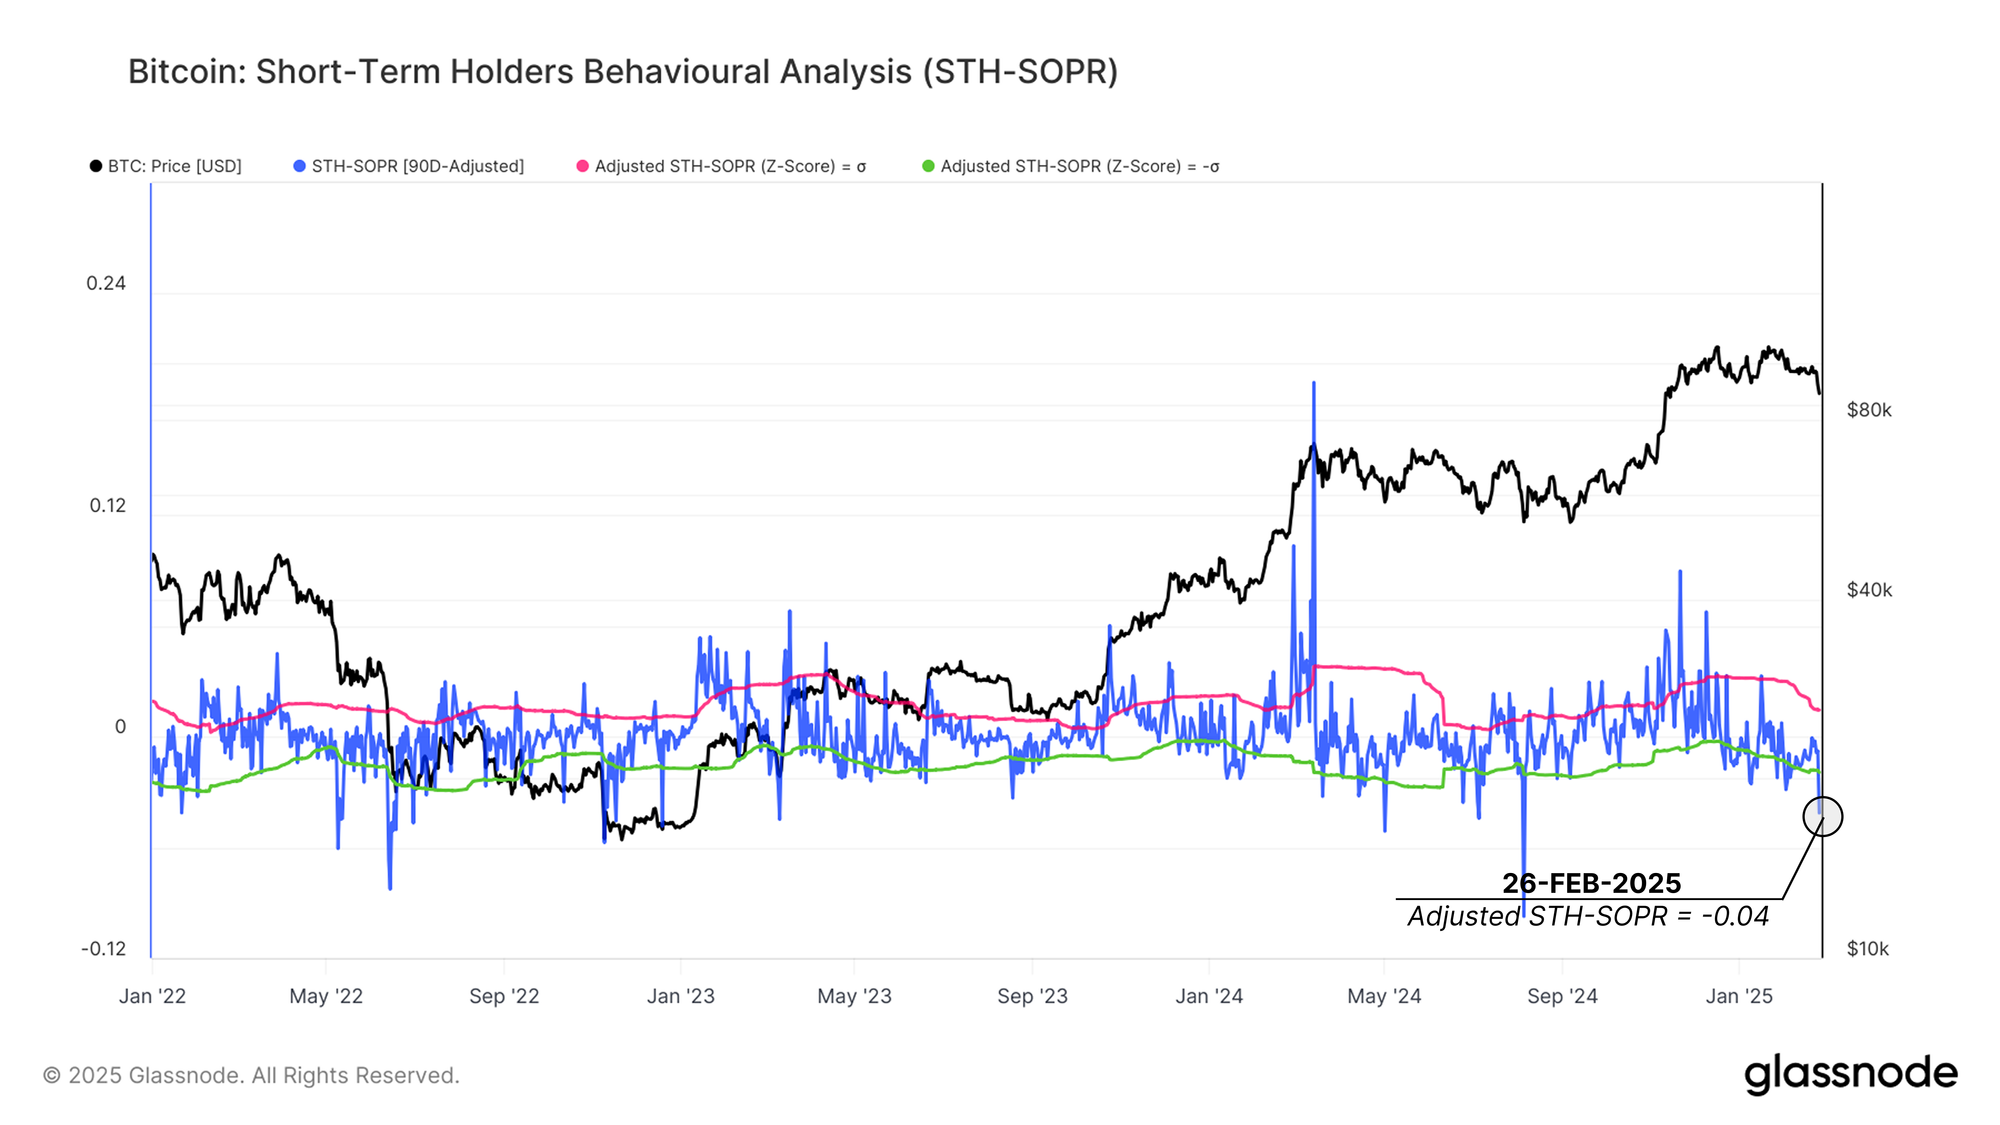
To further analyze new investor reactions, we turn to STH-SOPR (Spent Output Profit Ratio), which measures whether short-term holders are selling at a profit or loss.
- STH-SOPR has dropped by -0.04 below its quarterly median, significantly under the one standard deviation threshold (-0.01).
- This suggests a notable increase in loss realization, as many recent buyers are exiting positions at a loss.
Historically, deep SOPR contractions have led to at least temporary market stabilization as weaker hands exit. However, under current macroeconomic conditions, the risk remains that the price decline could extend further if no strong demand catalyst emerges.
Conclusion & Summary
A broad market correction following the Bybit hack pushed Bitcoin’s monthly performance down to -13.6 %, while Ethereum, Solana, and Meme Coins suffered even steeper losses, resetting market momentum to April 2024 levels.
As Bitcoin retraced into a realized supply “air gap,” short-term holders faced mounting unrealized losses. Accordingly, STH-MVRV and STH-SOPR edged down below their statistical low bands, showing significant loss realization by new investors due to declining profit margins.
If demand fails to recover, further downside risk persists, making the coming weeks critical in determining whether Bitcoin stabilizes or capitulation deepens.
Disclaimer: This report does not provide any investment advice. All data is provided for information and educational purposes only. No investment decision shall be based on the information provided here and you are solely responsible for your own investment decisions.
Exchange balances presented are derived from Glassnode’s comprehensive database of address labels, which are amassed through both officially published exchange information and proprietary clustering algorithms. While we strive to ensure the utmost accuracy in representing exchange balances, it is important to note that these figures might not always encapsulate the entirety of an exchange’s reserves, particularly when exchanges refrain from disclosing their official addresses. We urge users to exercise caution and discretion when utilizing these metrics. Glassnode shall not be held responsible for any discrepancies or potential inaccuracies. Please read our Transparency Notice when using exchange data.
- Join our Telegram channel.
- For on-chain metrics, dashboards, and alerts, visit Glassnode Studio.
