No Catalyst, No Range Break
Bitcoin remains rangebound between $60k and $70k as spot demand shows early absorption and derivatives reset. Volatility cools and positioning balances, but without a clear catalyst, the market lacks the conviction needed for a sustained breakout.


This report is also freely available for download in PDF format.
Executive Summary
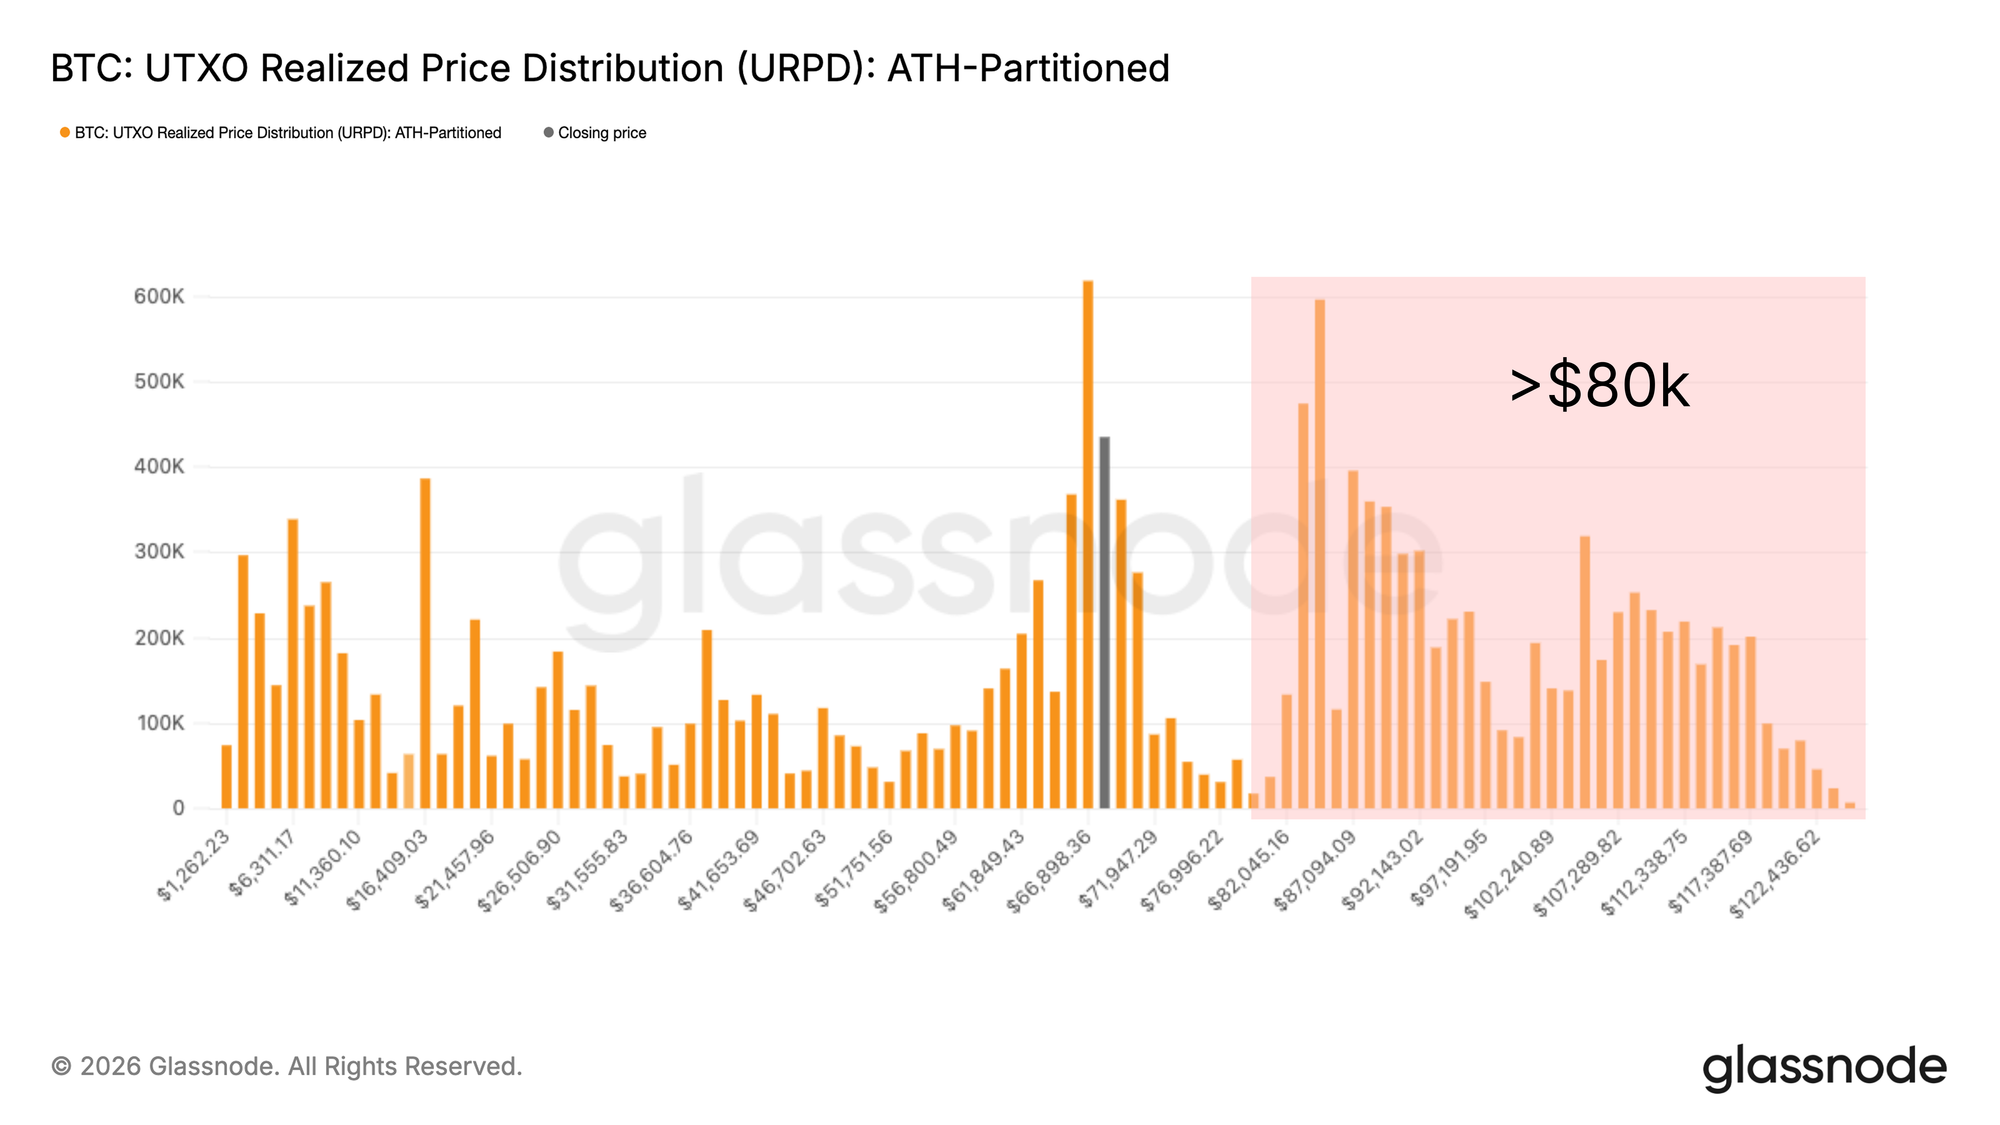
- Bitcoin remains rangebound between $60k and $70k, while URPD shows a dense overhead supply cluster from $80k to $126k that likely requires either deeper price discount or more time to redistribute.
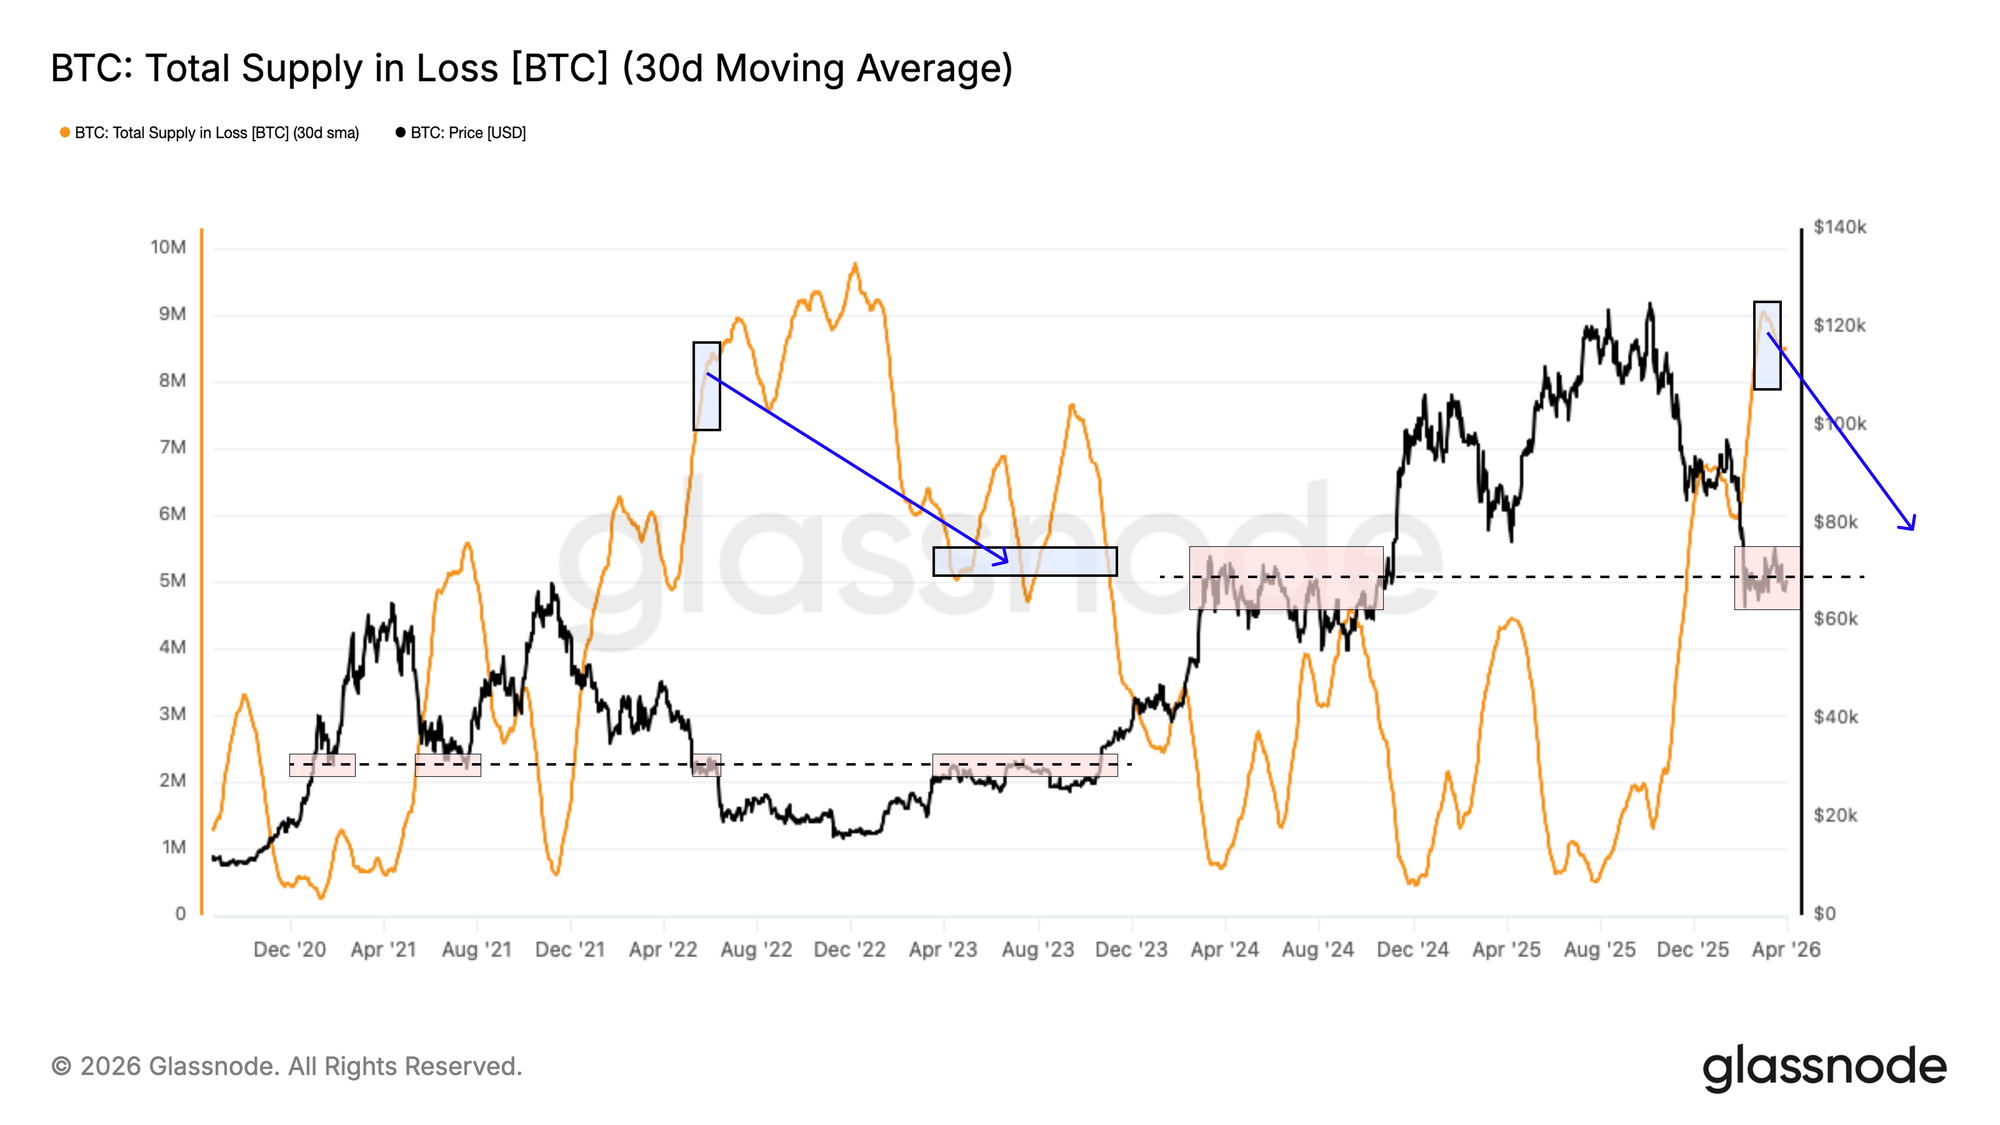
- Total Supply in Loss sits near 8.4M BTC, echoing the Q2 2022 structure, when roughly 3M BTC needed to be redistributed before the market could reclaim its cycle mid-line.
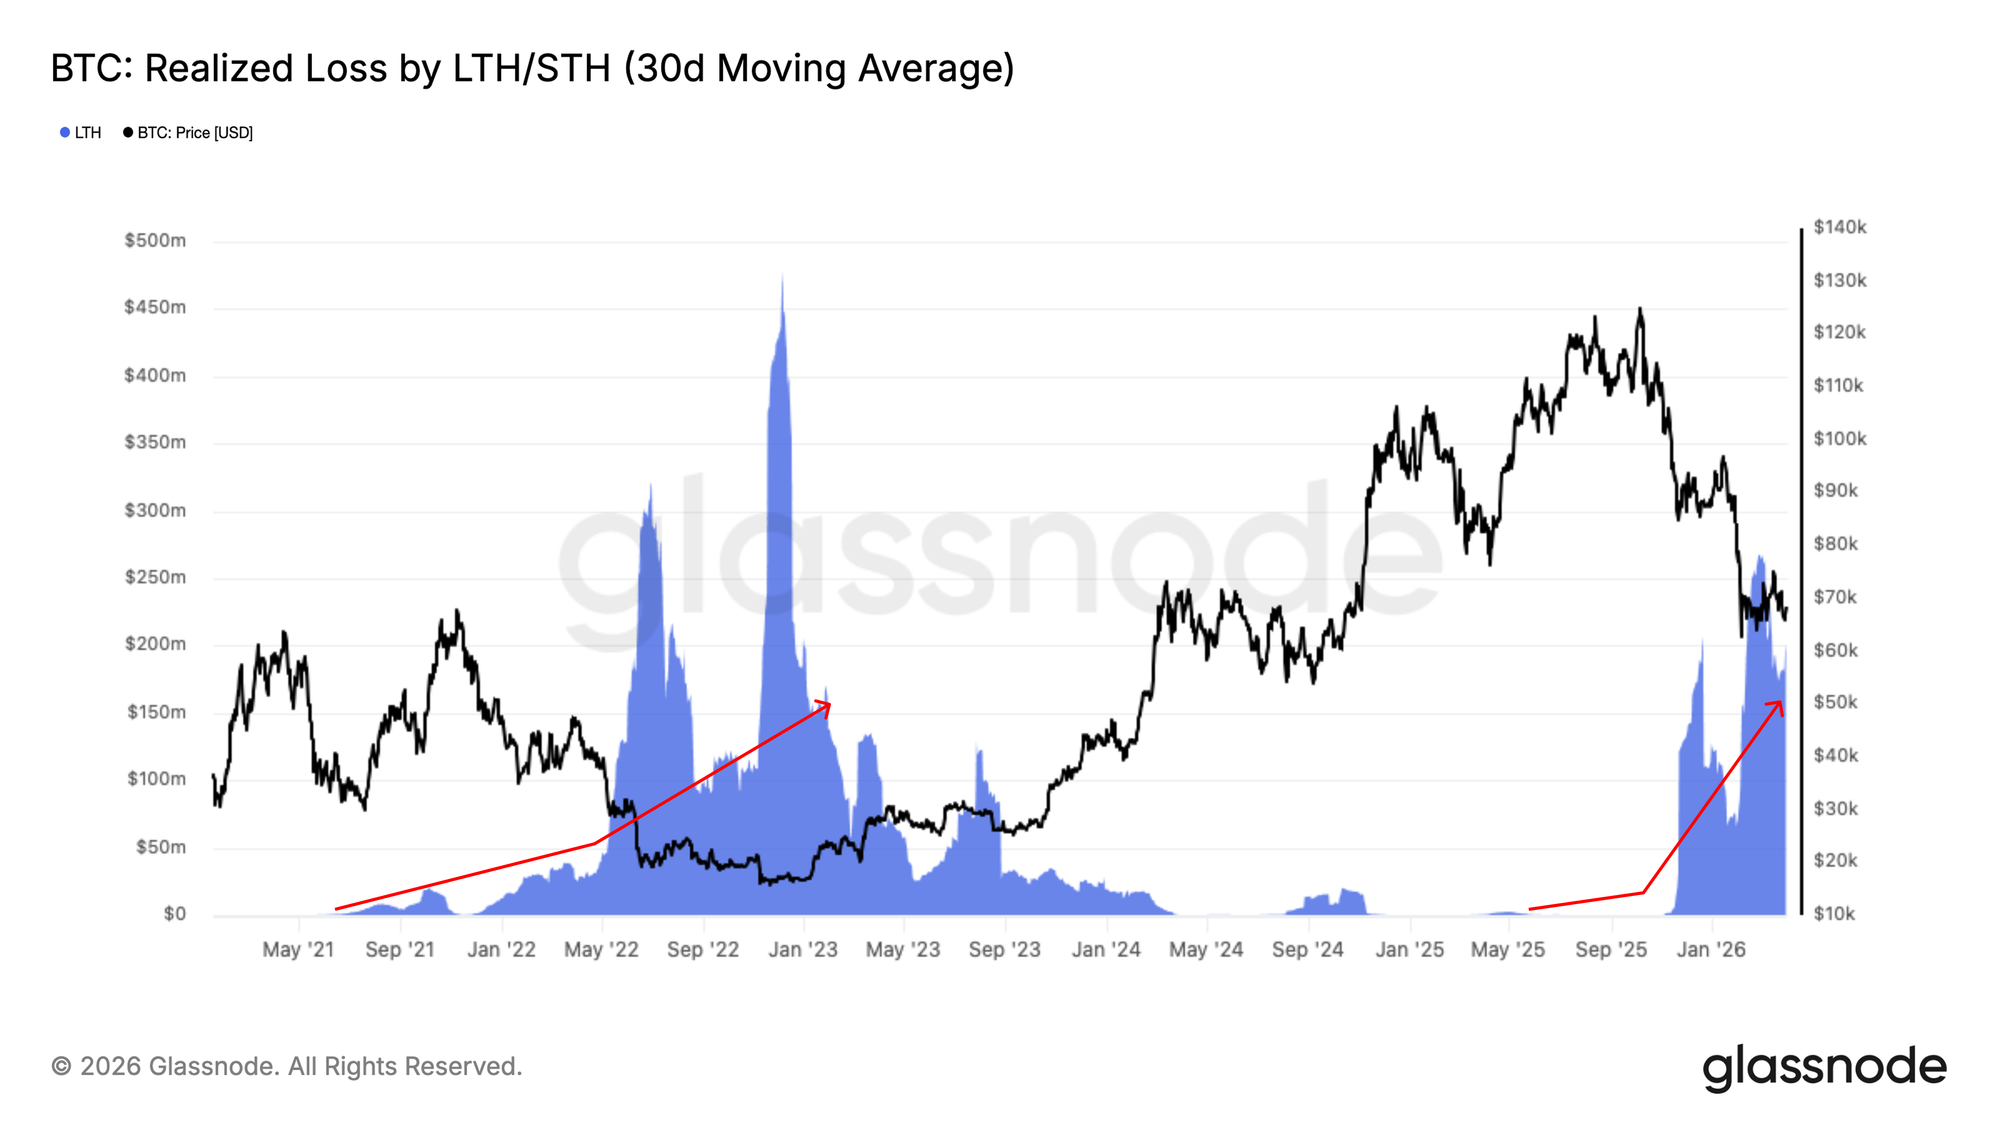
- LTH Realized Loss has climbed to $200M/day since November 2025, confirming active capitulation, while a cooldown below $25M/day remains the key threshold for base formation.
- Coinbase Spot CVD has turned marginally positive, suggesting spot buyers are starting to absorb sell-side pressure, though demand remains well below the levels typically seen at durable lows.
- Corporate treasury flows are becoming more concentrated, with Marathon distributing roughly 15k BTC and Strategy remaining the only consistent large-scale buyer.
- The Perpetual Market Directional Premium has compressed back toward neutral and slightly below zero, reflecting a reset in long-biased leverage and cooling speculative appetite.
- Perpetual positioning is now far less momentum-driven, with bullish exposure being unwound and short-side interest re-emerging, leaving futures more balanced but also more cautious.
- Implied volatility continues to soften across the curve, suggesting options markets are pricing a calmer near-term environment and reduced demand for volatility exposure.
- Downside skew is beginning to rebuild, signalling some return in protective positioning, though levels remain well below those typically associated with stronger hedging demand.
- Gamma positioning has flipped back into supportive territory, reducing downside convexity and pointing to a more stable near-term dealer setup after the recent negative gamma regime.

On-Chain Insights
Weight of Underwater Supply
With price consolidating in the $60k–$70k range, this report steps back from near-term price dynamics to assess the structural forces shaping the current market environment. As outlined in recent editions, one of the most persistent headwinds bearing down on momentum is the significant volume of supply acquired above $80k, now held at an unrealized loss.
This cohort, having weathered more than six months of bear market conditions, faces a binary behavioural choice:
- Sell into any relief rally to minimize further losses, or
- Psychologically capitulate as the drawdown extends.
The UTXO Realized Price Distribution (URPD) chart illustrates this clearly, revealing a well-distributed supply cluster spanning the $80k–$126k range that sits firmly overhead. Resolving this overhang will likely require either a meaningful price discount to attract new buyers or an extended period of time for these coins to migrate from loss-realizing hands into more committed ownership.
Facing Coins Underwater
To place the overhead supply overhang in a precise quantitative context, the Total Supply in Loss metric counts the volume of circulating Bitcoin last moved at a price above the current spot level. Applying a 30-day SMA to smooth short-term noise, this indicator currently registers approximately 8.4M BTC, meaning roughly 8M to 9M coins have remained underwater on a sustained basis over the past month.
The magnitude of this figure, combined with spot price trading near the current cycle mid-line, implies a structural resemblance to conditions observed in Q2 2022. Historically, resolving a supply overhang of this scale has required a meaningful redistribution of coins from loss-realizing holders to new buyers at lower prices. The 2022 bear market precedent is instructive. Conventionally, Total Supply in Loss compressed from above 8M BTC to approximately 5M BTC before the market decisively reclaimed its cycle mid-line, implying roughly 3M coins changed hands before conditions normalized.
Tracking the Redistribution in Progress
Having established the scale of underwater supply requiring redistribution, the next step is monitoring the pace at which this process is unfolding. The Long-Term Holder Realized Loss metric measures the aggregate dollar value of losses being crystallized by investors who acquired their coins more than six months ago and are now selling below their cost basis, directly capturing the active redistribution of the overhead supply identified above.
The 30-day SMA of this indicator has been rising steadily since November 2025 and is now elevated at approximately $200M per day, confirming that long-term holders are increasingly capitulating into the current market. While this wave of loss realization is a necessary and constructive step in the bear market resolution process, it is not yet sufficient on its own. A meaningful cooldown toward levels below $25M per day would represent a more compelling signal of exhaustion in selling pressure, and a prerequisite for the base formation that historically precedes a sustainable bull market transition.
Off-Chain Insights
Coinbase Spot Demand Returns
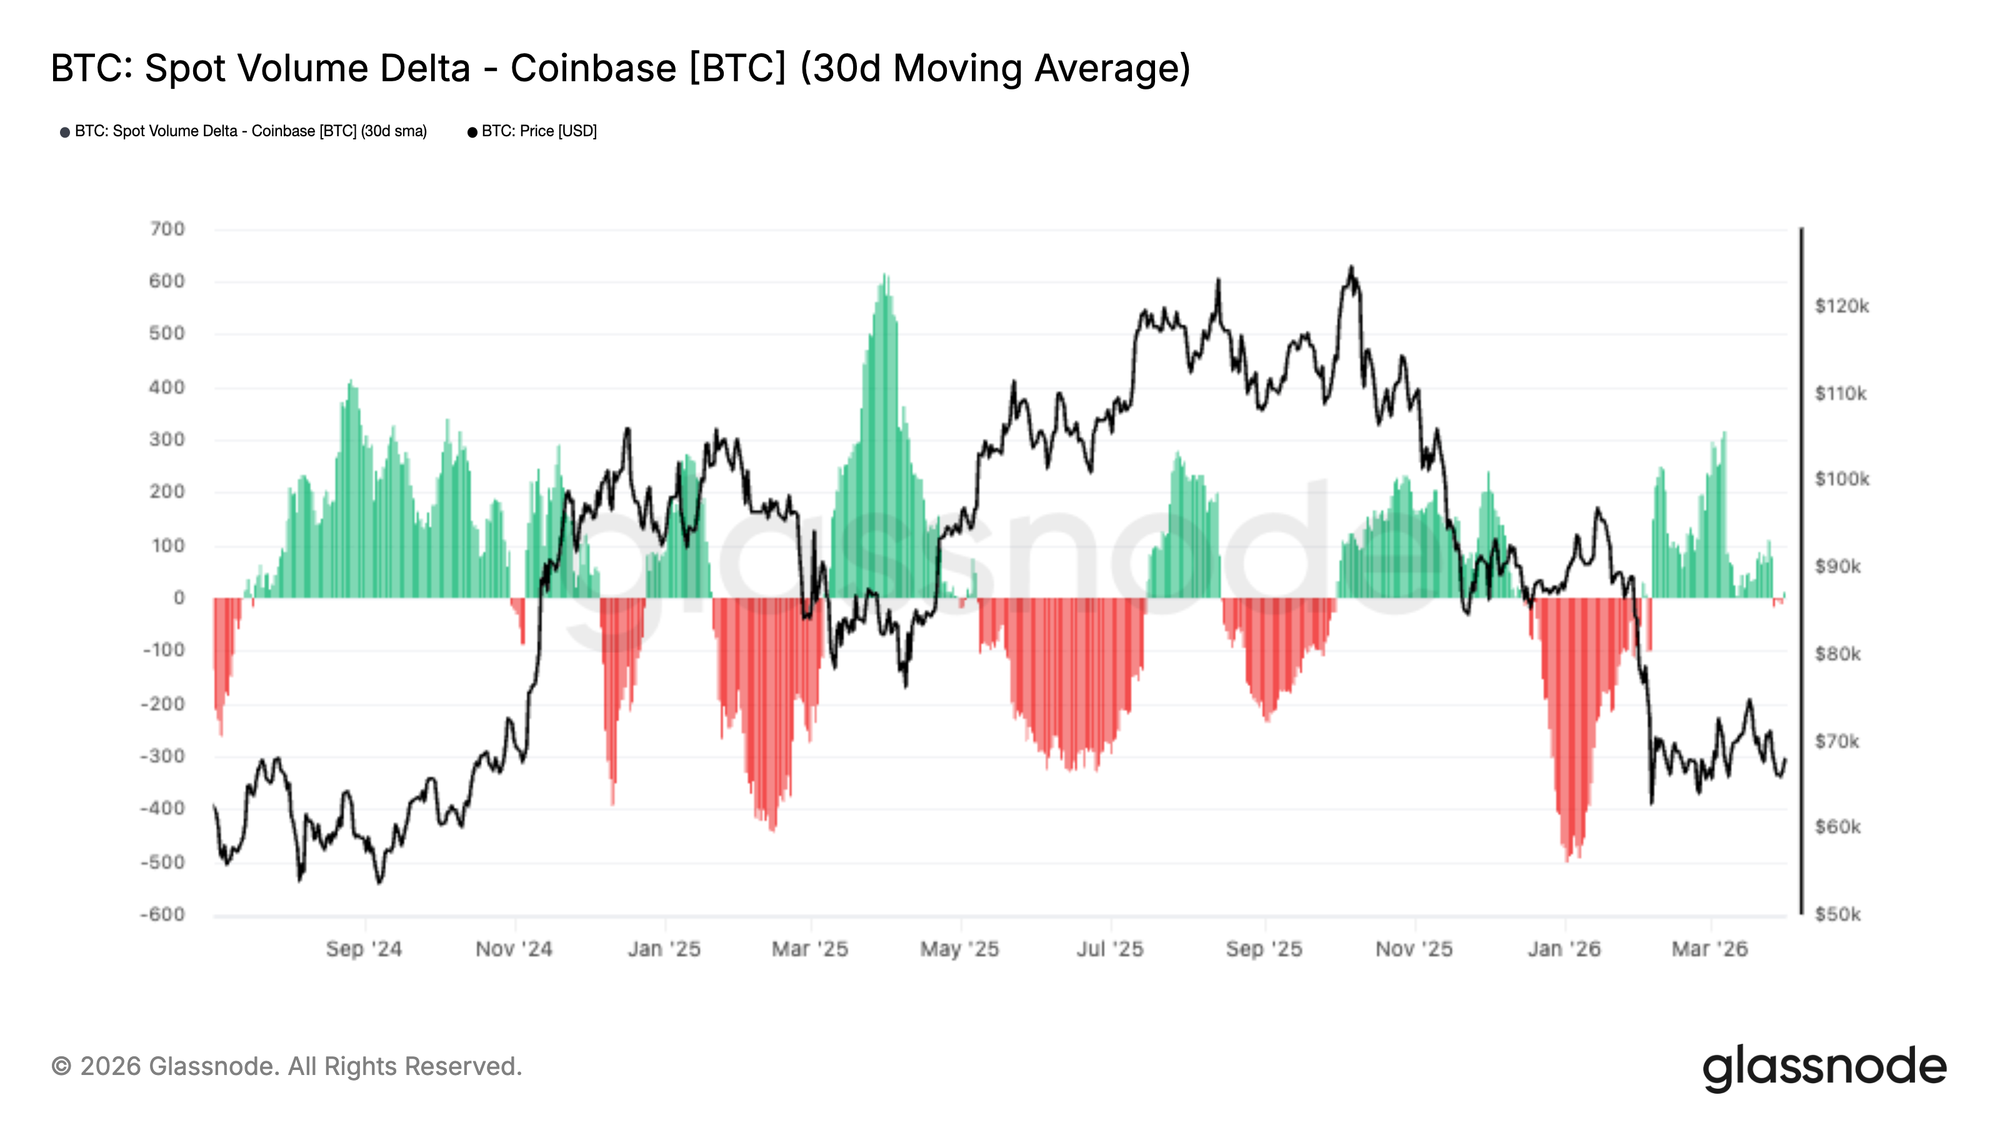
Spot markets are showing early signs of stabilisation, with the 30-day moving average of Coinbase Spot Volume Delta turning marginally positive in the latest data. This follows an extended stretch of negative readings through January and early February, where persistent sell-side pressure reflected continued distribution.
The recent shift suggests buyers are beginning to absorb available supply and provide support as price stabilises. However, the scale of positive delta remains modest, indicating that demand is still tentative rather than conviction-led.
Historically, stronger recoveries have required sustained periods of positive spot flow, while short bursts of buying have often struggled to generate follow-through. For now, the latest uptick is constructive, but a more durable recovery will likely require continued expansion in buy-side pressure.
Corporate Flows Turn Mixed
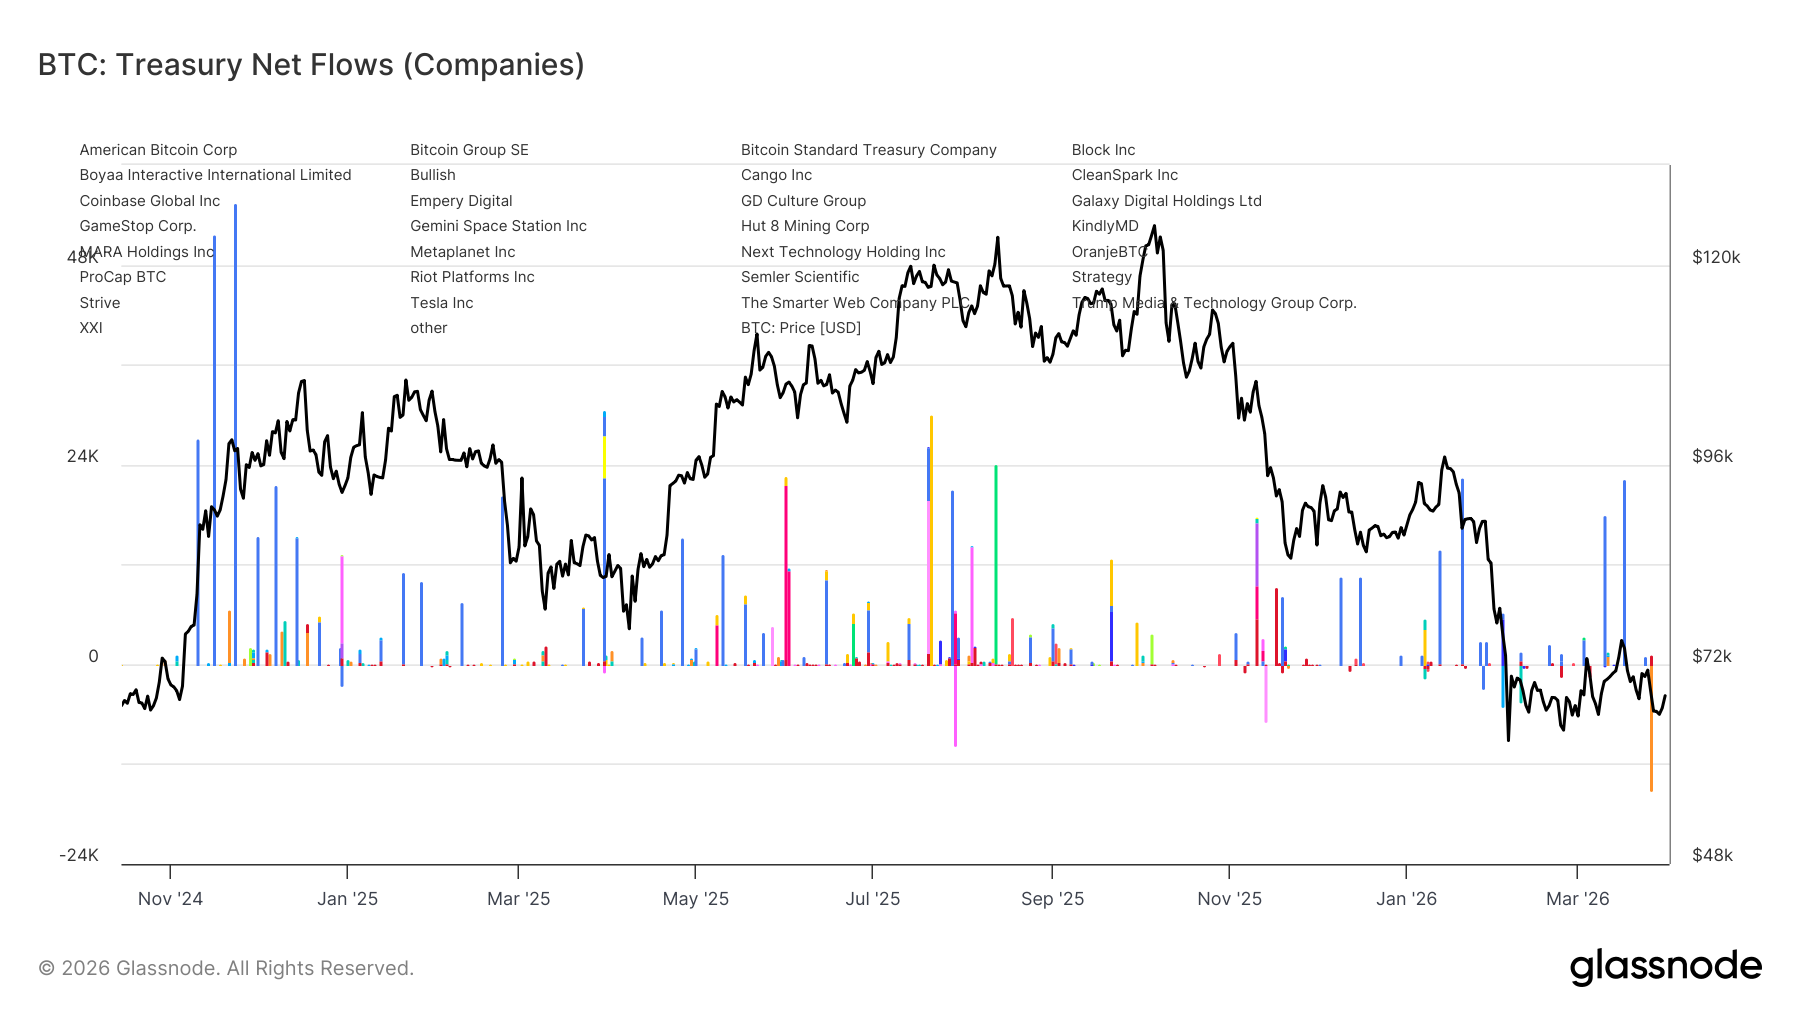
Corporate treasury flows have become far less broad-based in recent months, with the latest data showing a more uneven and selective pattern of activity. Earlier in the cycle, corporate accumulation was supported by a wider set of allocators, but recent flows suggest that bid support is becoming increasingly concentrated.
Most notably, Marathon has sold roughly 15k BTC, marking one of the clearest recent examples of a corporate treasury reducing exposure rather than adding to it. Against that, Strategy appears to remain the only consistent structural buyer, continuing to step in with periodic purchases even as participation from other firms has become more sporadic.
This shift points to a meaningful change in market structure. Rather than a broad corporate accumulation trend, treasury demand now appears narrower and more dependent on a single dominant participant. As a result, the corporate bid remains present, but it is less broad and therefore a less robust source of structural support than during earlier phases of the cycle.
Perpetual Premium Resets
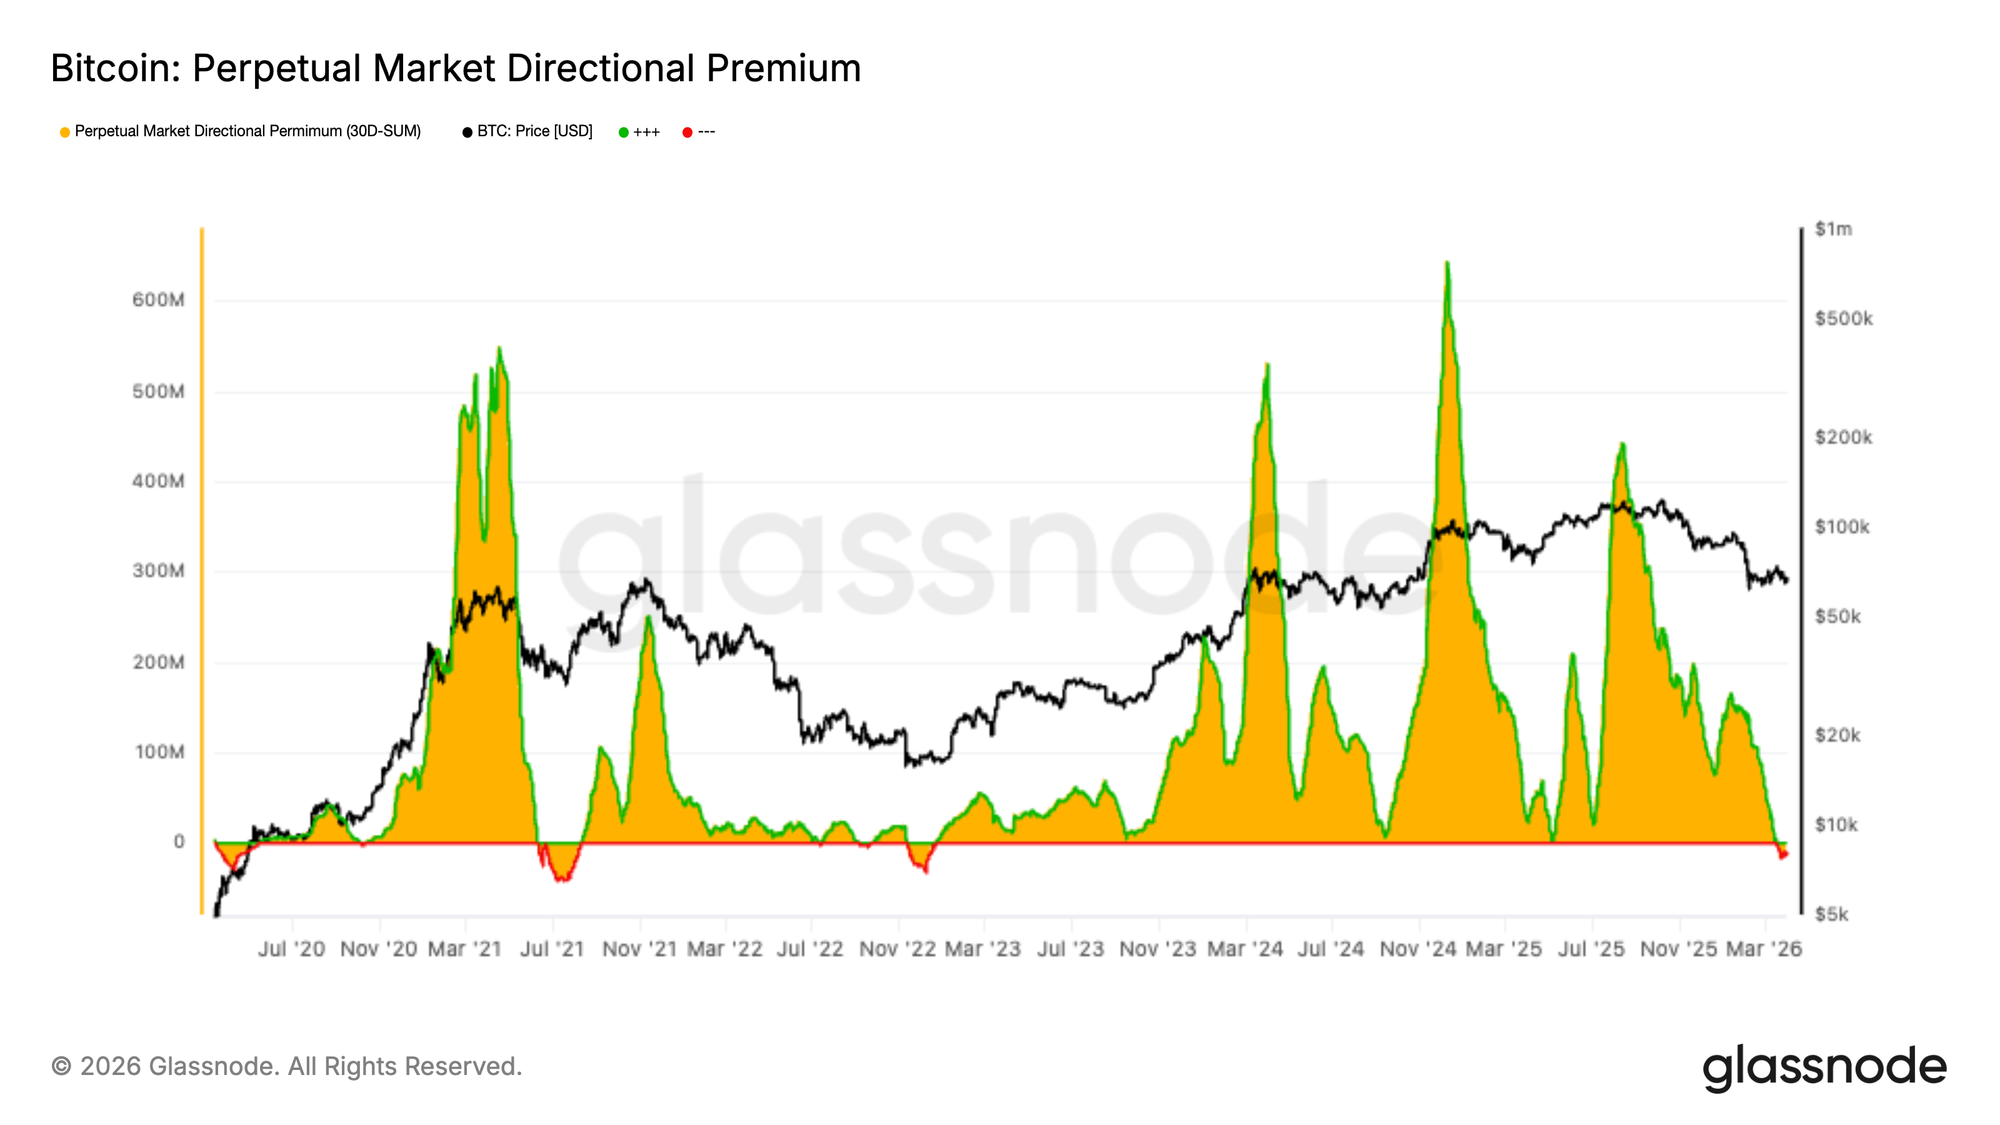
The Perpetual Market Directional Premium continues to compress, with the 30-day sum now near neutral and marginally below zero. This marks a clear cooling from the long-biased conditions that supported the prior advance.
The shift suggests bullish speculative positioning is being unwound, while short-side interest is beginning to re-emerge. Rather than reflecting strong conviction, the current structure points to a more cautious and balanced perpetuals market.
Historically, resets in directional premium often accompany consolidation or trend exhaustion, as leverage is repriced after an extended move. In that sense, the latest rollover suggests speculative appetite has faded, leaving perpetual markets completely reset with muted leverage.
Volatility Expectations Are Resetting Lower
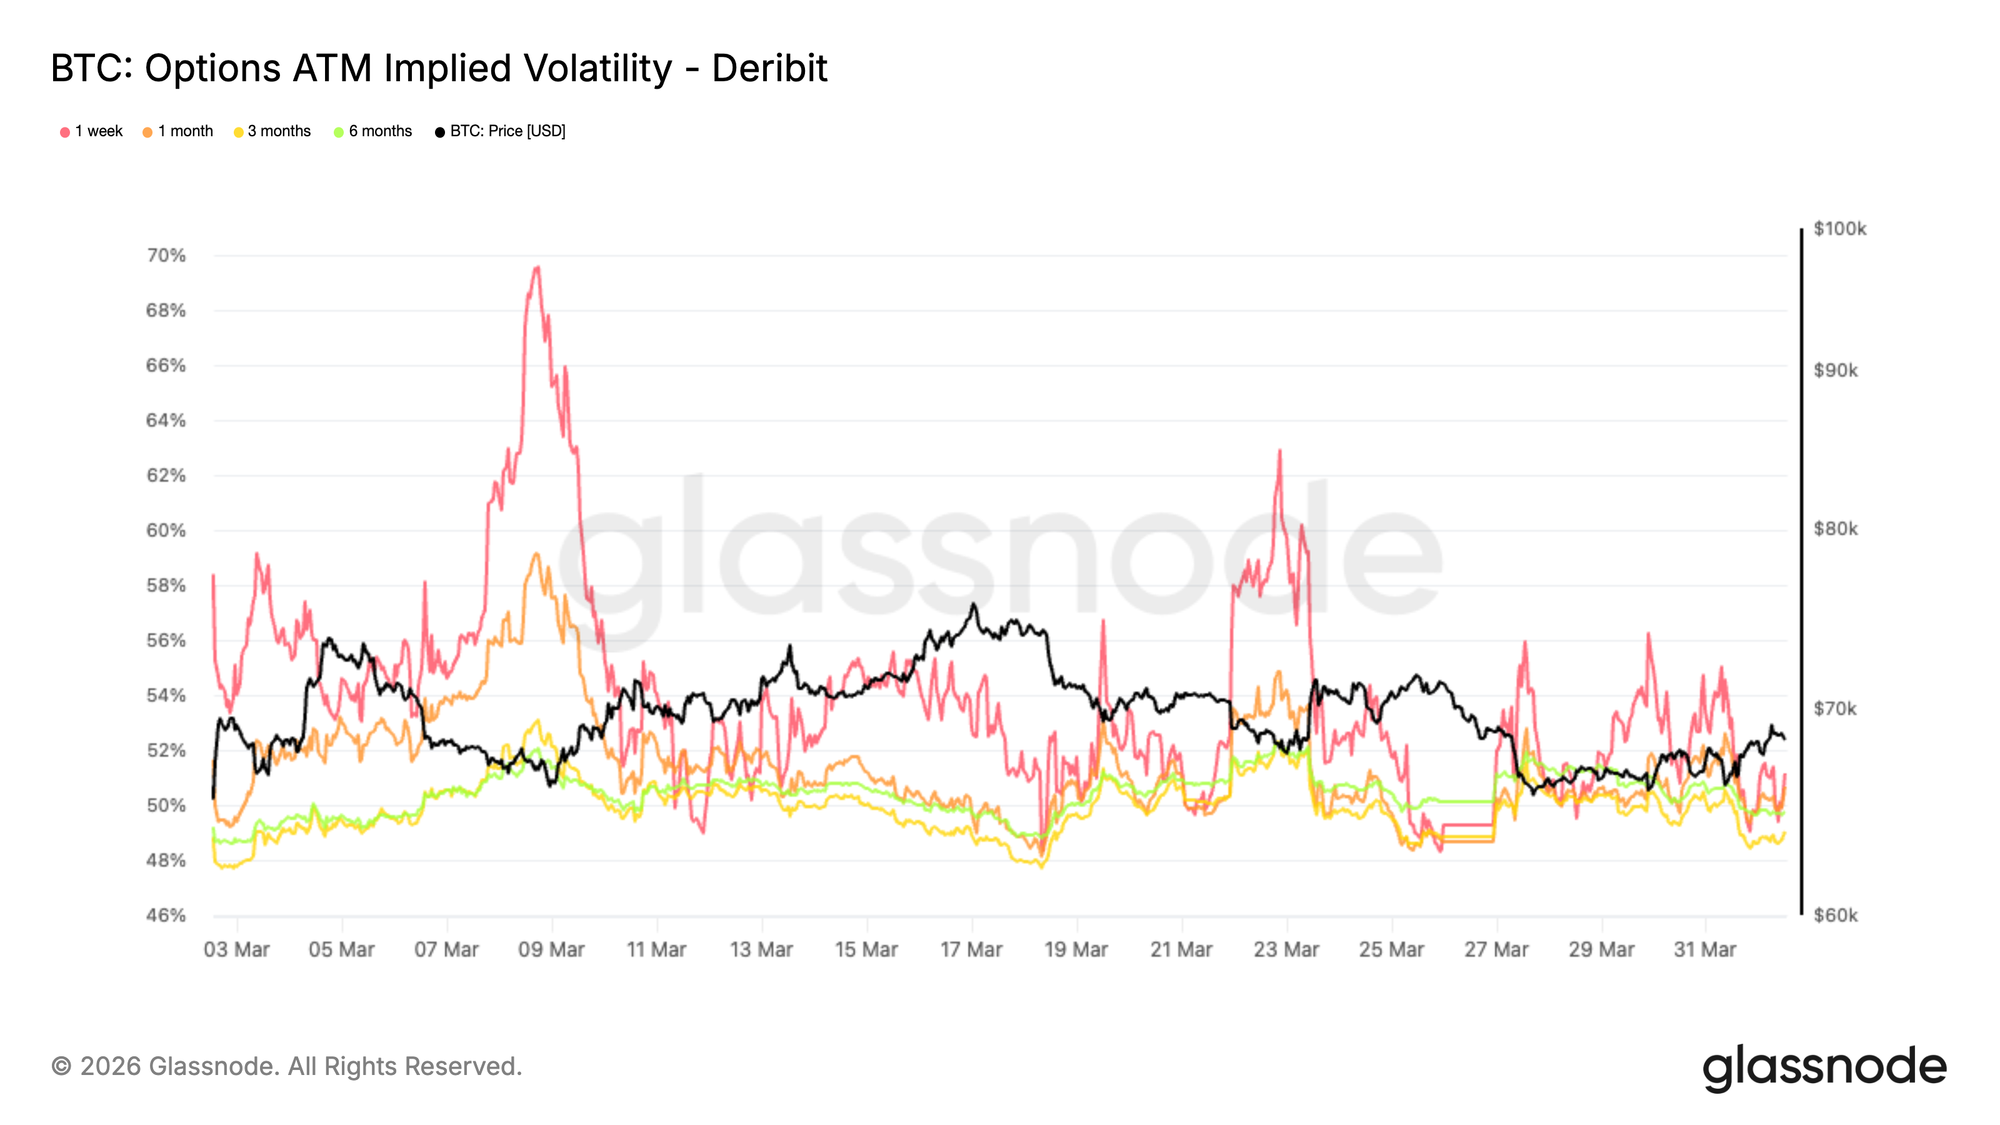
After the resets in options market positioning, implied volatility is the first place where the shift becomes visible. Bitcoin’s volatility term structure has moved lower across maturities compared to last week, with the front end leading the decline. The 1 week ATM implied volatility now sits at 51%, while the 3 month is at 49%, with other maturities tightly clustered in between, including the 6 month at 49.8%, pointing to a notably compressed term structure.
This reflects a market that is dialing back expectations for large near term moves, despite an uncertain macro backdrop. Longer dated maturities remain relatively more supported, suggesting that uncertainty has not disappeared but is being pushed further out in time. In the short term, pricing is transitioning toward a more contained volatility regime, where immediate catalysts are lacking and demand for optionality has faded.
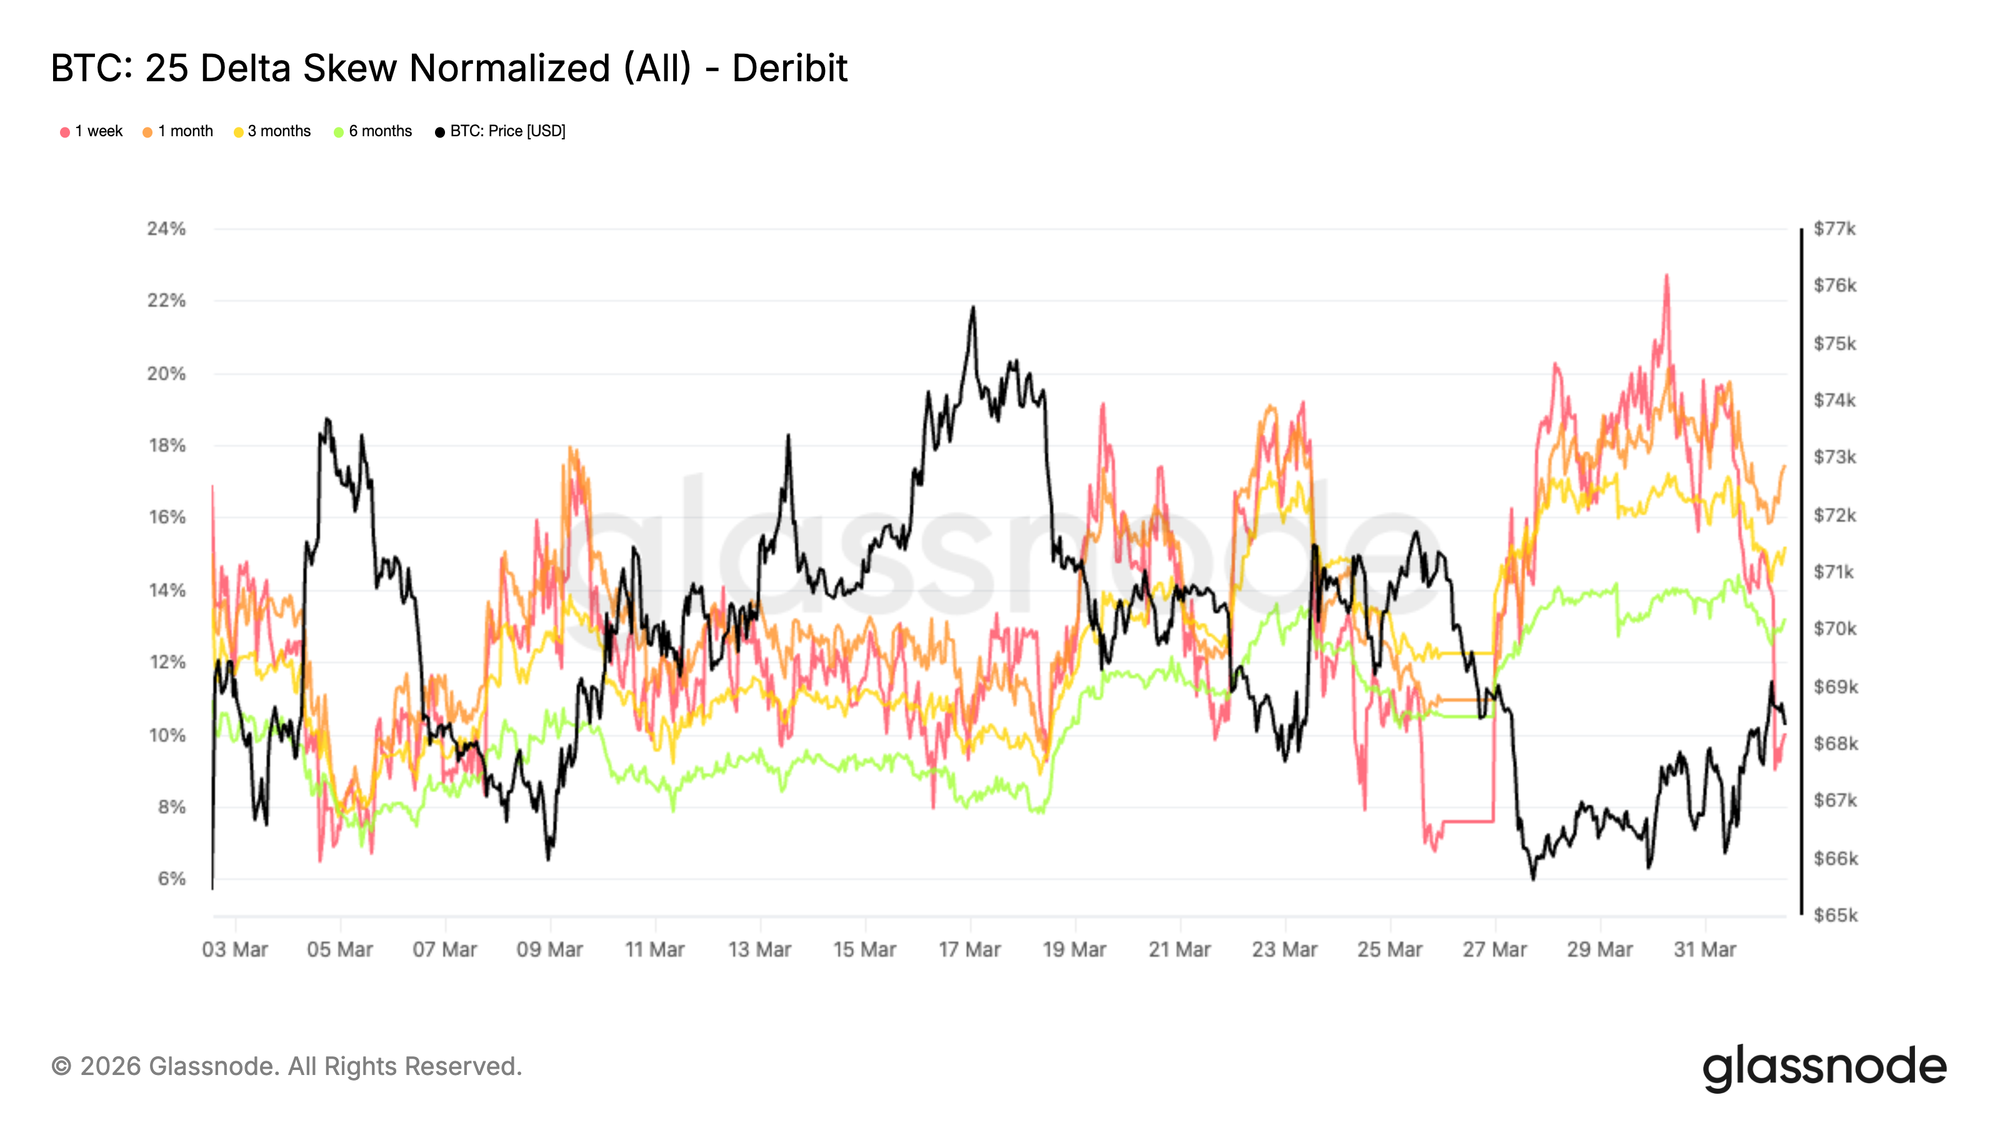
Downside Protection Starts to Rebuild
As volatility expectations soften, skew reveals a more cautious shift in positioning. The 25 delta skew, calculated as puts minus calls, indicates that the higher the skew, the more pricing is tilted toward downside protection. Last week, the 1 week skew printed a new monthly high at 22.7% before retracing, reflecting its sensitivity to immediate price action. In contrast, longer maturities have continued to grind higher and remain elevated, with the 1 month at 17.4% and the 6 month at 13.2%.
This divergence across tenors is telling. While short term hedging demand has eased slightly with the recent stabilization, medium and longer dated protection remains firmly bid. The market is not aggressively pricing large moves, but it is consistently assigning more weight to downside risks across the curve, pointing to a sustained defensive bias rather than a temporary reaction.
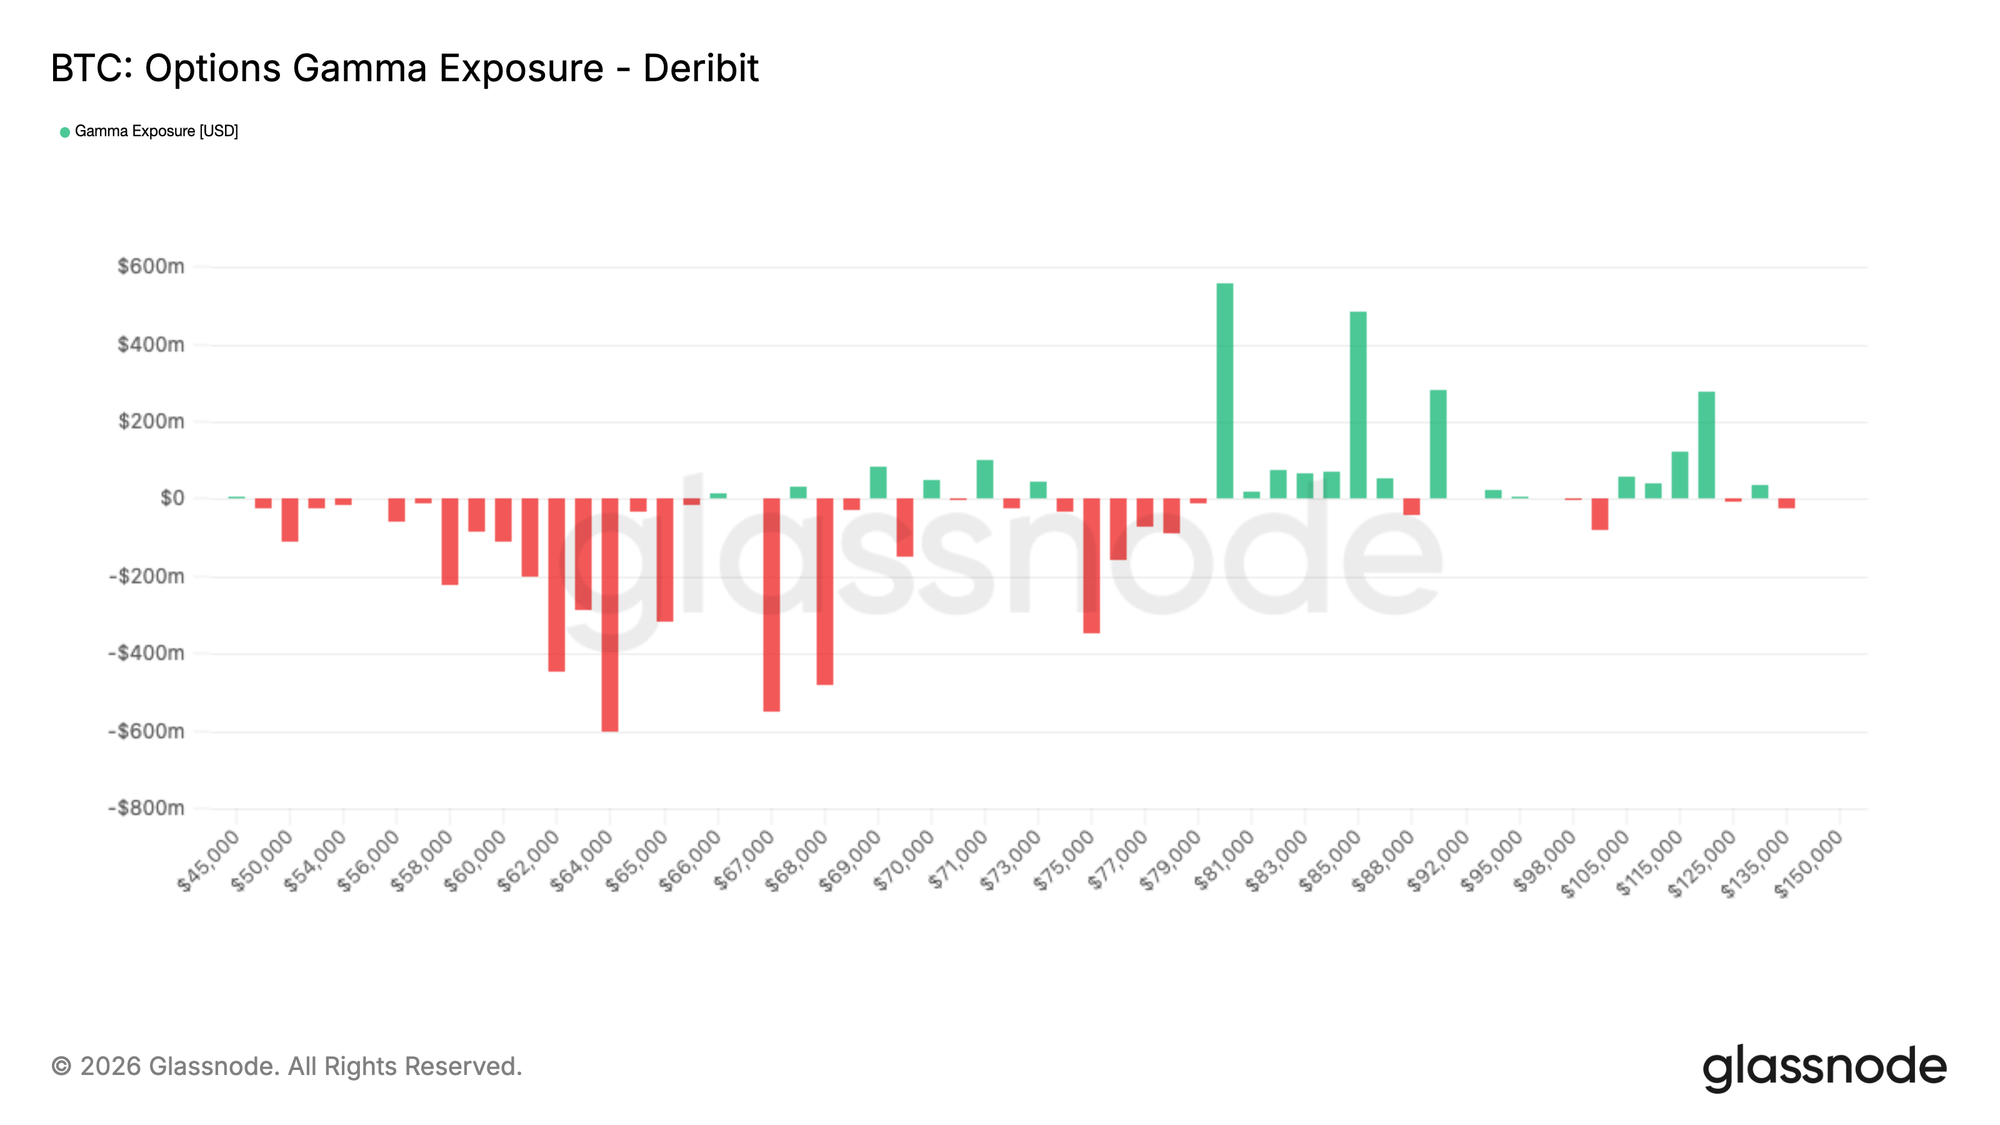
Short Gamma Rebuilds Below the Market
This more defensive positioning becomes more relevant when mapped against dealer gamma exposure. Negative gamma is now building just below current price levels, from $68K all the way down to the high 50s. Meaning, the market is getting long put just below the market and doesn’t expect this relief rallye to last long, forcing dealers to take the counterparty of that trade.
In this regime, dealers will have to sell into weakness, which would amplify volatility to the downside. With liquidity still thin following the March 27 expiry, the market structure appears fragile. A move into this zone could trigger accelerated selling as hedging flows reinforce downside momentum, turning what would otherwise be a gradual move into a sharper repricing, with a potential revisit of the $60k level, the bottom of the February 5 selloff.
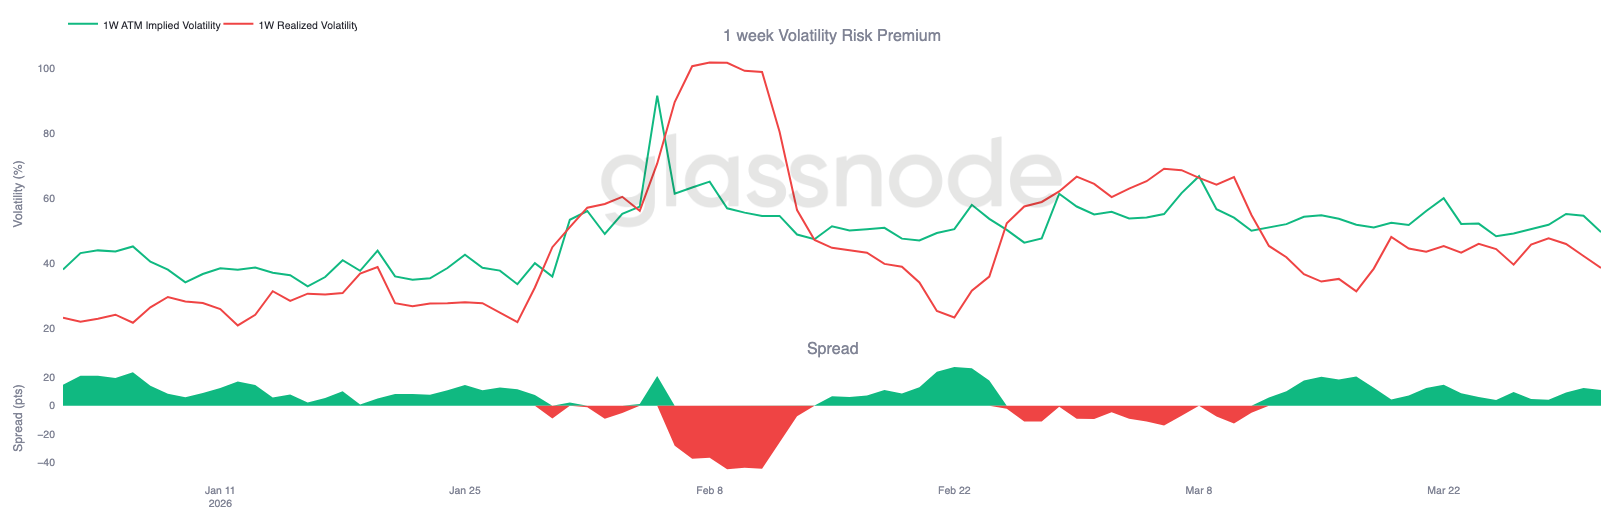
Calm Realized Vol Masks Fragility
What makes this setup more unstable is that implied volatility continues to trade above realized volatility. On the front end, 1 week realized volatility is at 38%, while 1 week implied volatility is at 49%, leaving a spread of 11 points. This gap has persisted for over three weeks, indicating that options remain consistently priced above actual market movement.
At first glance, this reflects a market that appears stable, with realized volatility staying contained. But the persistent premium shows that participants continue to price in risk, despite the lack of realized follow through, pointing to a low conviction environment.
In a context where volatility is priced above realized and gamma is negative, it takes relatively little selling pressure for moves to extend, as the market adjusts quickly from a compressed base with limited positioning to absorb flows.
Conclusion
Bitcoin remains locked in a broad $60k to $70k range, with the market showing early signs of stabilisation but not yet enough strength to break decisively in either direction. On-chain conditions still reflect ongoing repair, with supply in loss elevated and long-term holder capitulation not yet fully cooled. At the same time, spot demand is beginning to improve, suggesting sellers are no longer in full control.
Across off-chain markets, the picture is similarly balanced. Corporate treasury demand has narrowed meaningfully, perpetual leverage has reset, implied volatility has softened, and dealer positioning has become less destabilising. Together, these signals point to a market that is no longer in outright stress, but one that is still searching for stronger conviction.
For now, Bitcoin appears to be trading through a redistribution phase rather than a clear trend. Until spot demand expands more meaningfully and overhead supply begins to clear, the range remains the dominant feature of the market.
Disclaimer: This report does not provide any investment advice. All data is provided for informational and educational purposes only. No investment decision shall be based on the information provided here, and you are solely responsible for your own investment decisions.
Exchange balances presented are derived from Glassnode’s comprehensive database of address labels, which are amassed through both officially published exchange information and proprietary clustering algorithms. While we strive to ensure the utmost accuracy in representing exchange balances, it is important to note that these figures might not always encapsulate the entirety of an exchange’s reserves, particularly when exchanges refrain from disclosing their official addresses. We urge users to exercise caution and discretion when utilizing these metrics. Glassnode shall not be held responsible for any discrepancies or potential inaccuracies.