Bouncing in a Bear
Bitcoin bounced from $67k to $72k, but weak spot demand and softer futures activity suggest the recovery still lacks strong conviction, even as ETF flows begin to turn modestly positive.


Executive Summary
- Bitcoin remains within a subdued and low-conviction market environment, with weak spot activity and thinner derivatives participation continuing to limit upside follow-through.
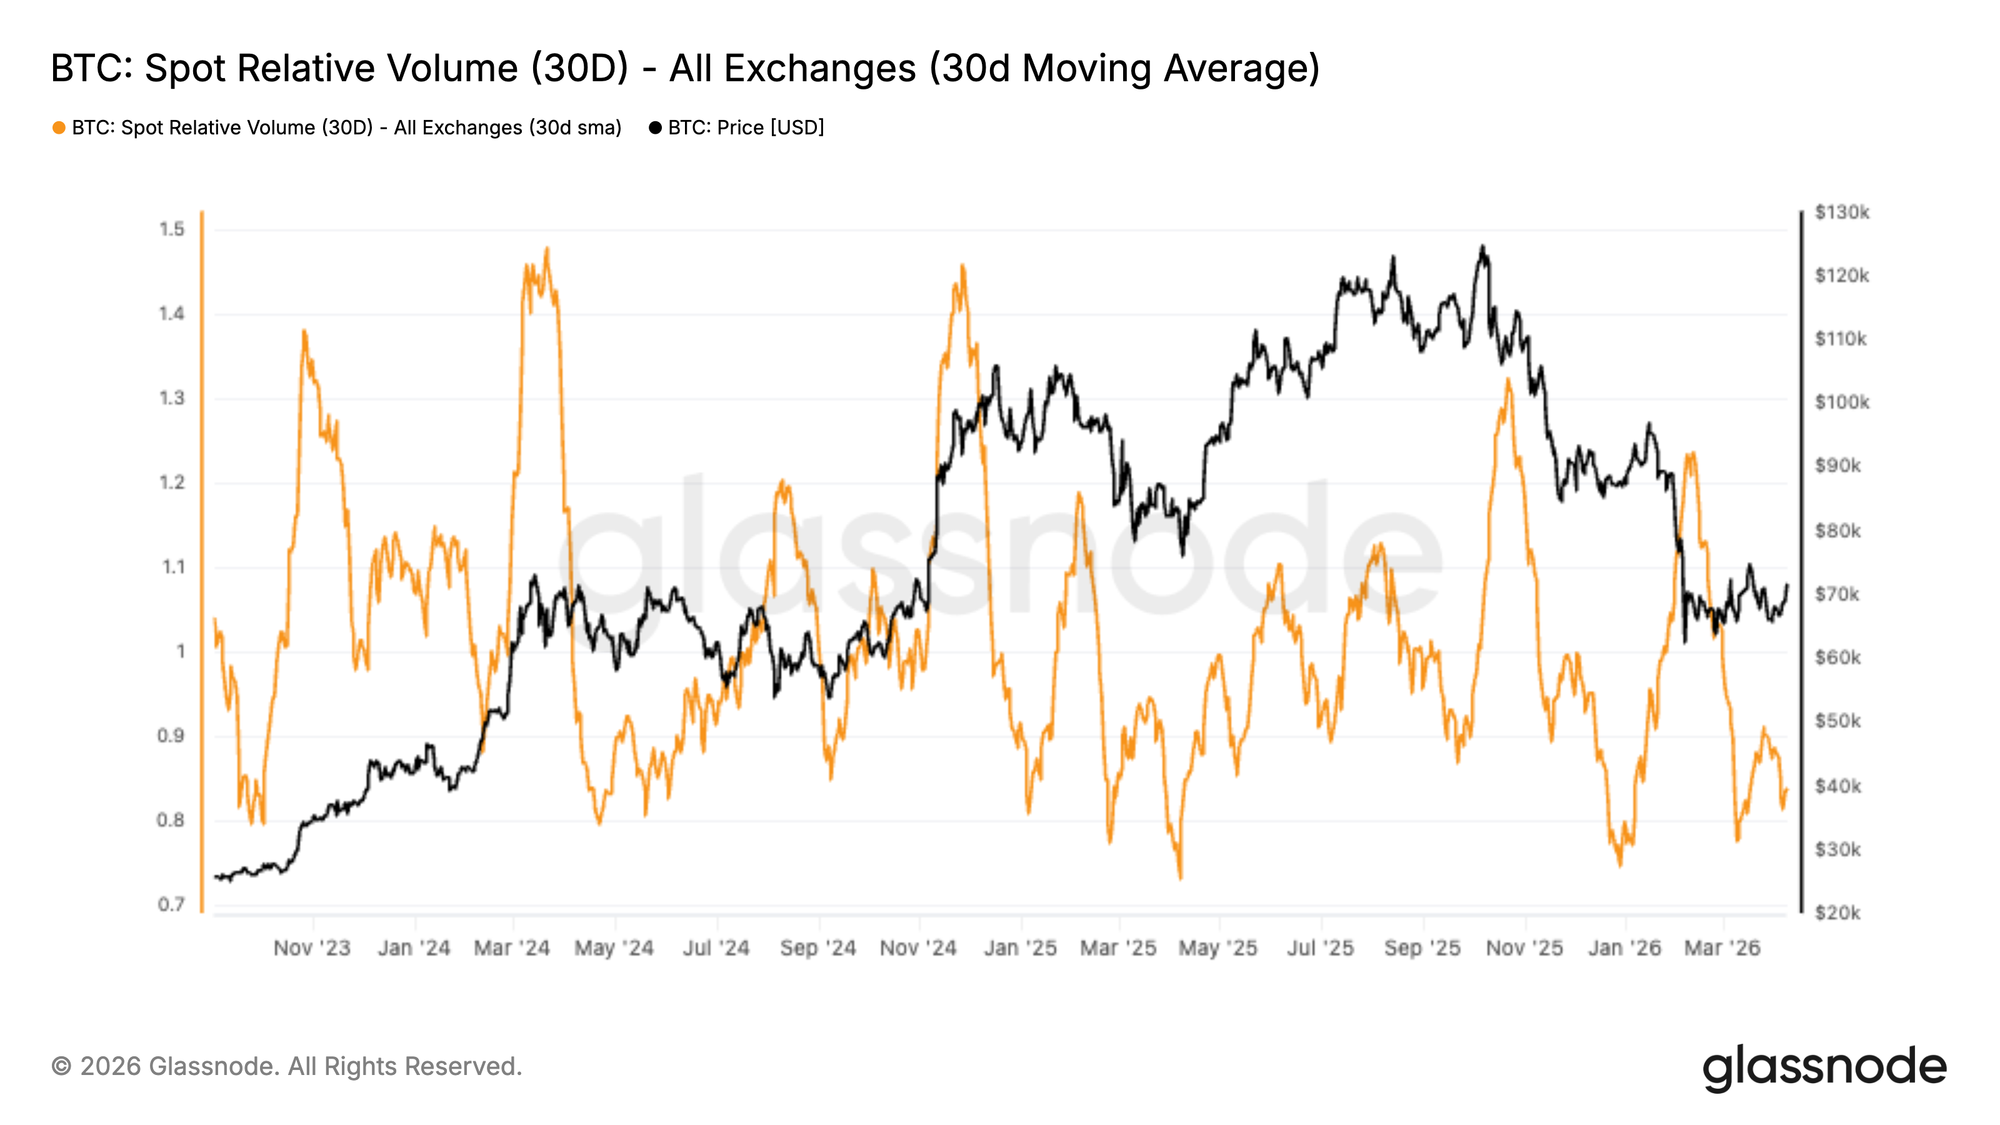
- Spot volume remains soft, with Binance’s 30-day relative volume still sitting below the 1.0 baseline, highlighting a lack of strong organic demand beneath the recent stabilization in price.
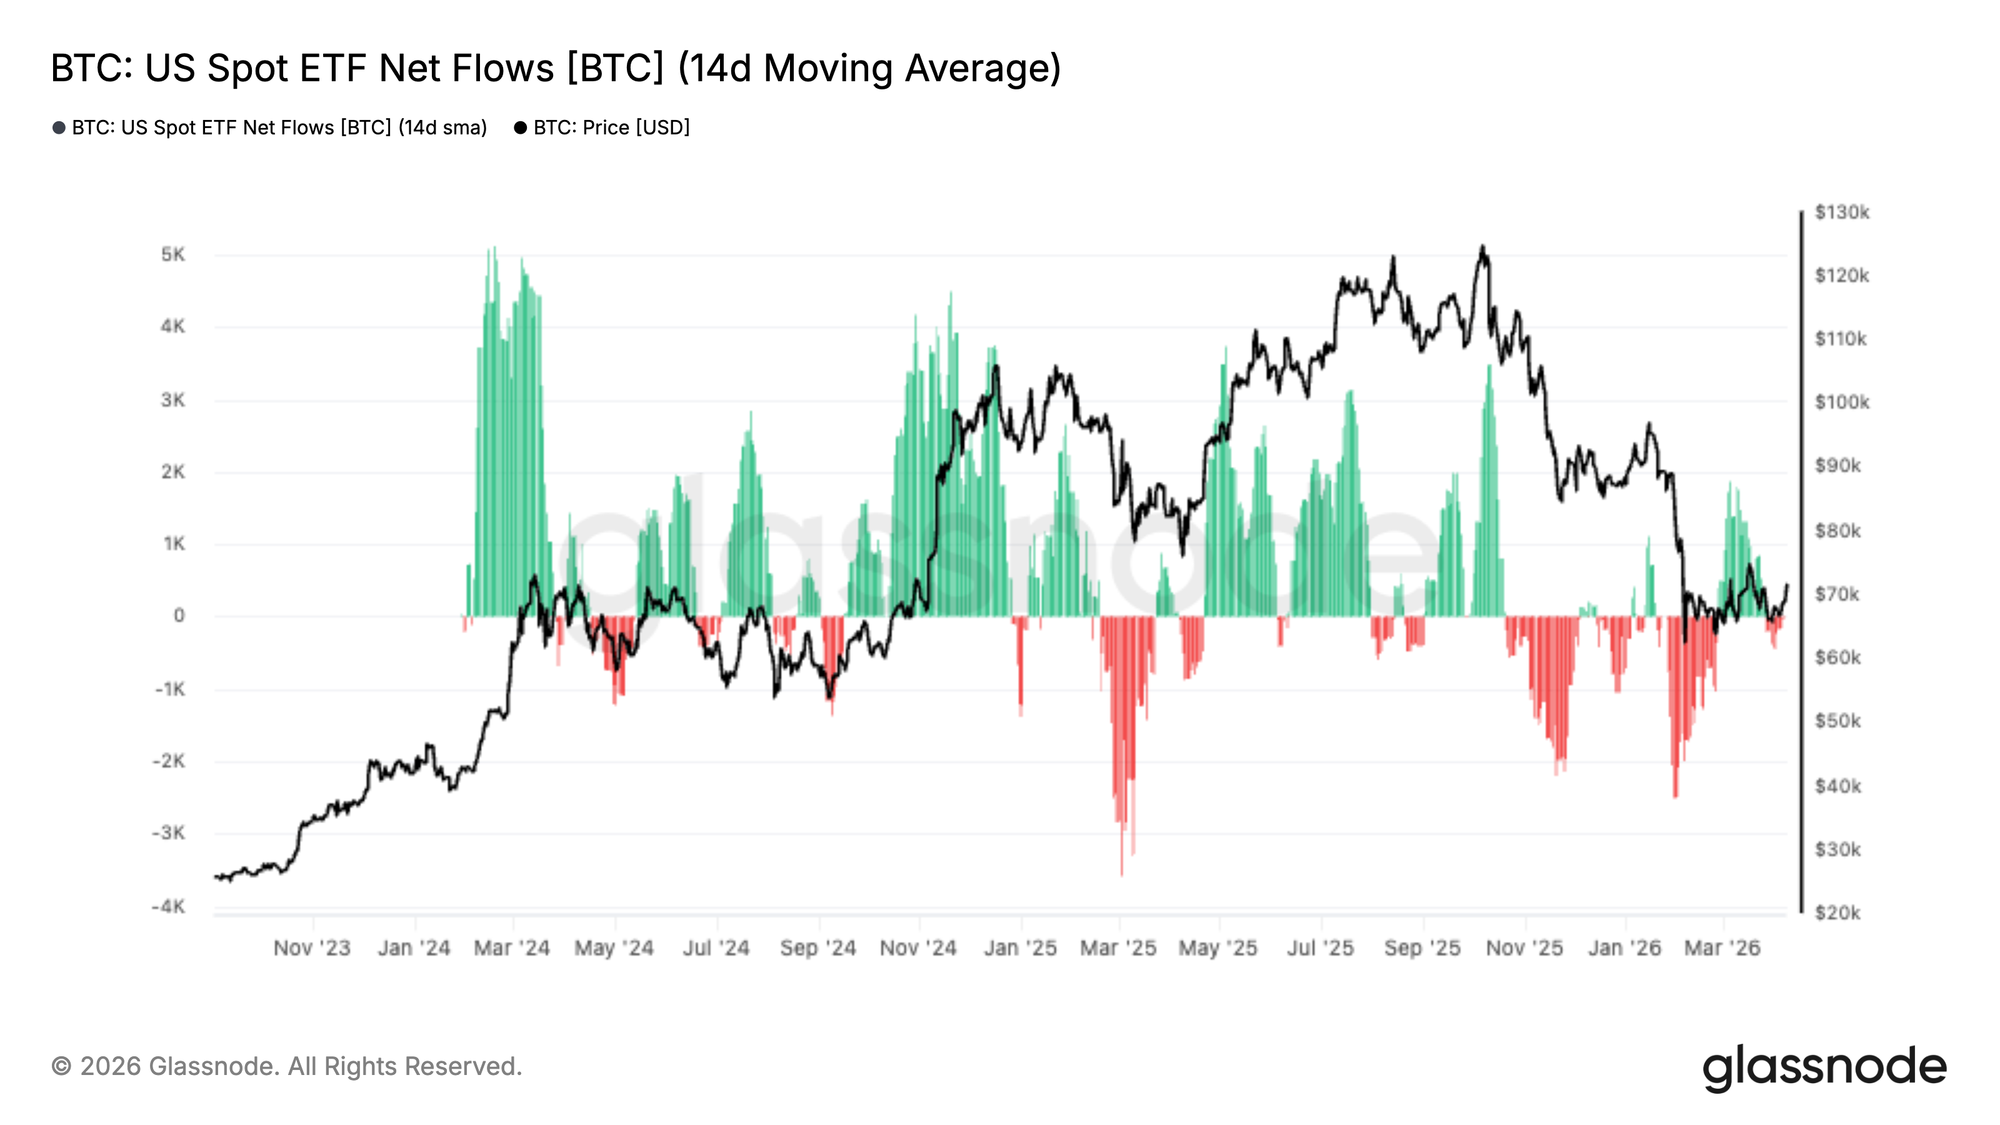
- US Spot ETF flows have started to improve, with the 14-day average flipping back into modest net inflows after an extended period of outflows, suggesting early signs of institutional demand returning around current levels.
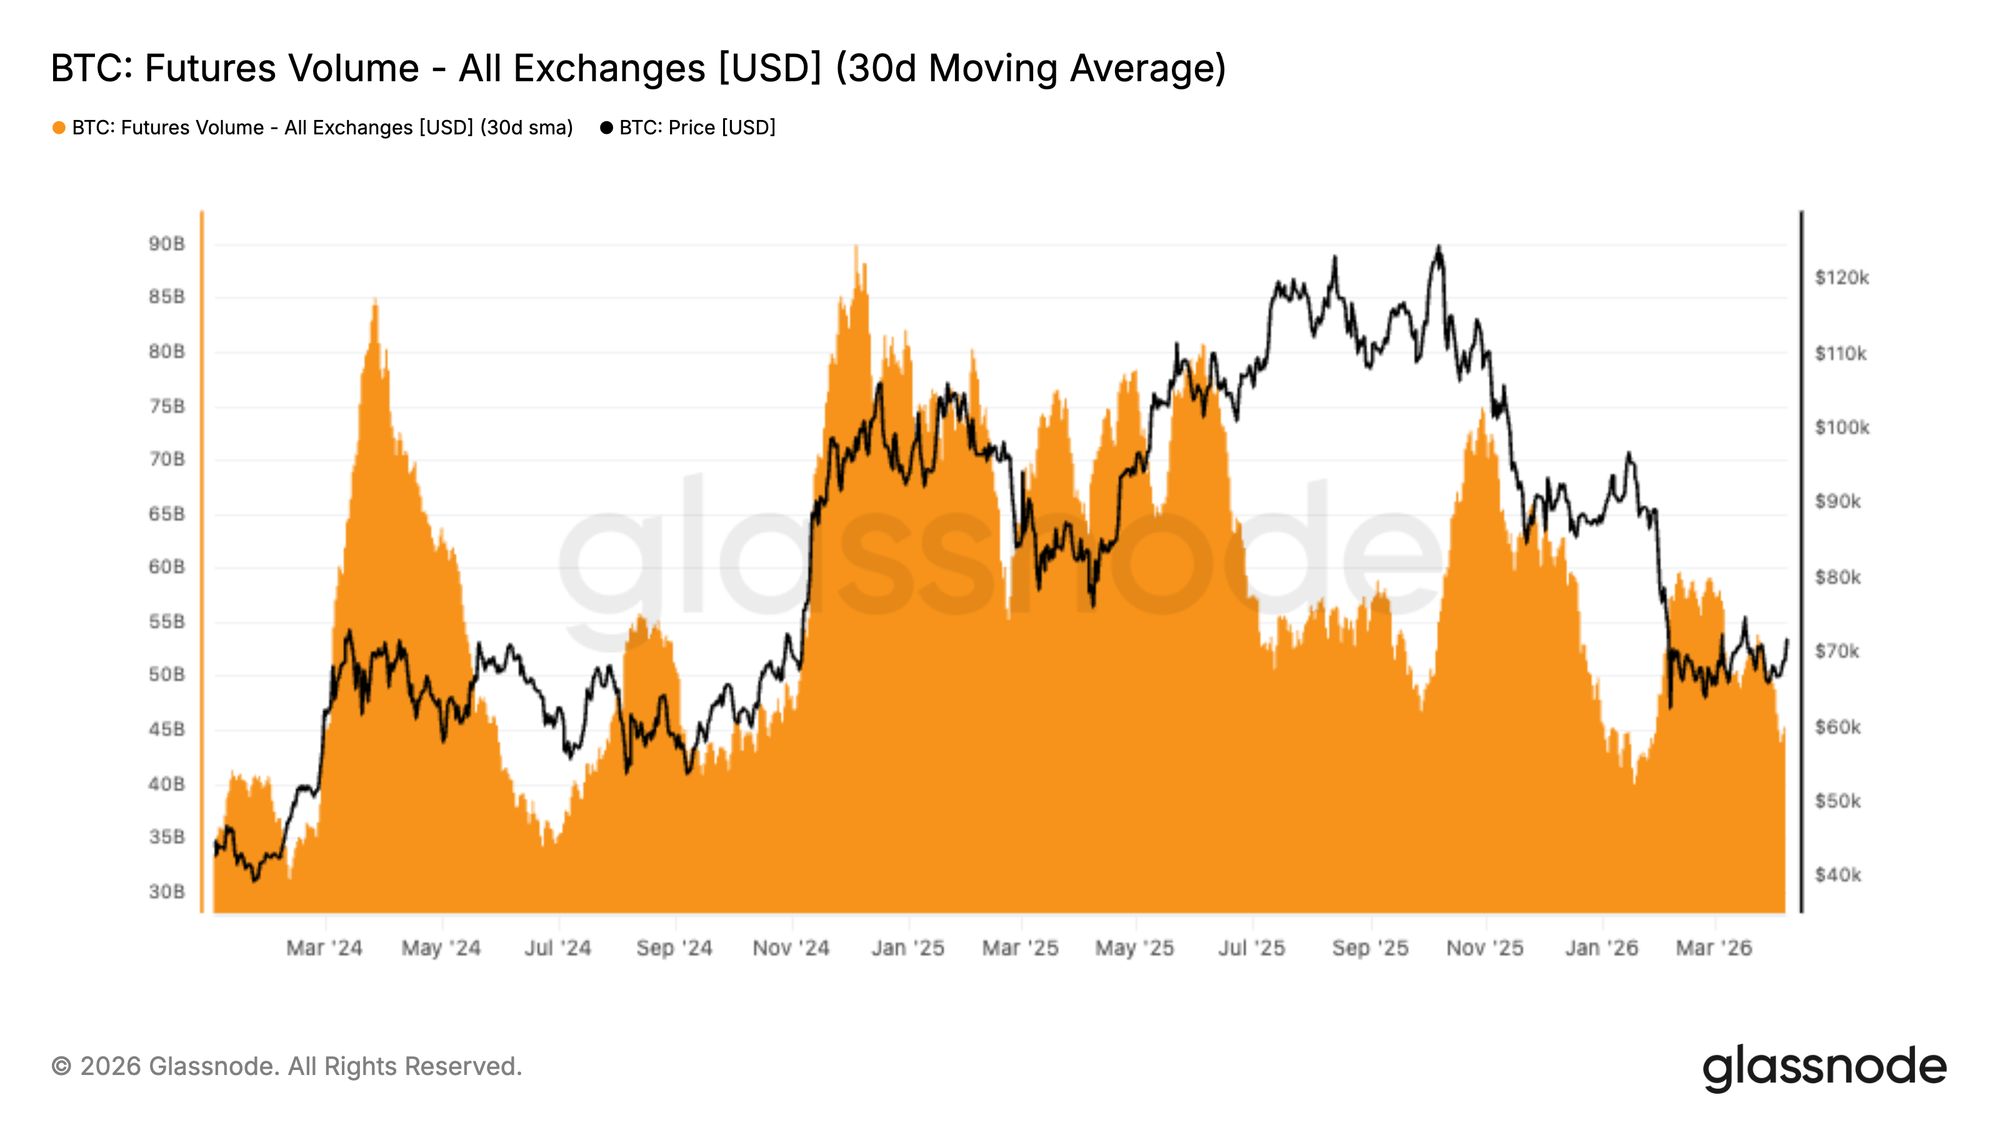
- Futures volume has contracted sharply, with the 30-day average rolling over and trending lower, reinforcing the view that traders are stepping back rather than aggressively re-engaging after the recent deleveraging event.
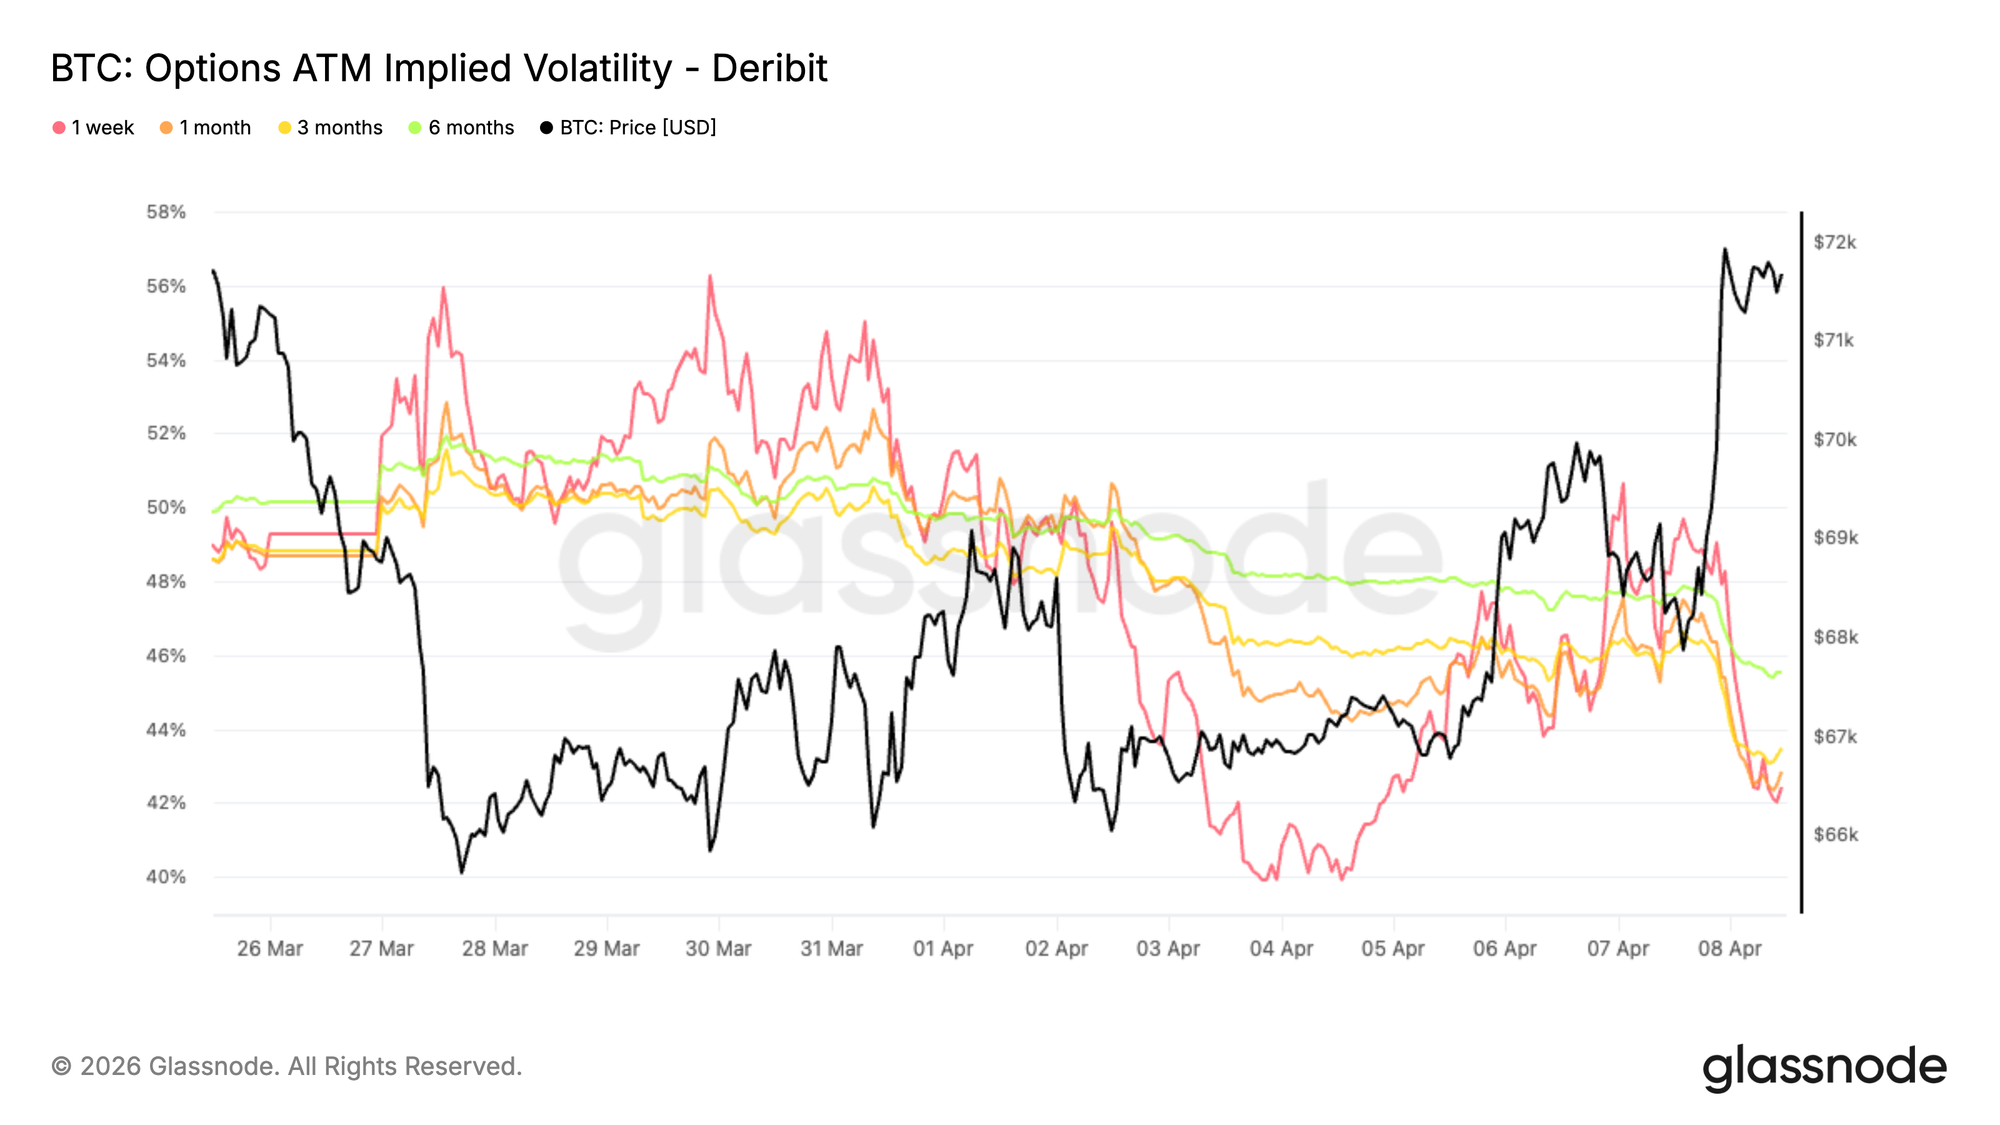
- Starting with implied volatility, option pricing has moved lower across the curve, with short-dated volatility back toward the low 40s and the 6-month tenor around 45%, reflecting a broad repricing of expected movement.
- The announcement of a ceasefire in the Iranian conflict further dampened volatility, accelerating the compression already underway and pointing to a quieter near-term environment with limited conviction and fewer participants willing to pay for protection or convex exposure.
- Despite the broader easing in volatility, relative option pricing continues to reflect a defensive bias, with skew remaining tilted toward puts and downside protection still trading at a premium to upside exposure.
- Shifting from pricing to actual market behavior, Bitcoin’s 30 day realized volatility has declined to 42.5%, reflecting a calmer market regime, but one that also comes with reduced participation and thinner trading volumes.
- With implied volatility also moving lower, the 1 month volatility risk premium is now close to zero, a structure that suggests options are becoming more fairly priced and potentially more attractive for volatility buyers.
- Turning to dealer positioning, the gamma profile has shifted meaningfully compared to last week, with a pocket of long gamma developing between 69K and 71.5K that may help contain downside in the near term, while short gamma remains positioned overhead beyond 80K.
This report is also freely available for download in PDF format.
On-Chain Insights
After weeks of heightened uncertainty across energy, equity, and Bitcoin markets driven by ongoing geopolitical tensions, early signs of de-escalation are beginning to create room for a potential relief rally above $70k.
Against this backdrop, this report zooms out from near-term price noise to examine the most immediate on-chain resistance and support levels shaping the mid to longer-term outlook, alongside a broader assessment of investor behaviour and sentiment.
Still Inside the Bear Market Value Zone
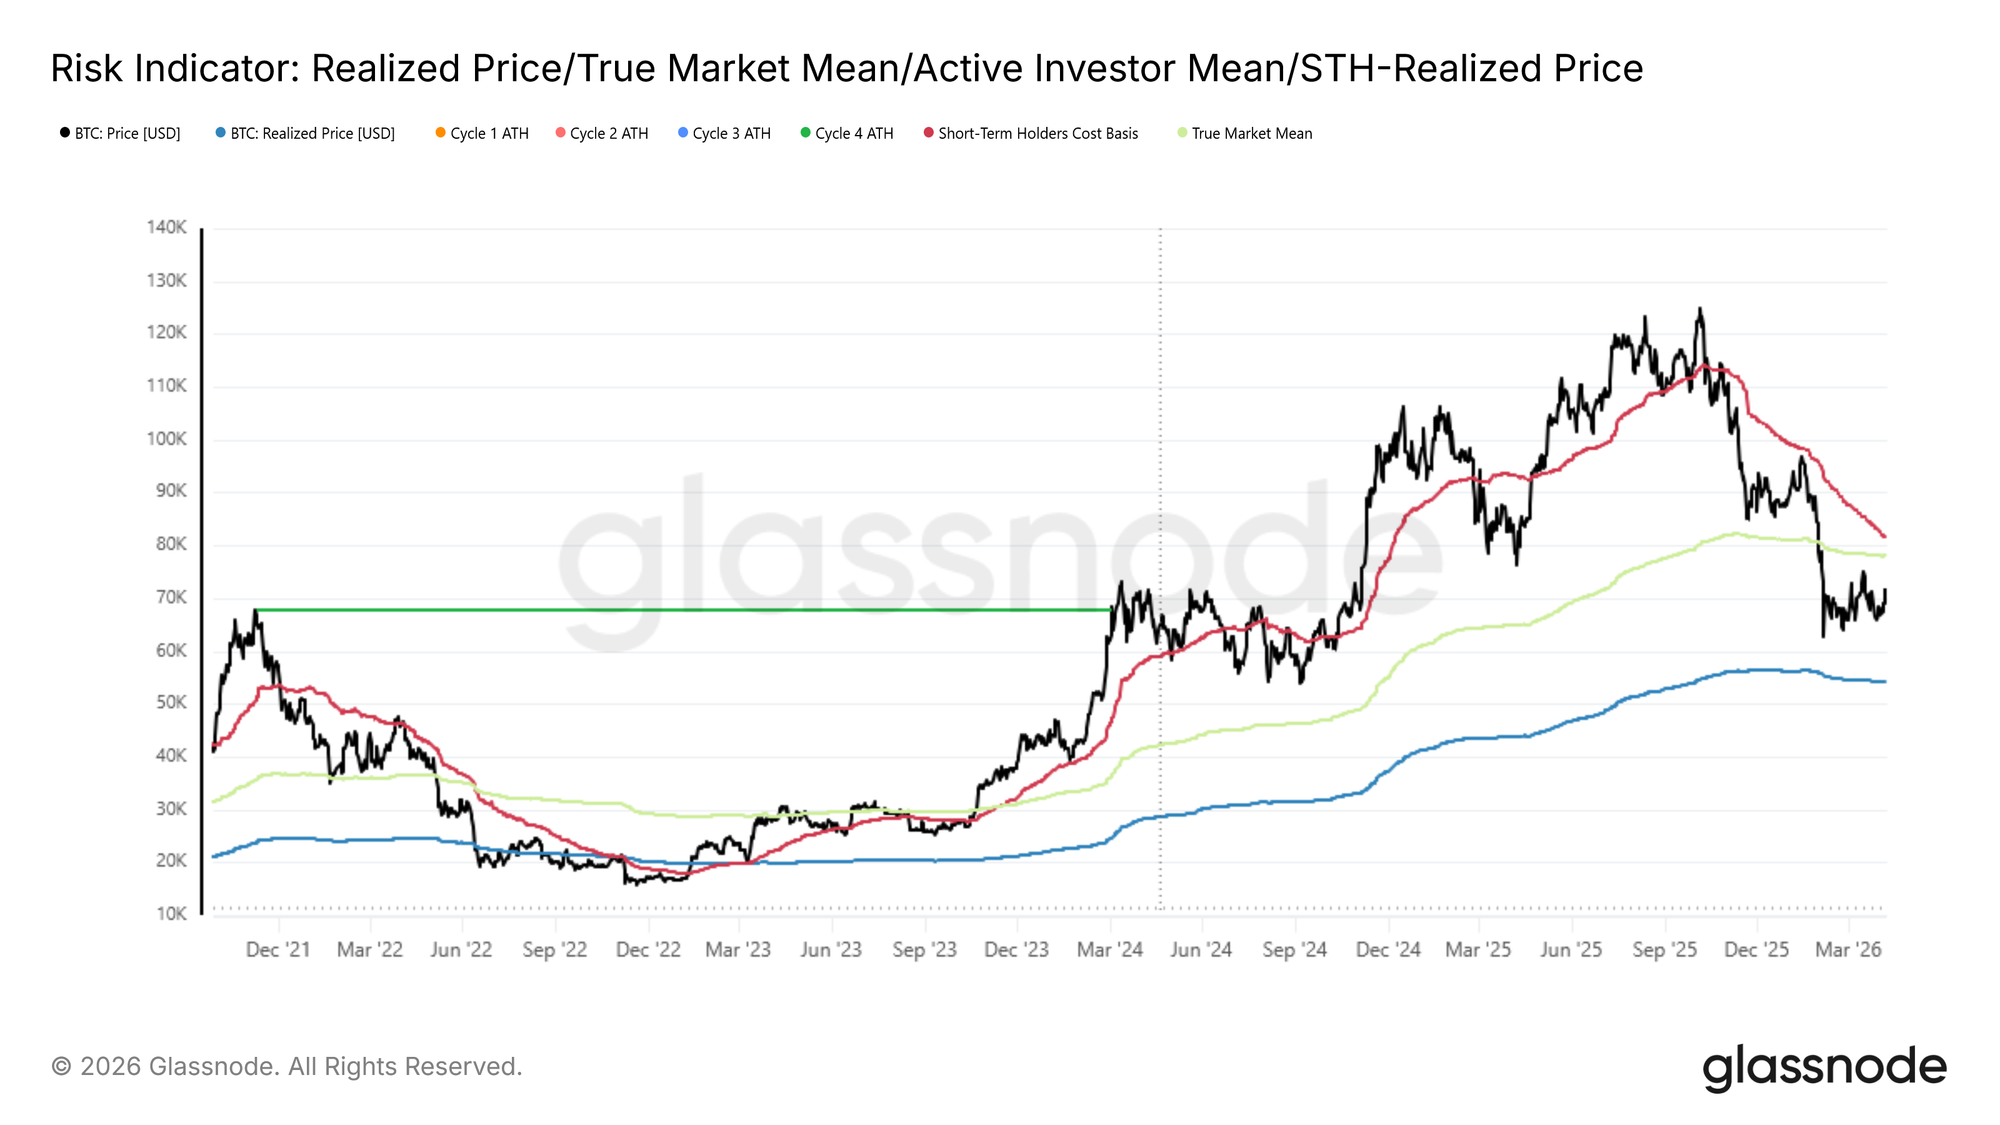
Building on the macro context outlined above, a comparison of spot price against key on-chain pricing models reveals that the market remains structurally within bear market territory. The Realized Price at $54k, representing the average acquisition cost of all circulating supply, and the True Market Mean at $78k, which narrows this calculation to only actively transacted coins, together define the boundaries of the current bear market value zone.
Price trading within this band is historically consistent with a market that has not yet transitioned into a sustainable recovery regime. Compounding this, spot remains below the Short-Term Holder Cost Basis at $81.6k, the level at which recent buyers collectively break even. This is a particularly meaningful threshold. Until price reclaims this level, the mid to long-term bias remains tilted to the downside, as any rally into this zone is likely to encounter meaningful distribution pressure from recent buyers seeking to exit at or near breakeven.
Calibrating Bear Market Depth with AVIV
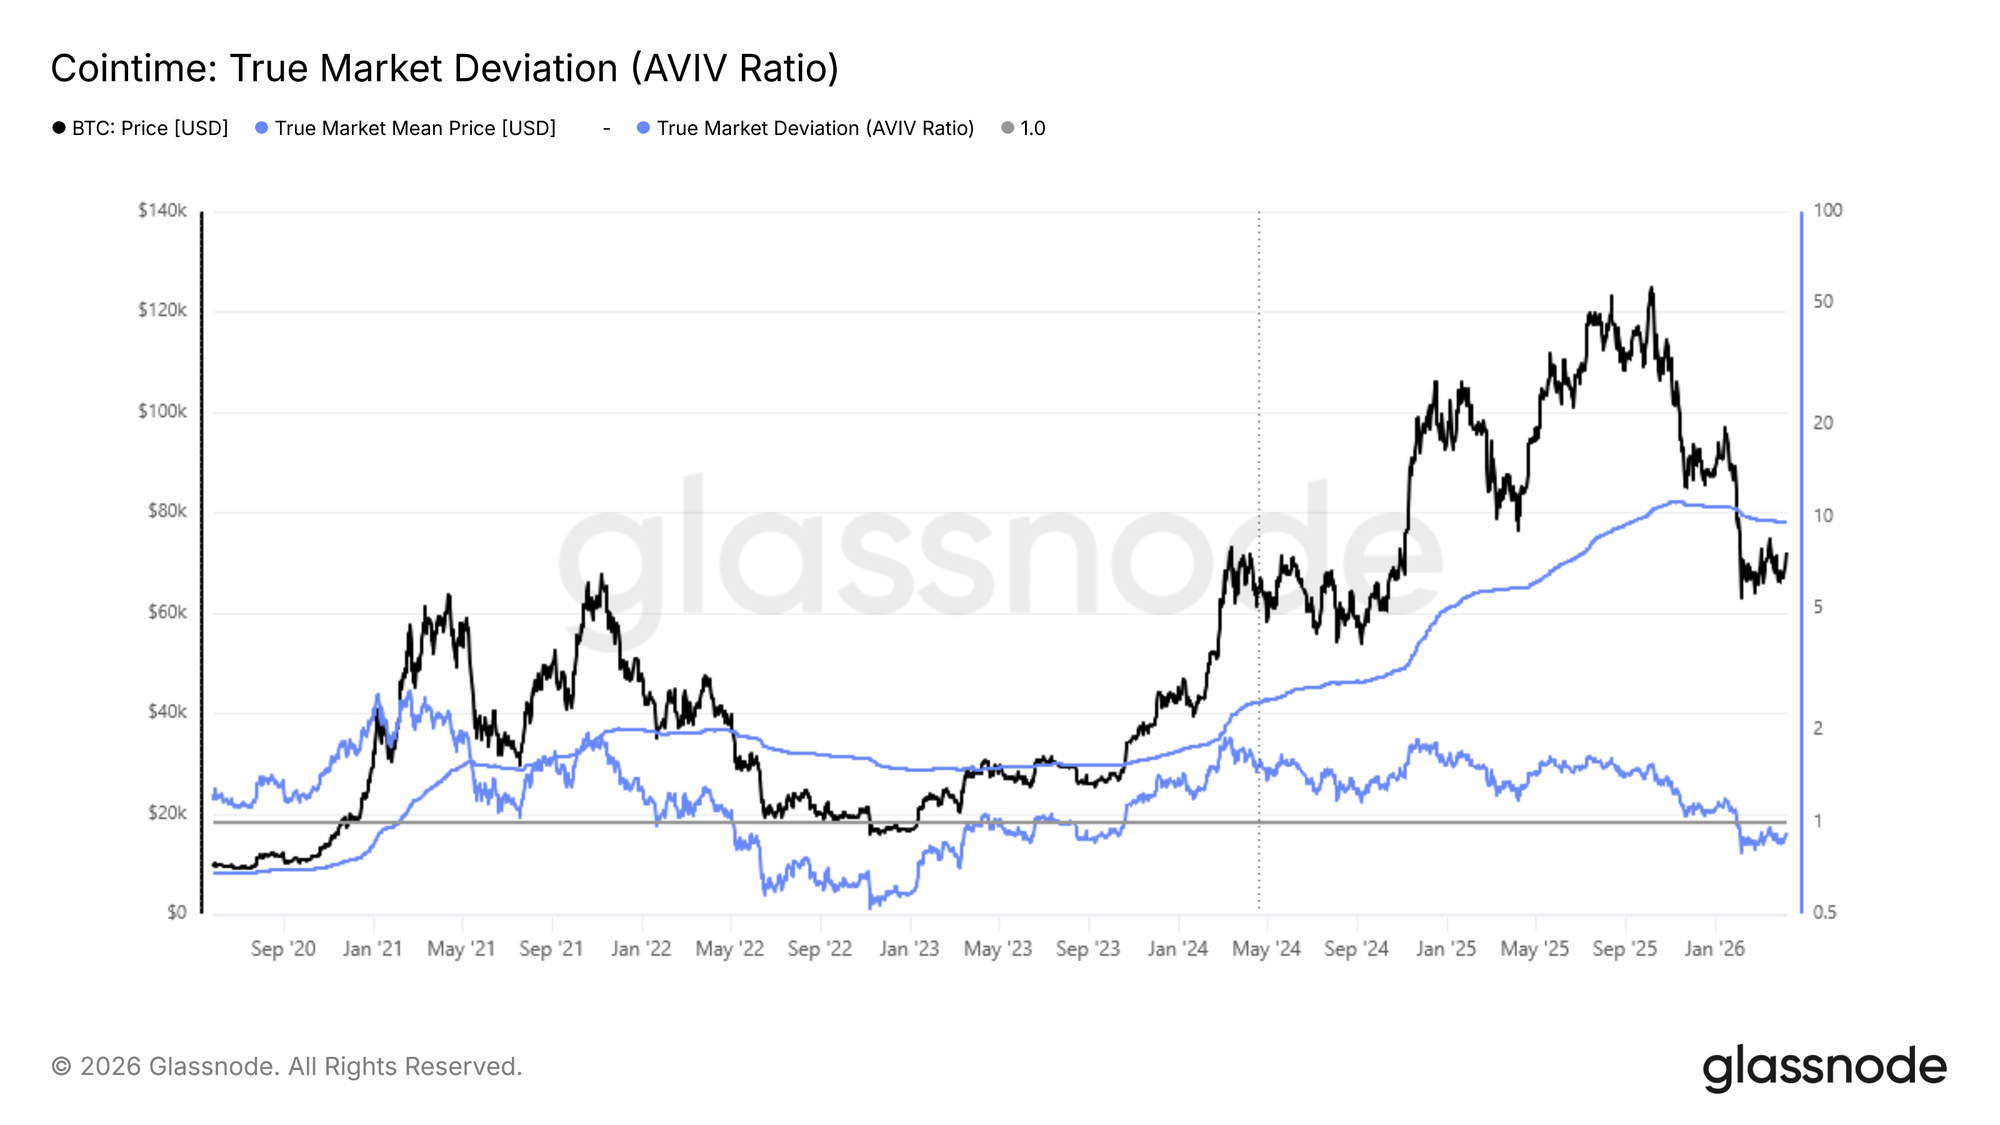
With the True Market Mean at $78k serving as the probable mid-term ceiling for any relief rally, the AVIV Ratio provides a precise quantitative lens for contextualizing the current market state relative to prior bear market cycles. Defined as the ratio of spot price to the True Market Mean, this indicator measures how far the market is trading above or below the active investor cost basis, serving as a valuation barometer across cycle phases.
Currently at 0.92, and trading below 1 since early February, the AVIV Ratio places the present environment in close proximity to the May-June 2022 market state. This confirms we are operating within a bear market regime, though meaningfully above the extreme depressed readings observed during Q3-Q4 of 2022. This comparison is not a forecast of further deterioration, but rather a framework for calibrating the potential depth and duration of the current bear phase against analogous historical precedents, where recovery timelines varied considerably.
Capitulation Progress Holds the Key
Synthesizing the structural picture outlined above, Bitcoin remains rangebound within a conventional bear market, with a short-term bounce toward the True Market Mean at $78k plausible but not yet supported by a meaningful shift in underlying momentum.
Two conditions in particular must be met before a sustainable recovery can be considered probable:
- A stabilization in the Short-Term Holder Cost Basis, which continues to trend lower
- A meaningful reduction in realized loss pressure from investors who acquired supply near cycle highs.
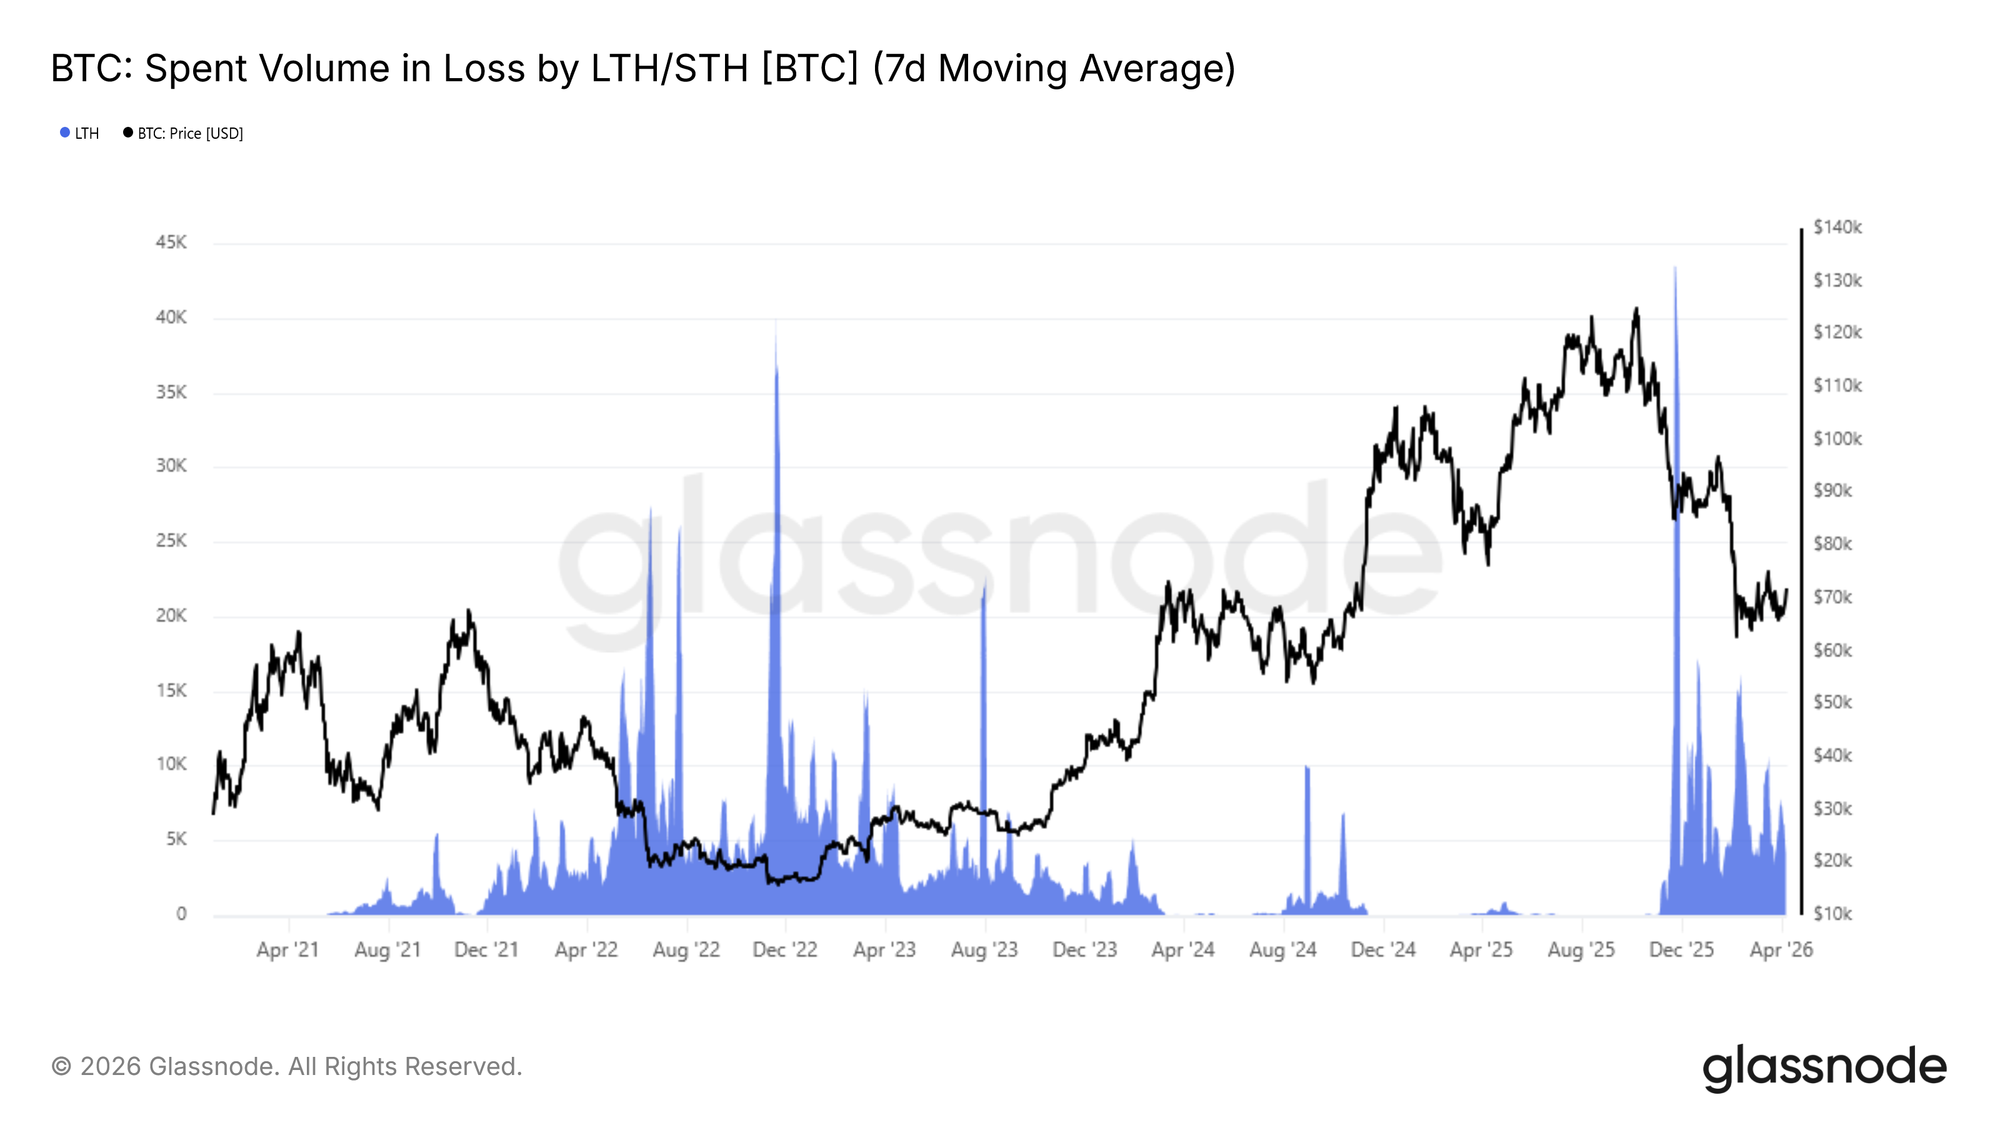
The latter can be monitored via the 7-day SMA of Long-Term Holder Realized Loss Volume, which has remained above 4k BTC per day since November 2025, reflecting persistent capitulation from top buyers still working through their underwater positions. A sustained cooldown in this metric toward<1k BTC per day, combined with a price reclaim of the Short-Term Holder Cost Basis ($81.6k), would together constitute the most credible on-chain confirmation that the current bear phase is transitioning toward a pre-bull recovery structure.
Off-Chain Insights
Weak Spot Flow Persists
Spot activity remains soft, with Binance’s 30-day relative volume sitting below the 1.0 baseline and hovering toward the lower end of its range. Recent data shows only a mild uptick, but nothing that suggests a meaningful return of participation.
Price has managed to stabilise, but it’s doing so without strong spot backing. That points to a market still driven by derivatives and short-term positioning rather than sustained buying interest.
Until spot demand picks up, rallies are likely to feel fragile, with limited follow-through. A clear expansion in volume would signal stronger conviction and a healthier foundation for continuation.
ETF Flows Turn Tentatively Positive
US spot ETF flows are starting to improve, with the 14-day average flipping back into modest net inflows after an extended period of outflows. The shift is still small in magnitude, but directionally important.
The prior stretch of consistent selling highlights a clear phase of distribution. That pressure now appears to be easing, with early signs of demand stepping back in around current levels.
If inflows continue to build, it would provide a stronger bid underneath the market. For now, this looks more like early stabilisation than a full return of institutional demand.
Futures Volume Contracts Sharply
Futures trading activity has declined materially, with the 30-day average rolling over and trending lower following the recent price drawdown. Volume has compressed back toward the lower end of its range, reflecting a clear drop in participation across derivatives markets.
This slowdown comes alongside the open interest washout, reinforcing the idea that leverage is not only being unwound, but that traders are stepping back rather than immediately re-engaging. The absence of strong volume on the recent bounce suggests limited conviction behind the move.
For now, derivatives activity remains subdued, pointing to a quieter and less aggressive market environment. A pickup in futures volume would be an early signal that traders are returning and that momentum may begin to rebuild.
Implied Volatility Compresses Across Maturities
Starting with implied volatility, option pricing has moved lower across the curve. Short-dated volatility has softened noticeably and is now back toward the low 40s, while longer tenors have also edged down, with the 6-month around 45%, reflecting a broad repricing of expected movement.
The announcement of a ceasefire in the Iranian conflict further dampened volatility, accelerating the compression already underway. This shift suggests that the market is pricing a quieter near-term environment, with signs of de-escalation but limited conviction, and fewer participants willing to pay for protection or convex exposure.
It points to a low-conviction backdrop where traders are not aggressively positioning for upcoming catalysts. At the same time, this repricing makes options more accessible, which can support positioning ahead of known events. The key dynamic to watch is whether this compression leads to renewed activity or simply extends the current low-engagement regime.
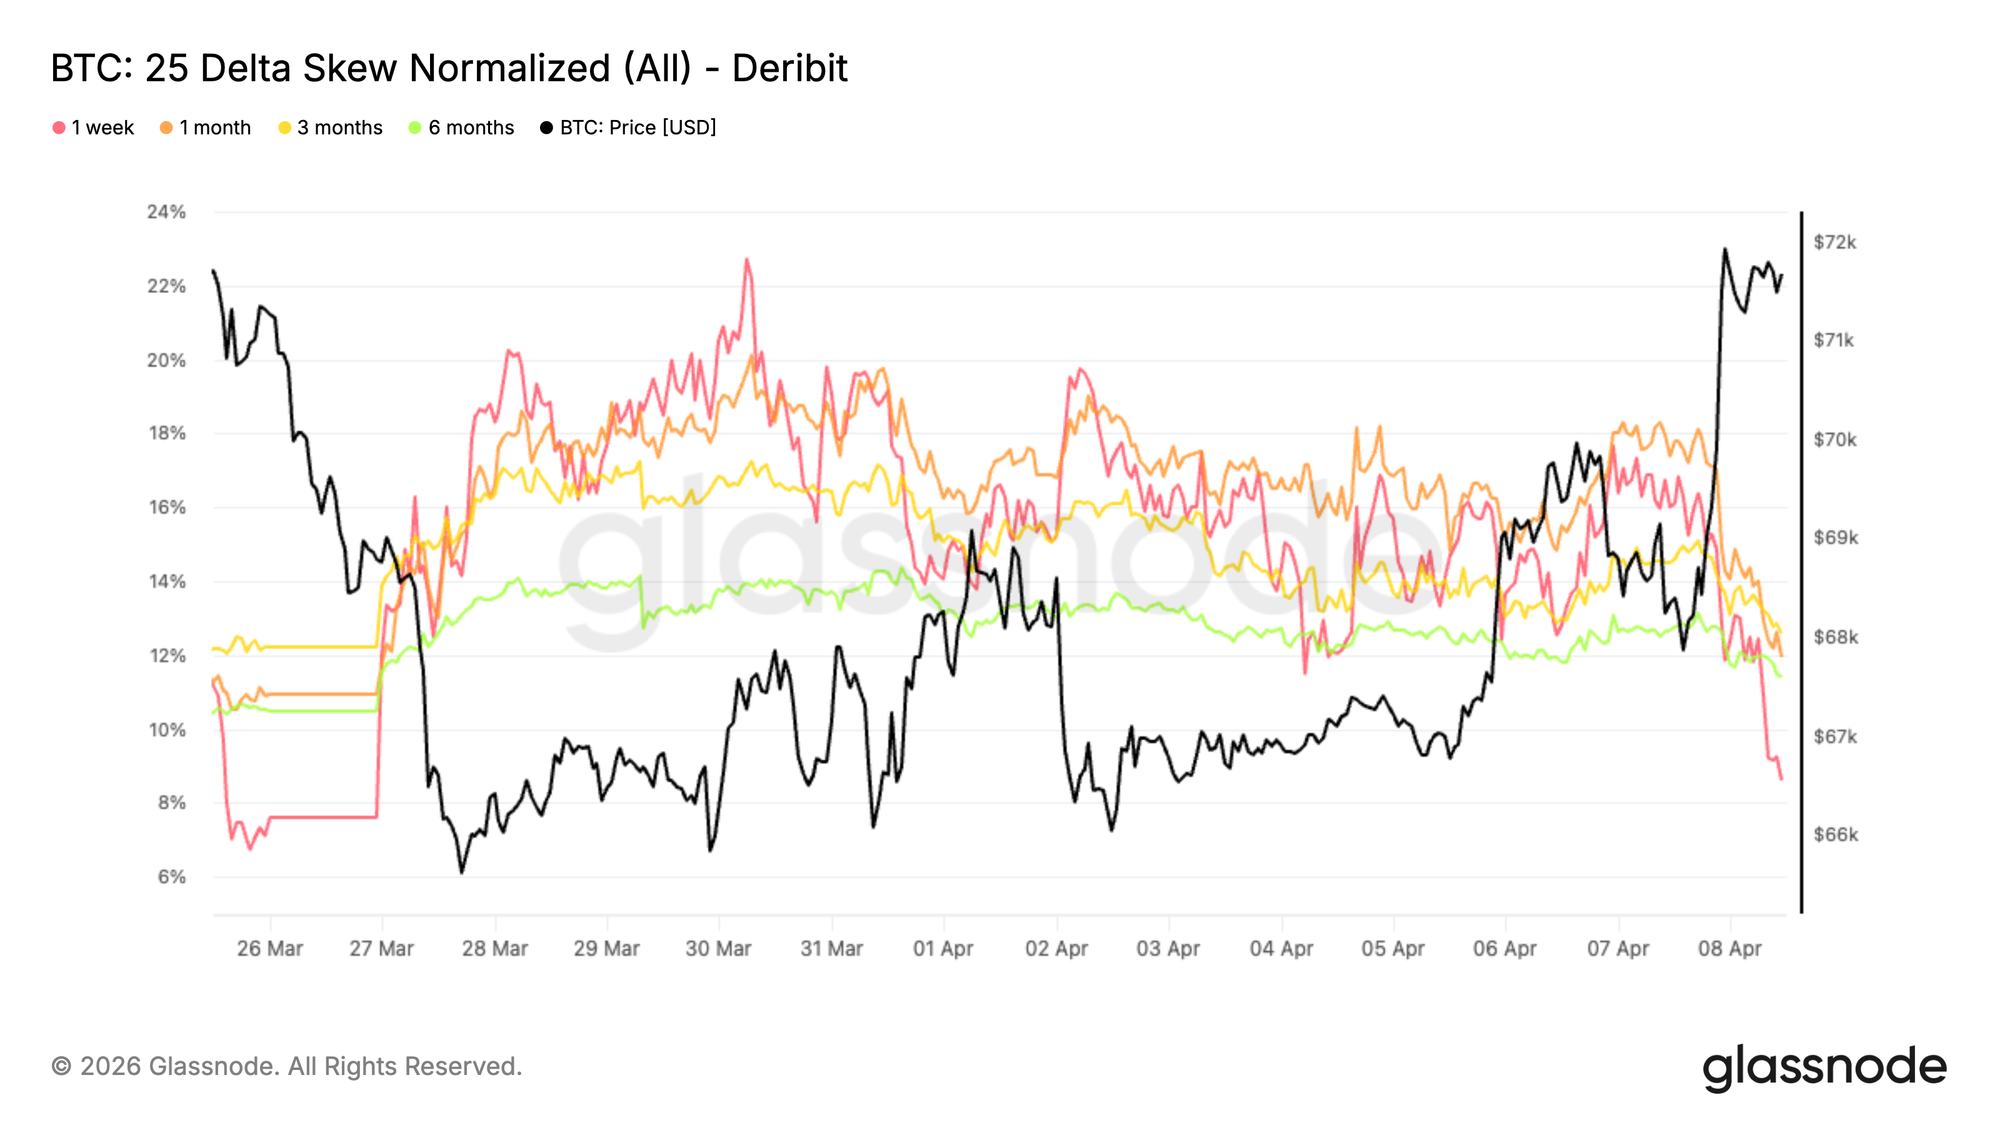
25 Delta Skew Signals Persistent Caution
Despite the broader easing in volatility, relative option pricing continues to reflect a defensive bias. While skew has moderated slightly following the ceasefire announcement, moving from the high teens toward the low teens on the put side, the adjustment appears more like a headline-driven squeeze than a structural shift in call versus put demand.
It remains tilted toward puts, meaning downside protection still trades at a premium to upside exposure. This indicates that participants are comfortable reducing overall volatility exposure, but are not willing to give up protection against adverse moves.
The combination of softer volatility and persistent demand for puts points to a market that is not positioning for strong upside, but remains cautious around downside risks, with traders still prioritizing protection.
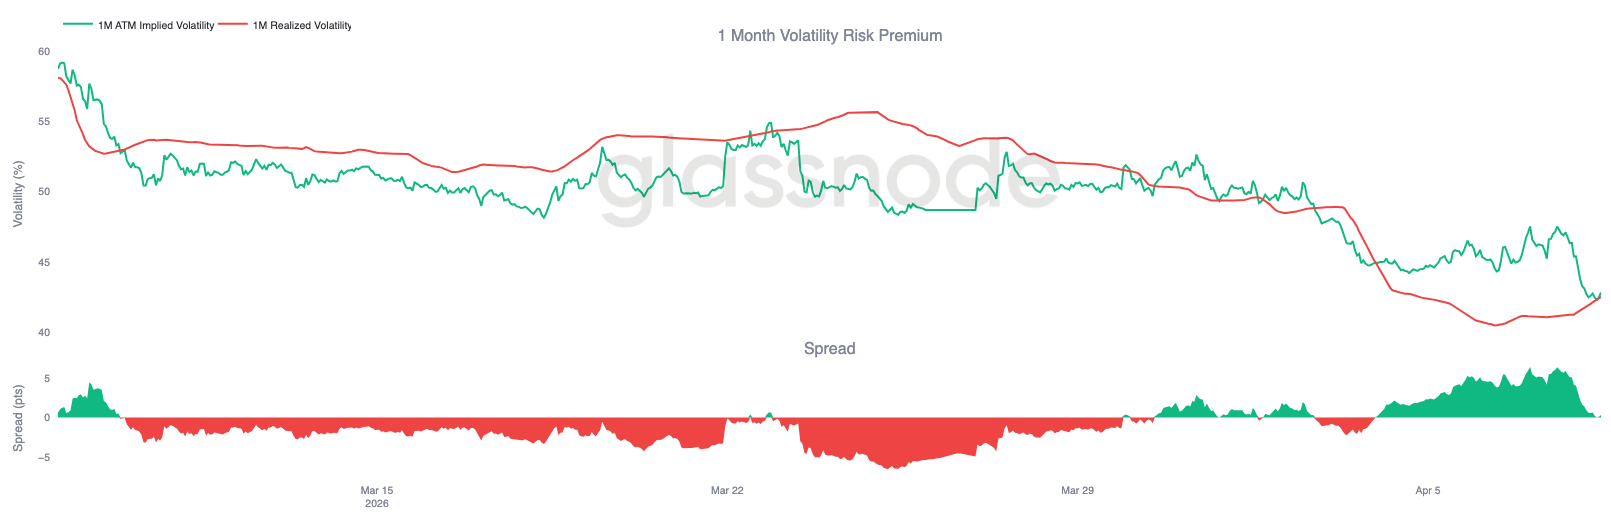
Realized Volatility Keeps Sliding
Shifting from pricing to actual market behavior, price fluctuations continue to ease, with Bitcoin’s 30 day realized volatility now sitting at 42.5%, well below its recent average. This reflects a market that has quieted down after earlier turbulence, with less leverage and fewer aggressive moves.
However, this calm comes with reduced participation, as trading volumes have also thinned out. In such conditions, price becomes more sensitive to incremental flows, meaning relatively small trades can move the market without establishing a clear trend, where liquidity is limited and price action is increasingly driven by short-term flows rather than sustained direction.
Rather than signaling strength, this environment points to a lack of engagement, with a market that reacts more than it leads. With implied volatility also moving lower, the 1 month volatility risk premium is now close to zero, a structure that has historically offered attractive entry points for volatility buyers.
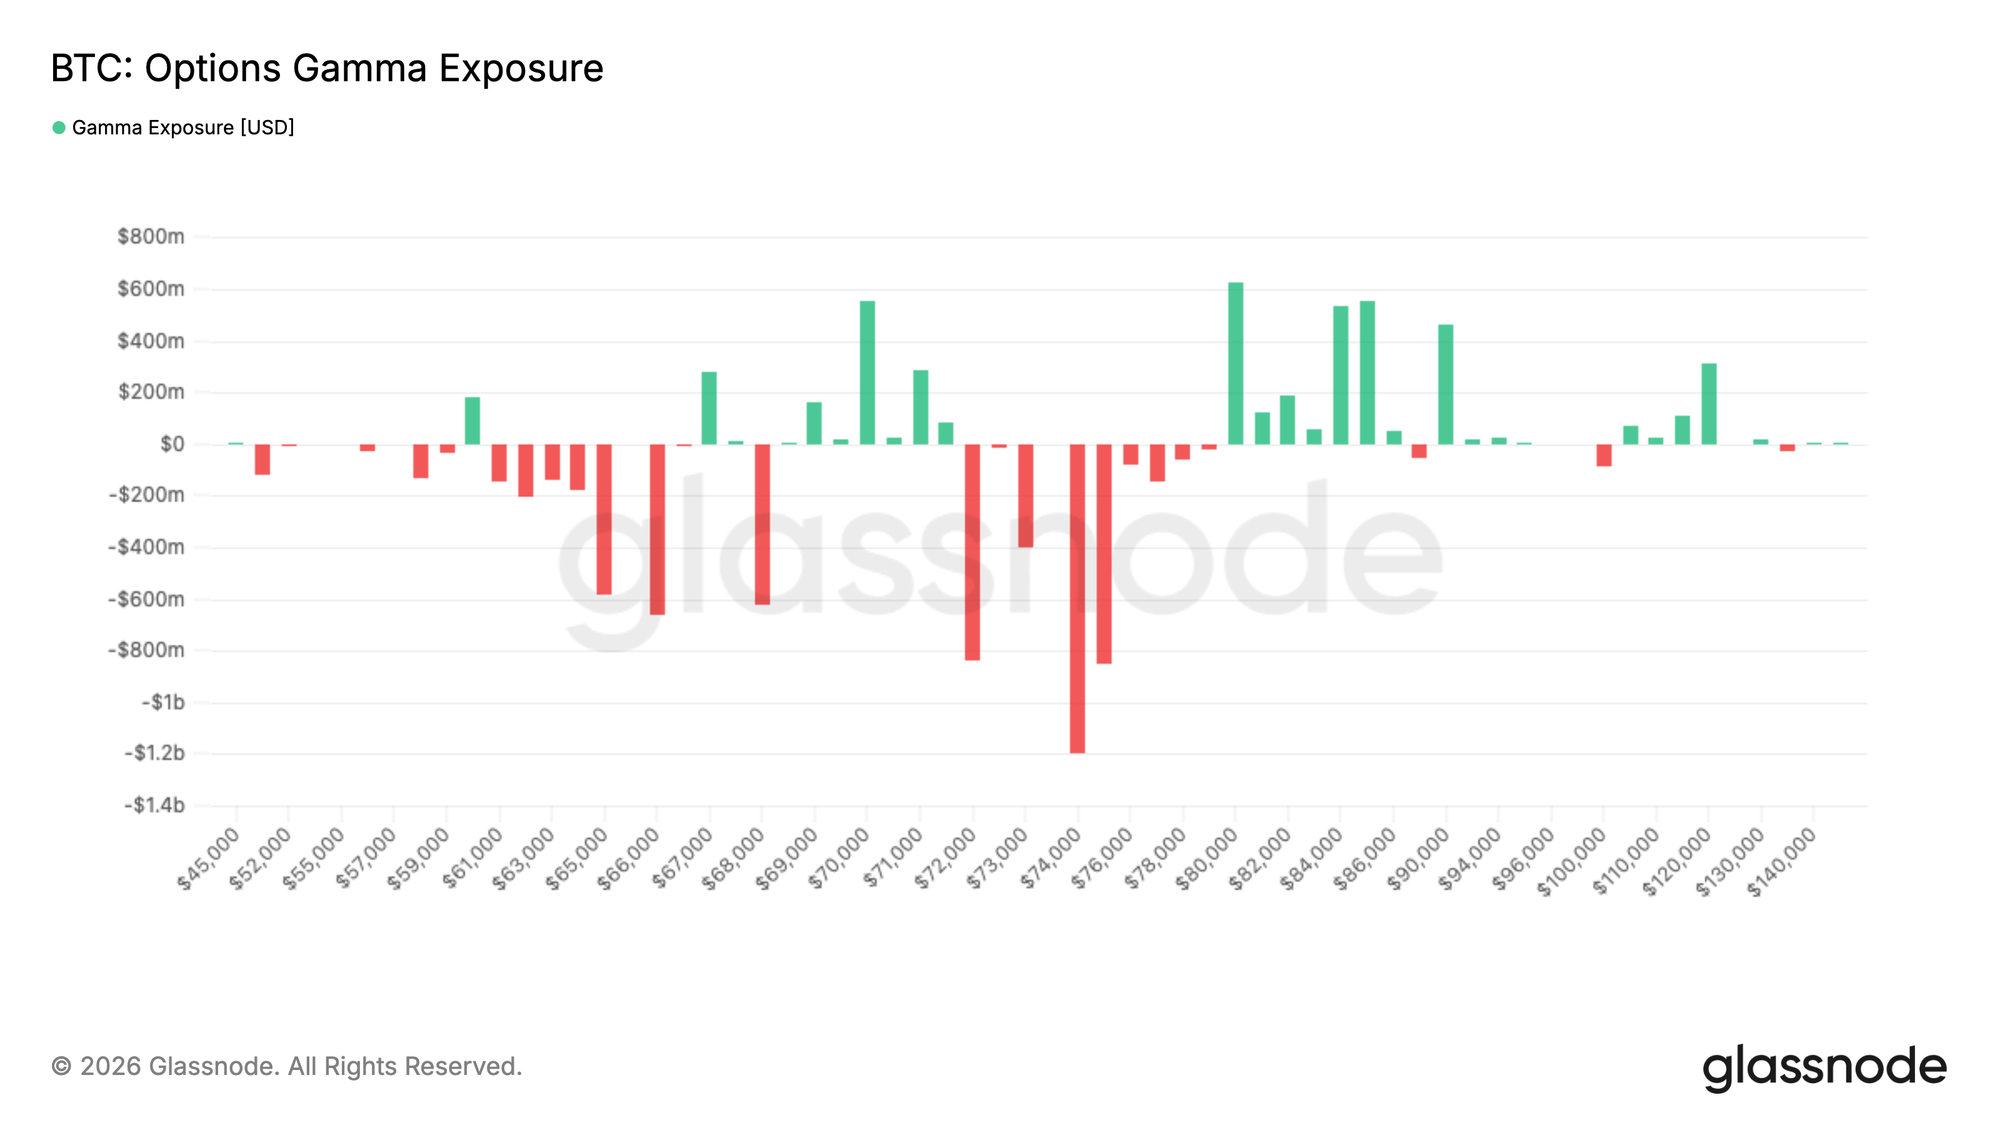
Gamma Positioning Shifts Toward Support Below Spot
Turning to dealer positioning, the gamma profile has shifted meaningfully compared to last week. Previously, the market was sitting within a broad short gamma range extending from the low 40Ks up to 80K, creating conditions where dealer hedging could amplify price moves in either direction.
That structure has now evolved. Short gamma is predominantly positioned above the current price, while a pocket of long gamma has developed between 69K and 71.5K, providing a degree of near-term support as dealers are incentivized to buy into weakness within that range.
Recent geopolitical developments have also driven renewed interest in upside exposure, but this has been expressed through spread structures, which explains why short gamma now reappears further above spot, particularly beyond the 80K region. Overall, the market is transitioning toward a more balanced structure, with downside moves likely to be more contained in the near term while resistance builds overhead.
Conclusion
Across spot, futures, and options markets, the dominant theme is one of stabilization without strong conviction. Spot participation remains weak, futures activity has contracted materially, and while ETF flows have turned modestly positive, the broader market still lacks the depth of demand typically associated with a more durable recovery phase.
Options markets echo this message. Implied volatility has compressed across the curve, but skew remains tilted toward puts, suggesting traders are comfortable reducing volatility exposure without abandoning downside protection. At the same time, realized volatility has continued to ease, reflecting a calmer but thinner market backdrop where incremental flows can still exert an outsized influence on price.
Taken together, the market appears to be transitioning into a cleaner and more balanced structure after the recent washout, but not yet into a fully constructive trend. For that shift to occur, stronger spot demand, broader participation, and a more decisive re-engagement across derivatives markets will likely be required.
Disclaimer: This report does not provide any investment advice. All data is provided for informational and educational purposes only. No investment decision shall be based on the information provided here, and you are solely responsible for your own investment decisions.
Exchange balances presented are derived from Glassnode’s comprehensive database of address labels, which are amassed through both officially published exchange information and proprietary clustering algorithms. While we strive to ensure the utmost accuracy in representing exchange balances, it is important to note that these figures might not always encapsulate the entirety of an exchange’s reserves, particularly when exchanges refrain from disclosing their official addresses. We urge users to exercise caution and discretion when utilizing these metrics. Glassnode shall not be held responsible for any discrepancies or potential inaccuracies.