Approaching the Ceiling
$BTC holds ~$74K, ~5% below key $78K resistance. Spot and ETF demand improve, but profit-taking, weak breadth, and cautious options positioning suggest a fragile, flow-driven recovery lacking strong conviction.


This report is also freely available for download in PDF format.
Executive Summary
- Bitcoin has expanded to ~$74K, now 5.2% below the True Market Mean at $78.1K, which remains the key near-term resistance. Short-Term Holder Supply in Profit sits at 43.2%, leaving room for further upside before typical distribution thresholds are reached.
- Profit-taking activity is rising, with the 30D EMA of the Realized Profit/Loss Ratio at 1.16, indicating investors are selling into strength. A sustained move above $78.1K will require the market to absorb this overhead supply.
- Institutional positioning is stabilizing, with ETF inflows and CME exposure rebounding. However, participation remains below prior highs, pointing to a cautious and selective re-engagement rather than a full risk-on shift.
- Spot and liquidity dynamics reflect uneven demand. Binance-led buying is outpacing Coinbase, while Hyperliquid data shows a liquidity-driven range, with price reacting between dense long and short liquidation clusters.
- Derivatives and on-chain signals suggest a neutral-to-fragile structure. Funding remains balanced, implied volatility is compressed, and exchange flows have turned modestly positive, indicating early accumulation but limited conviction.
On-Chain Insights
Approaching the Ceiling
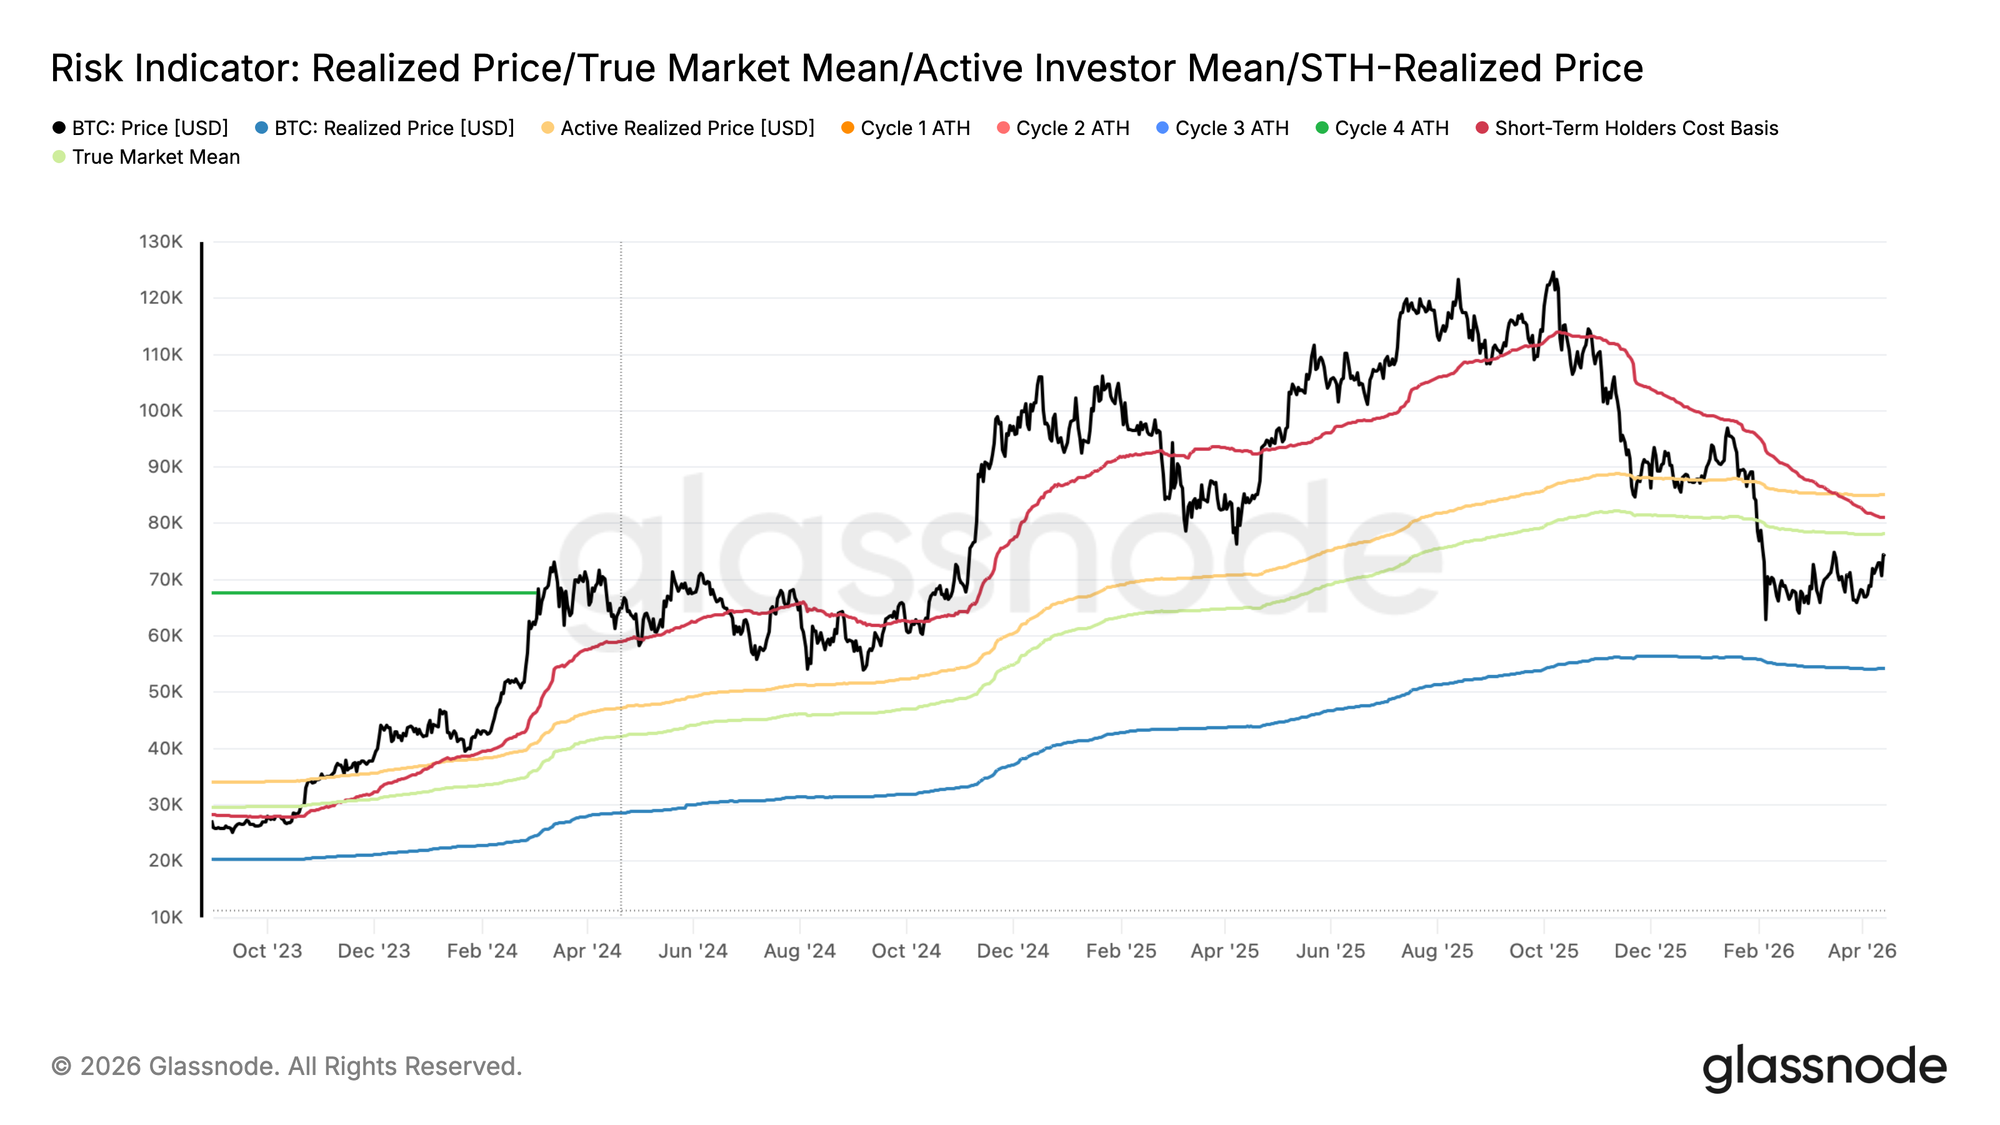
Last week, this report identified the True Market Mean at $78.1k as the most probable mid-term ceiling for any relief rally within the ongoing bear market structure.
Since then, Bitcoin has gradually trended higher, now trading near $74k, approximately 5.2% below the True Market Mean, tracing the cost basis of active supply. While price has yet to test and stabilize above this key threshold, the probability of a spike toward and potentially above it remains considerable in the mid-term.
In this edition, we examine the on-chain tools best suited for identifying local tops within a bear market rally, helping investors navigate the risk of distribution pressure as price approaches structurally significant resistance.
New Buyers Close to Tipping Point
With price still consolidating below the True Market Mean, the behaviour of short-term holders offers a reliable lens for identifying where bear market rallies are likely to exhaust.
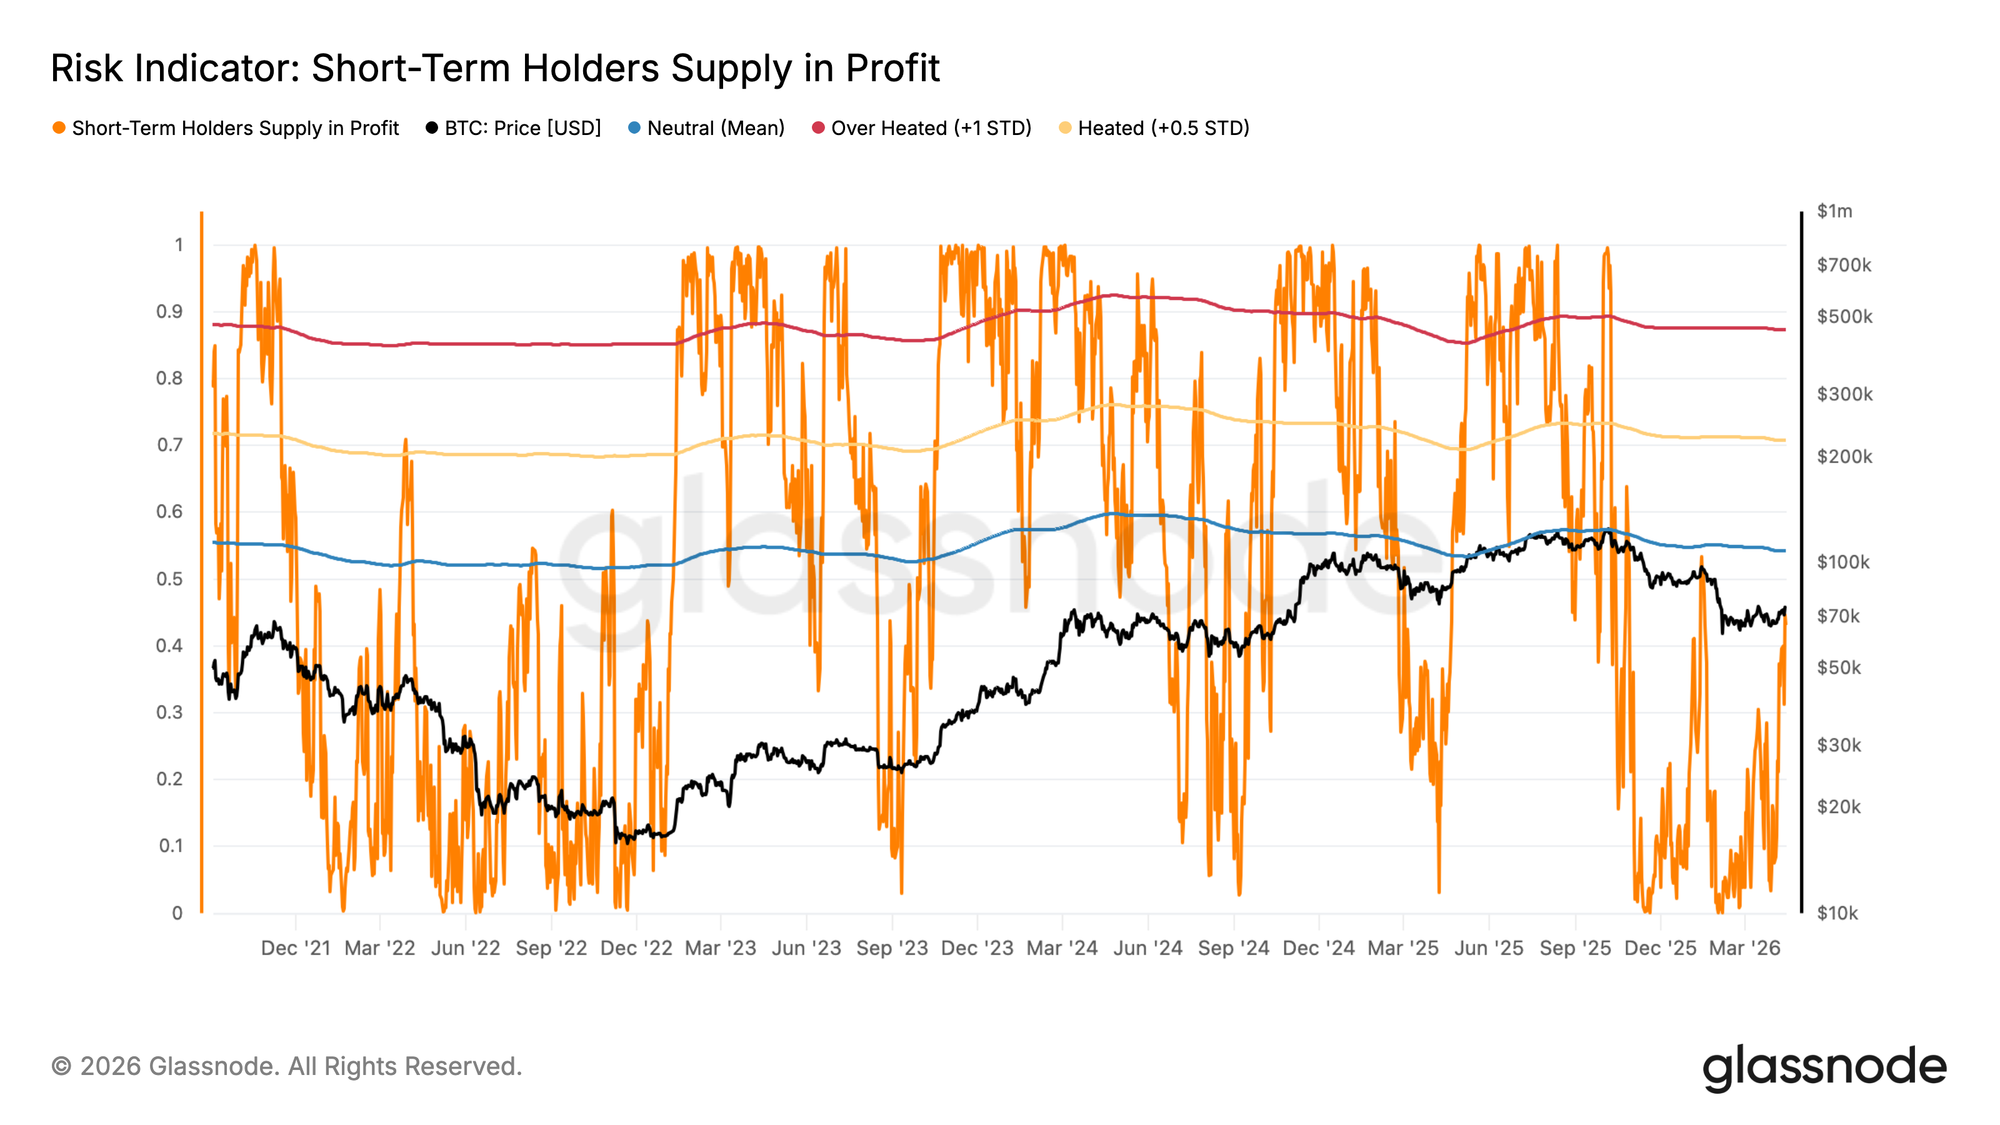
The Percent of Short-Term Holder Supply in Profit measures the share of recently acquired supply currently held at an unrealized gain, serving as a direct gauge of profit-taking pressure among newer market participants. Historically, local tops in bear market rallies have tended to form as this metric approaches its statistical mean of approximately 54.2%, a threshold where the concentration of profitable short-term holders becomes sufficient to trigger meaningful distribution. Currently at 43.2%, this indicator remains meaningfully below that threshold, suggesting the present rally has not yet reached the zone of typical exhaustion. This leaves slight room for further upside toward the True Market Mean, while also providing a quantitative level to monitor as price advances.
Profit Taking Alarm Bells
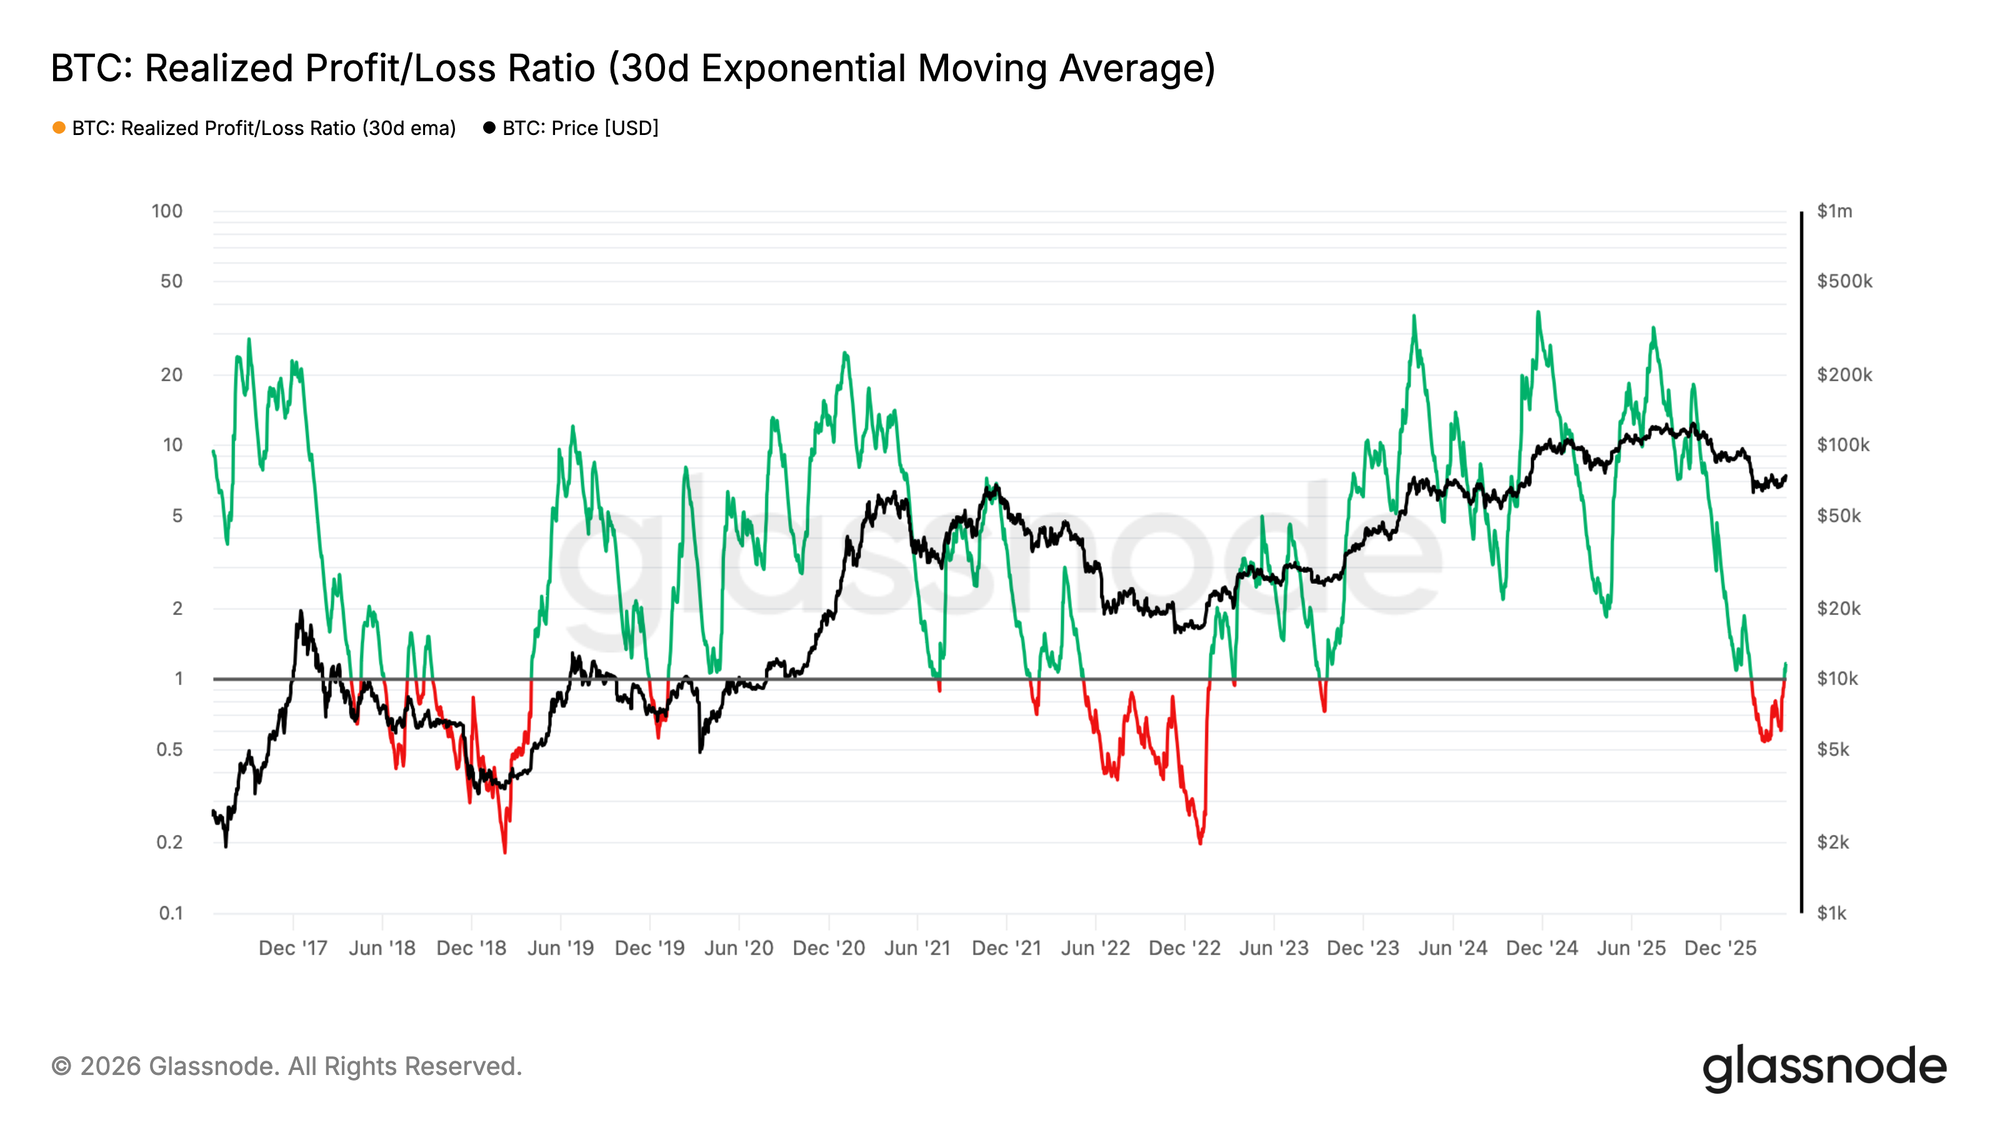
Building on the near-term exhaustion signals outlined above, a longer-term assessment of market momentum requires examining the balance between profit and loss realization across the broader investor base. The Realized Profit/Loss Ratio measures the dollar value of profits realized on-chain for every dollar of losses crystallized, with the 30-day EMA smoothing short-term noise to reveal the underlying trend.
A reading above 1 indicates that profit-taking is dominating loss realization. Therefore, the current reading of 1.16 confirms that investors are broadly seizing the present rally as an opportunity to exit positions at breakeven or capture thin profit margins. While this is not an immediate reversal signal, a sharp spike in this ratio during a bear market rally has historically been a cautionary indicator of distribution rather than genuine demand recovery.
For this bounce to evolve into a structural shift toward a bull market, the market would need a significant demand catalyst capable of absorbing this wave of profit realization and sustaining price above the True Market Mean at $78.1k on a mid-term basis.
Off-Chain Insights
Selective Spot Bidding
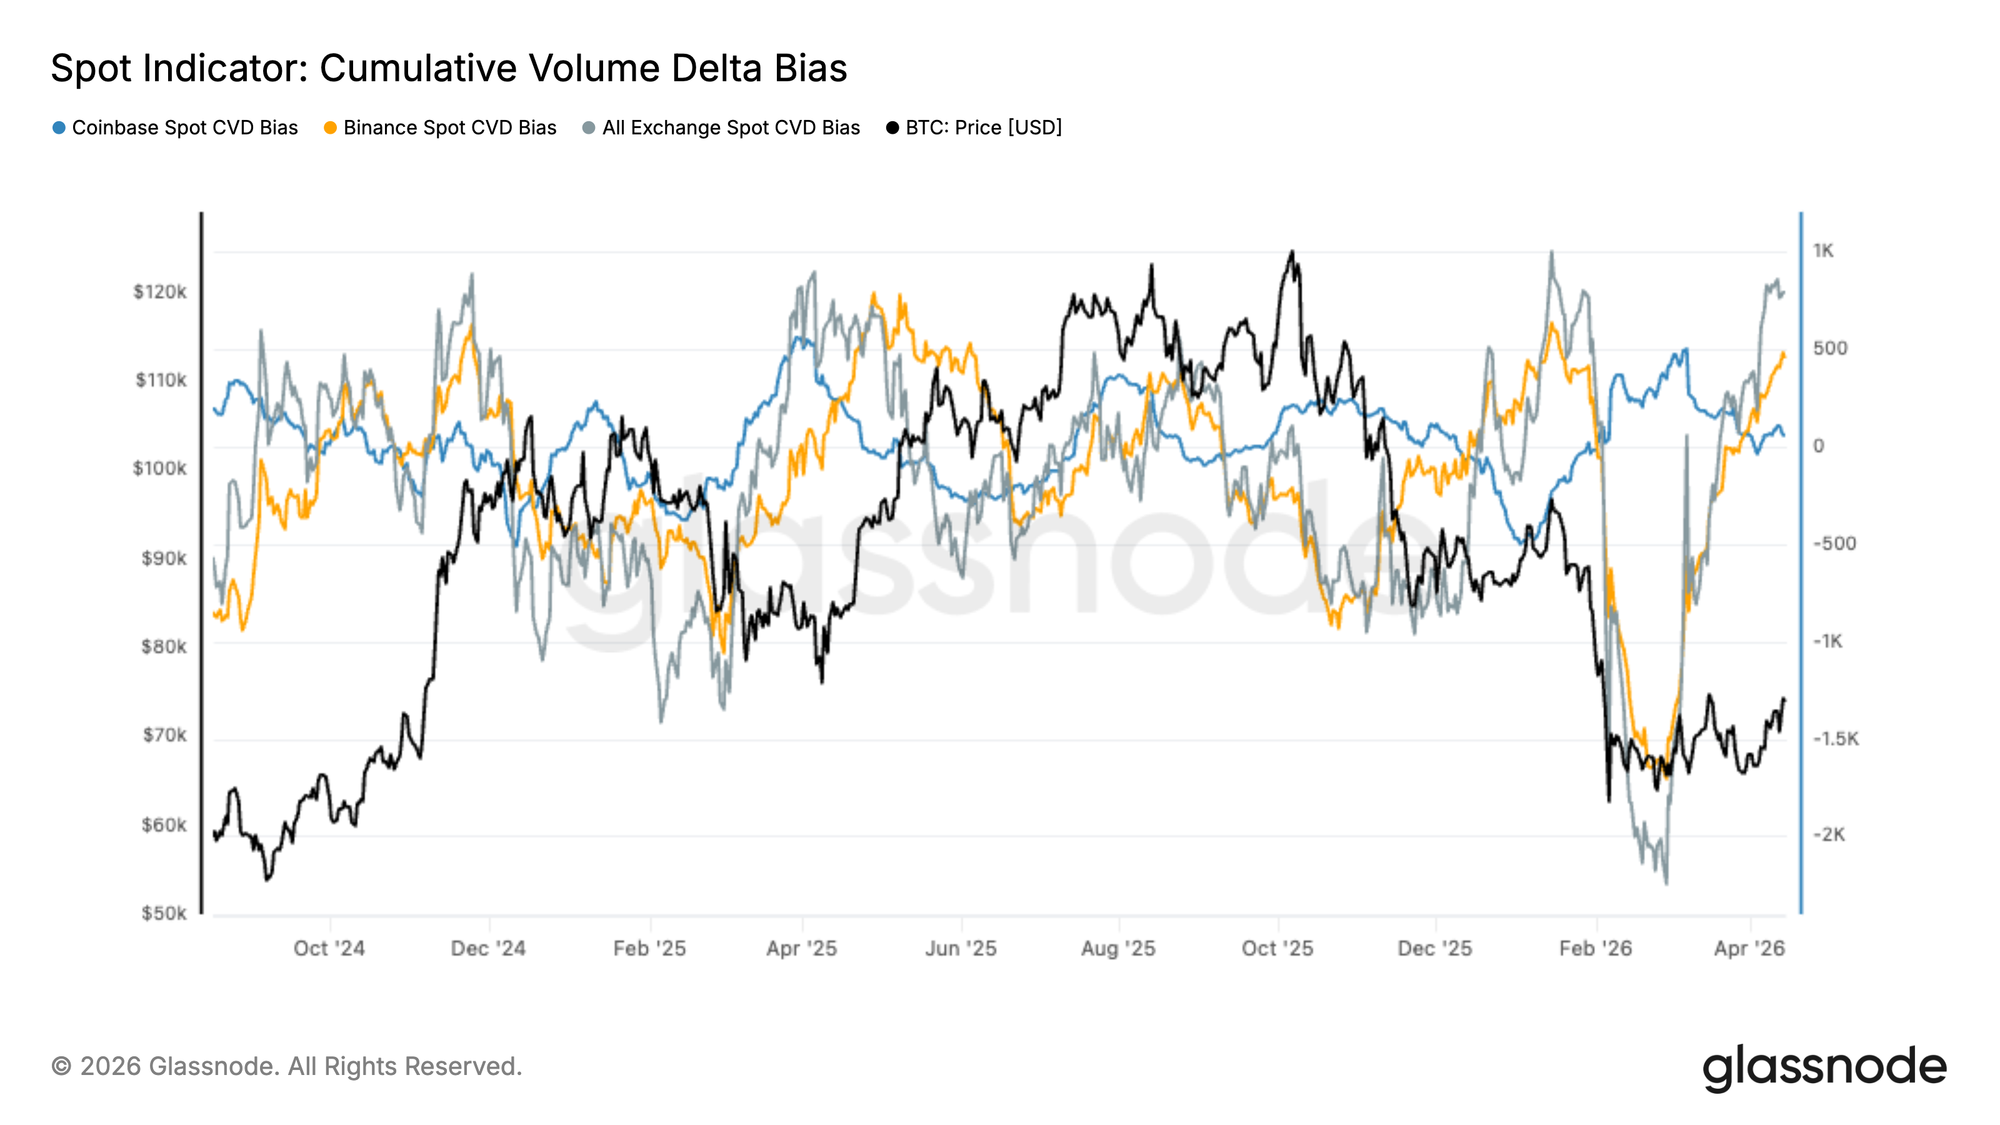
Following the February capitulation event, spot CVD has rebounded sharply, with aggregate flows recovering from deeply negative levels back into positive territory. This shift points to a clear transition from aggressive sell-side pressure to net spot accumulation, aligning with the recent price stabilization.
However, the recovery in demand is not yet uniform across venues.
Binance flows have led the move higher, suggesting renewed activity from offshore and retail-driven segments. In contrast, Coinbase CVD remains relatively subdued, indicating a slower re-engagement from institutional participants. This divergence is notable, as sustained rallies typically require broader participation across both cohorts.
While the absorption of sell-side pressure is constructive, the current structure reflects a more selective bid rather than a fully established demand regime.
For the recovery to prove durable, stronger confirmation from Coinbase flows will likely be needed, signalling deeper institutional involvement and more resilient support at higher price levels.
CME Futures & ETF Positioning Rebuilds, Cautiously
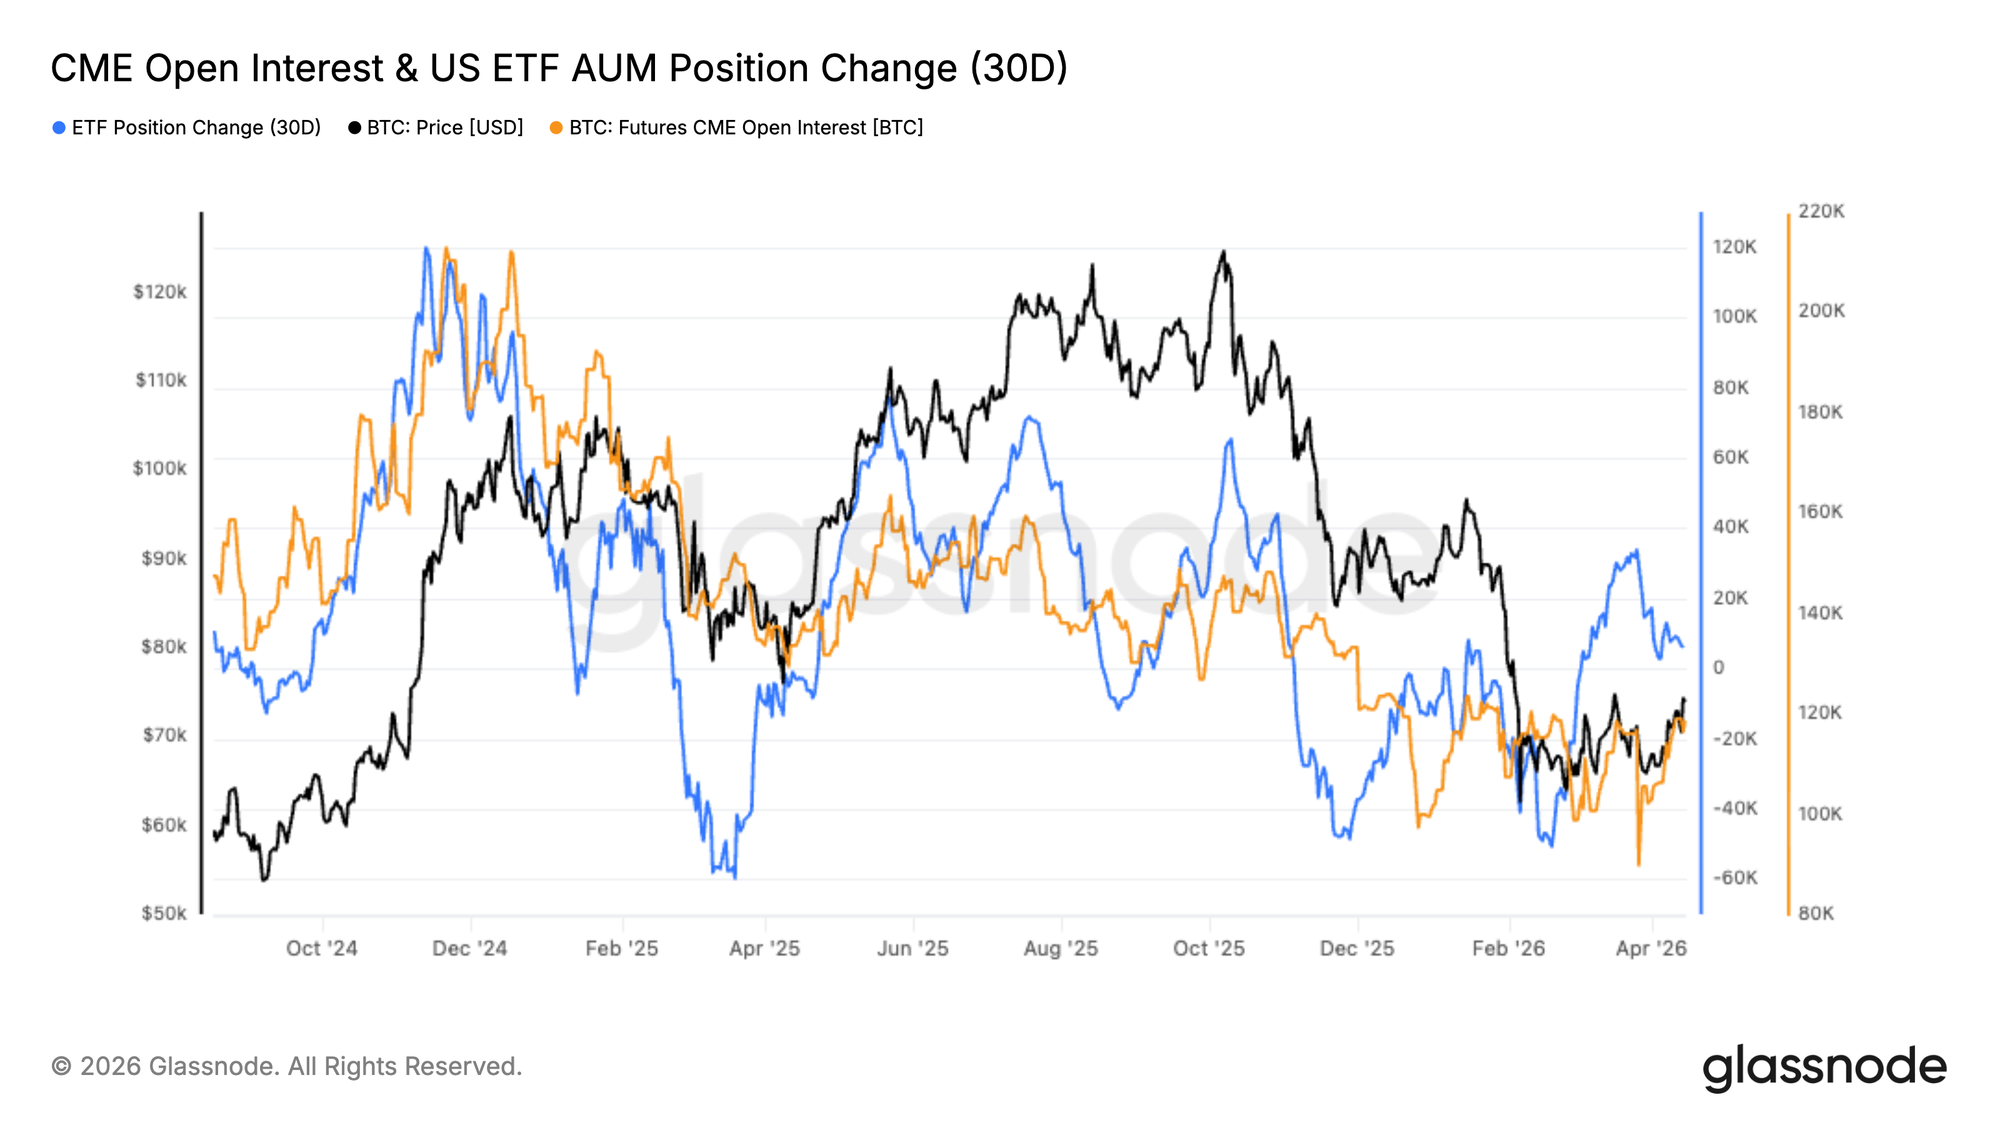
Institutional exposure appears to be stabilizing following the February drawdown, with both CME open interest and US ETF AUM flows showing early signs of recovery. After a sharp deleveraging event, CME positioning has begun to rebuild from local lows, suggesting a gradual return of futures-based exposure.
At the same time, ETF flows have shifted back into positive territory after a sustained period of outflows. This reversal indicates renewed capital allocation via regulated investment vehicles, often associated with longer-term and institutional participants.
However, the recovery remains measured rather than aggressive. CME open interest is still well below prior highs, and ETF inflows lack the sustained momentum seen during earlier phases of the cycle. This points to a more cautious re-engagement, rather than a full risk-on shift.
Taken together, the data suggest that institutional players are beginning to re-enter the market, but with a more selective and controlled approach. A stronger and more persistent expansion in both CME positioning and ETF inflows would be required to signal a more decisive return of institutional conviction.
Hyperliquid Perps Highlight a Liquidity-Driven Range
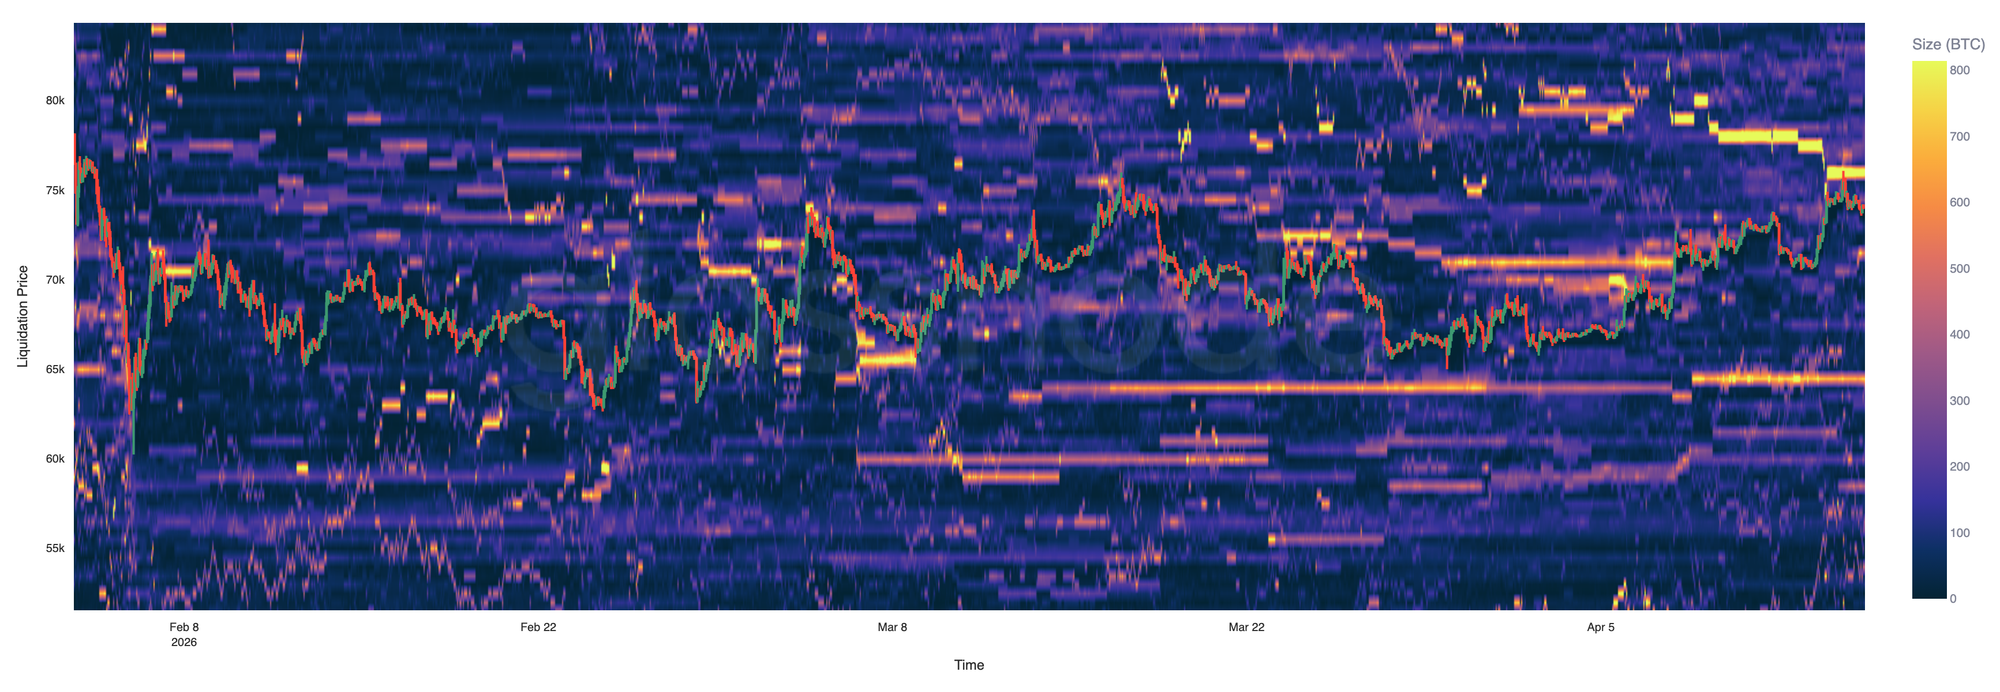
Hyperliquid liquidation data shows a tightly clustered and highly reactive perp market, with liquidity concentrated close to the current price. As a single-venue view, this reflects more tactical positioning, offering insight into short-term leverage dynamics rather than broad market structure.
On the downside, a dense band of long liquidations sits between $63K and $65K. Price has repeatedly probed this region, suggesting it acts as a near-term liquidity magnet where forced selling is triggered and absorbed.
To the upside, short liquidation clusters are concentrated around $74K to $76K. Recent rallies have tested this zone but failed to break through decisively, indicating overhead liquidity continues to cap price.
Overall, price action appears driven by liquidation flows rather than strong directional conviction. A sustained move will likely require clearing one side of the book, triggering a cascade and allowing for expansion beyond the current range.
Implied Volatility Term Structure Remains Compressed
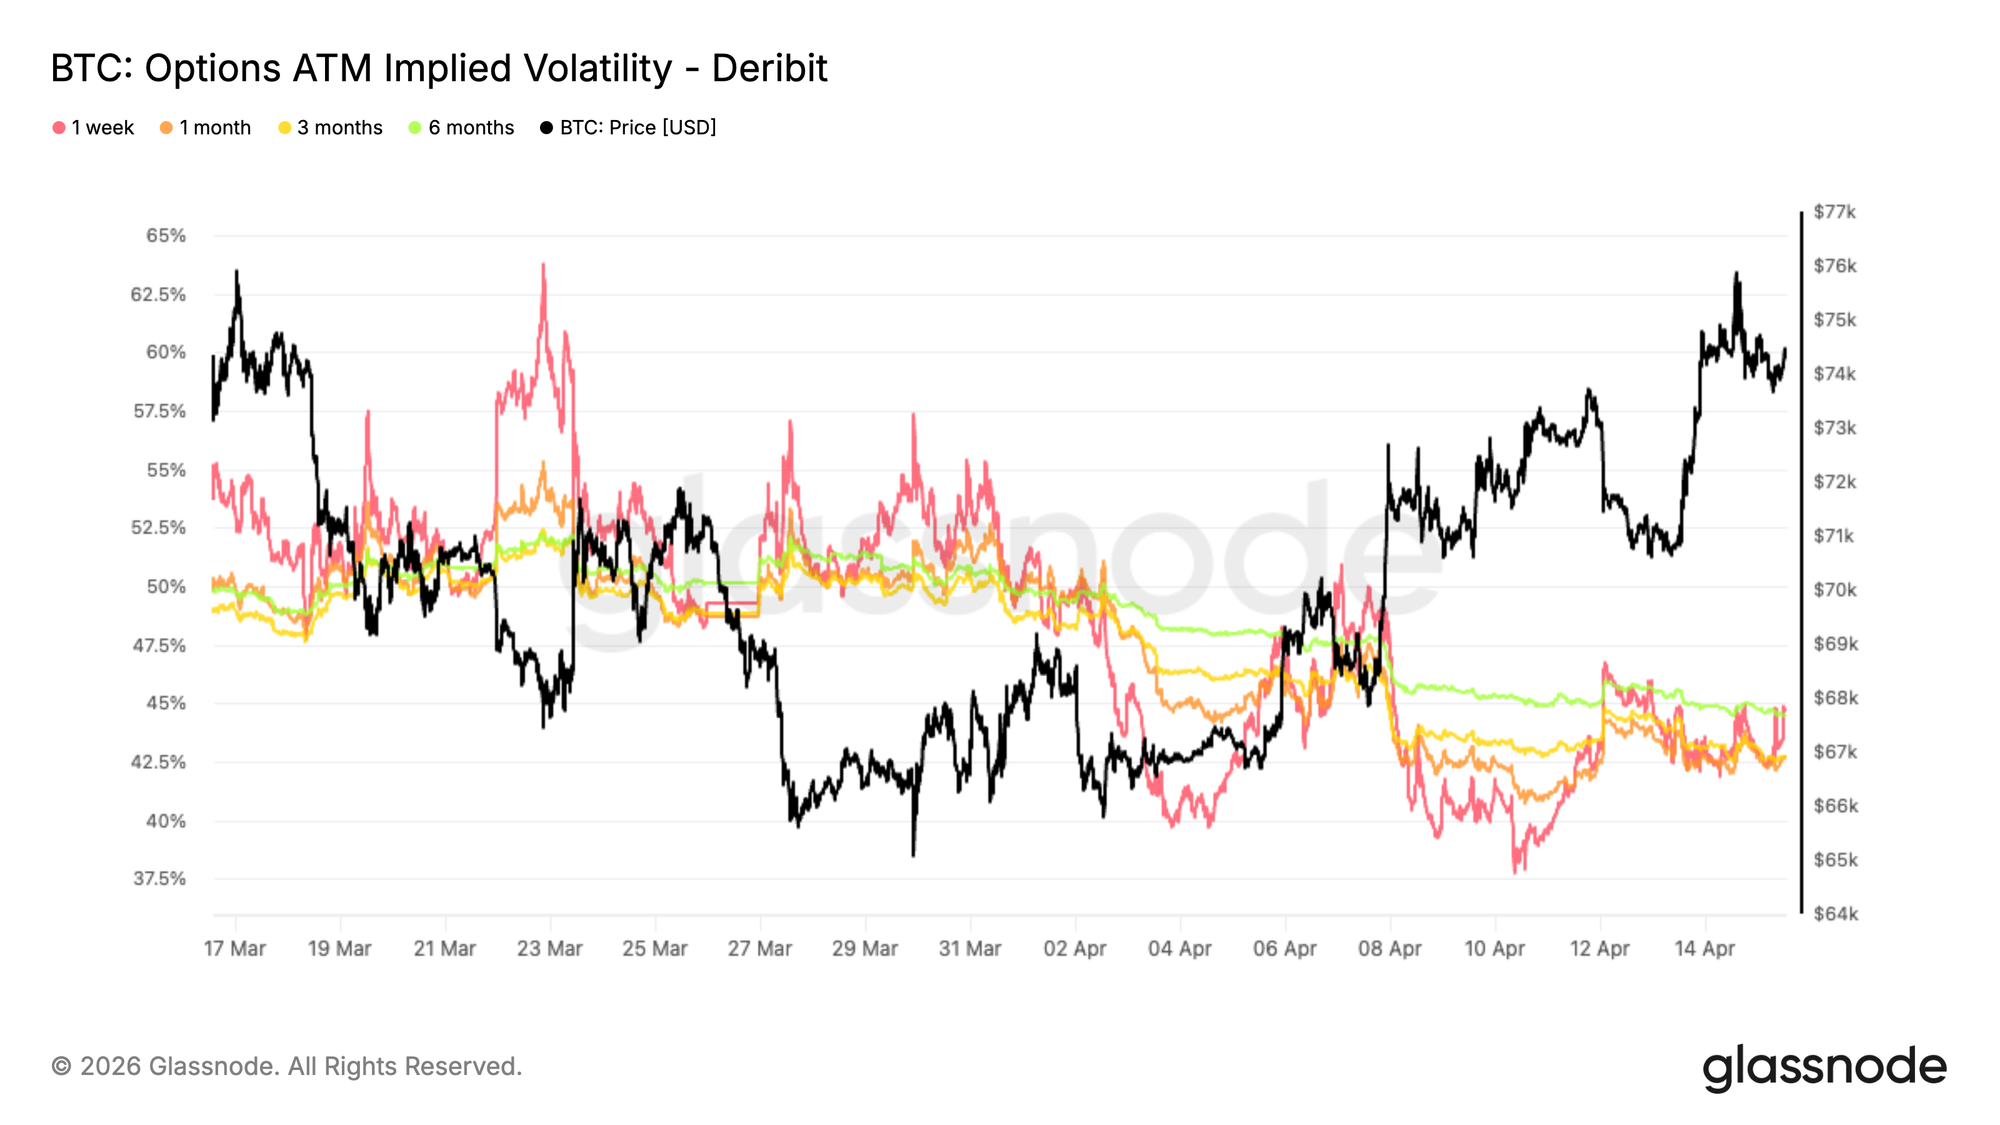
The relief rally in spot has not translated into a meaningful repricing of volatility, with implied volatility declining across the curve. Front-end contracts have softened, while longer-dated maturities have also repriced lower, pointing to a broad-based normalization in volatility expectations. The term structure remains relatively flat, with 1-month volatility trading slightly below 3-month at around 42.6%, reflecting limited urgency to price near-term risk. This compression suggests that recent geopolitical headlines are no longer viewed as catalysts for sustained turbulence. Instead, volatility is being repriced toward more stable conditions, even as macro uncertainty remains unresolved. The parallel shift lower across maturities indicates that traders are unwinding protection rather than adding new exposure.
Despite the move higher in price, options markets are not signaling a regime change, but rather a normalization following a period of elevated stress.
25 Delta Skew Still Reflects Downside Demand
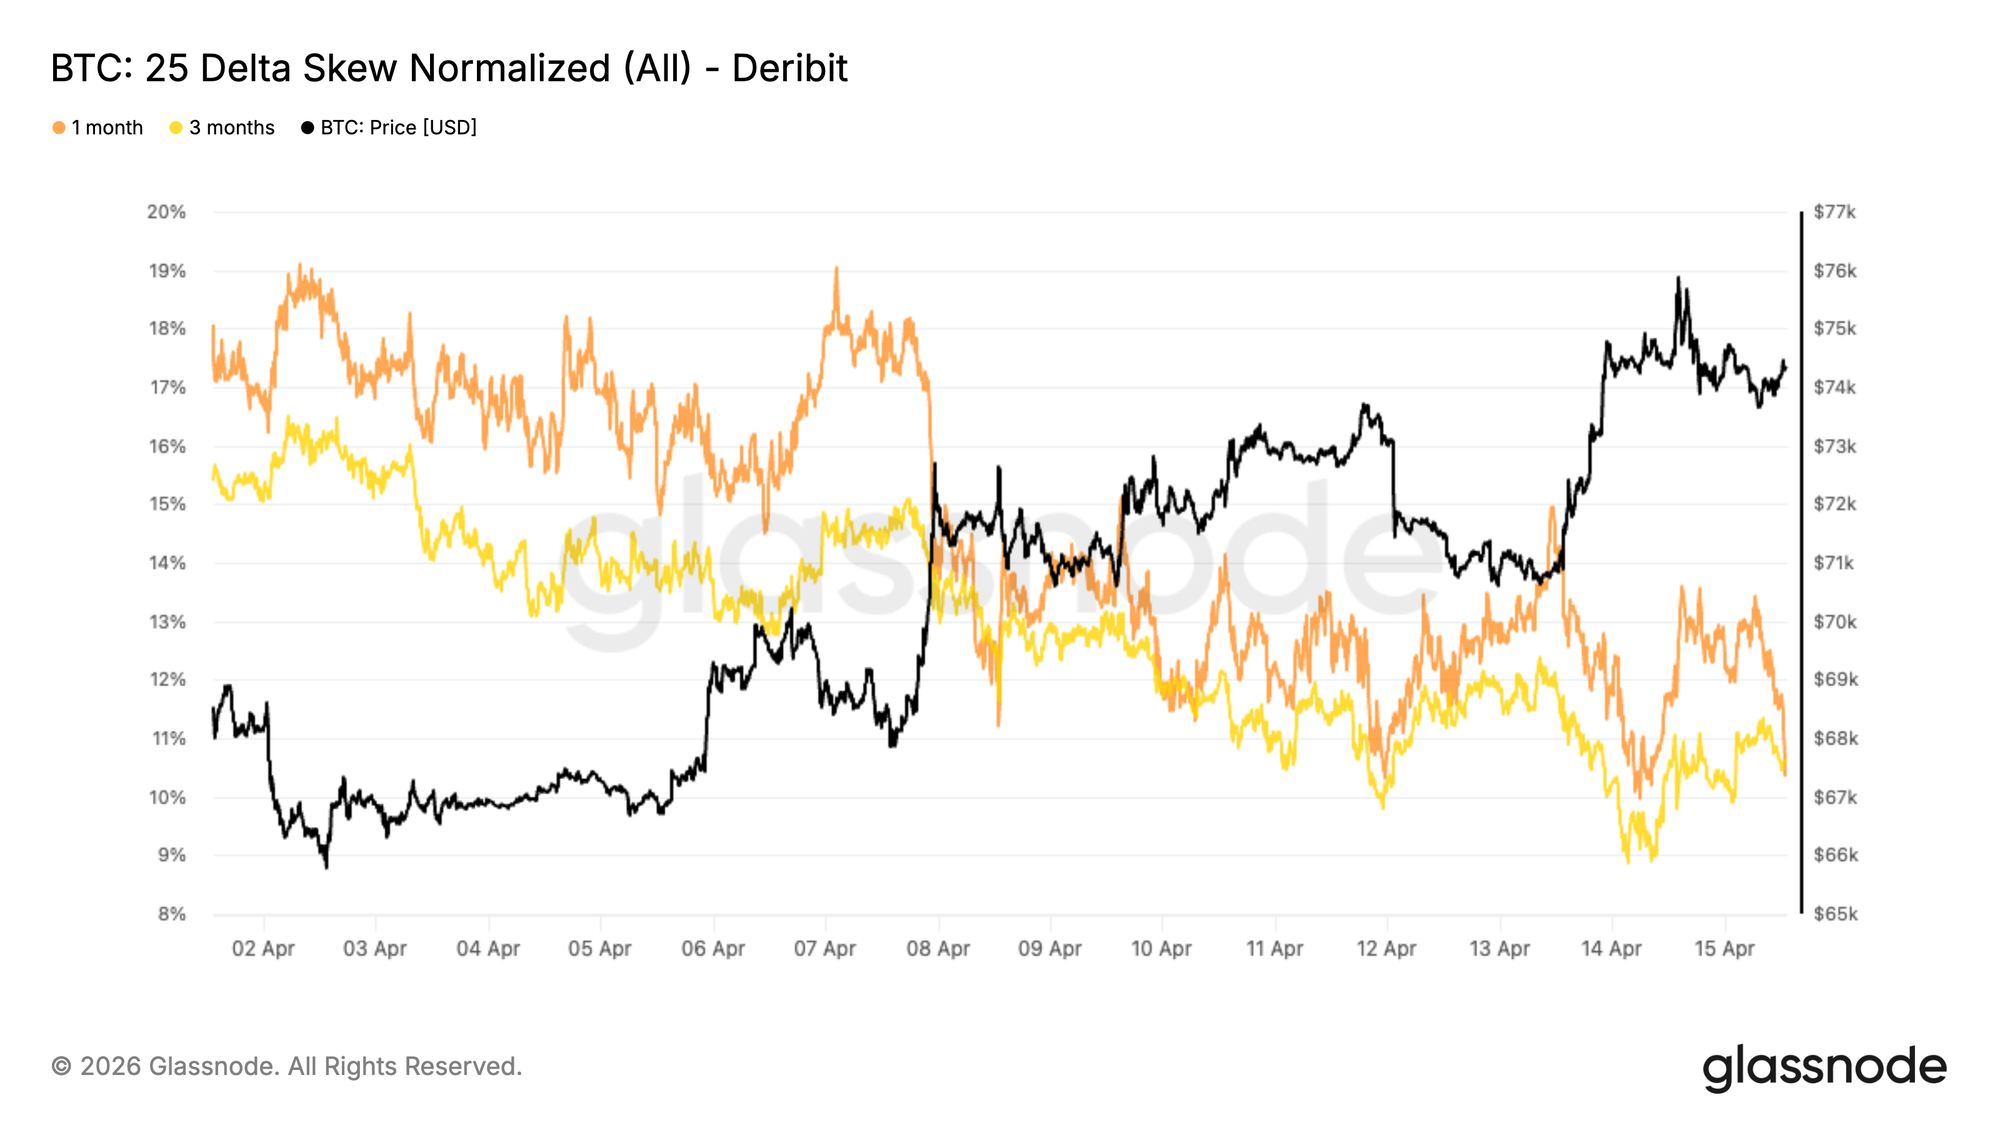
While volatility levels have eased, the relative pricing of options continues to show a preference for protection. The 25 delta skew remains tilted toward puts across maturities, indicating that downside options still trade at a premium relative to calls, although the skew itself has softened from the high teens to the low teens.
This suggests that even as traders reduce outright hedges, they are not rotating aggressively into upside positioning. The persistence of negative skew highlights a market that remains cautious beneath the surface.
The recent compression in skew, particularly in longer maturities, points to some normalization as extreme tail-risk hedging is unwound. However, the overall structure still reflects asymmetry in demand, with protection remaining structurally bid.
This divergence between lower volatility and persistent downside skew reinforces the idea that the rally is being treated with skepticism rather than conviction.
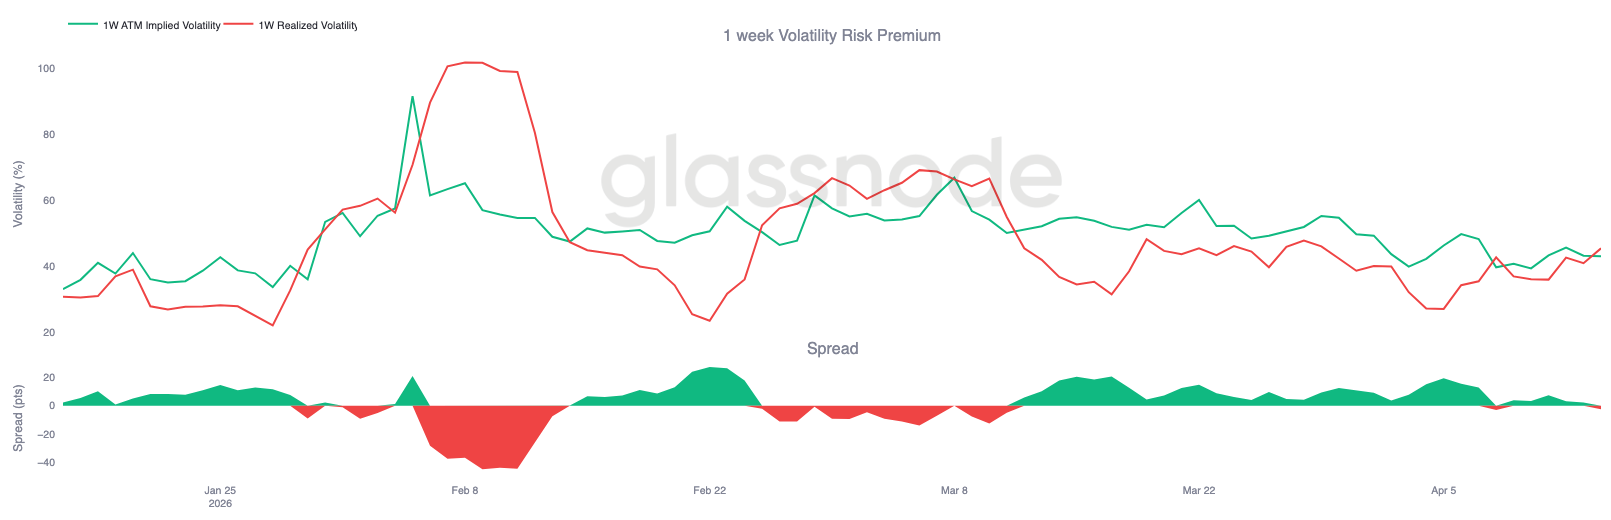
1-Week Volatility Risk Premium Turns Negative
Looking further along the volatility surface, the short-term volatility risk premium has flipped, with realized volatility now exceeding implied volatility. This spread, which measures the gap between forward expectations and actual price movement, currently sits near -2 volatility points, with ATM implied around 43 and realized closer to 45.
This shift follows a sharp move in spot earlier in the week, where Bitcoin posted a +5% rally while implied volatility had been priced at lower levels. As a result, options markets underpriced the magnitude of realized price action, leading to the inversion in the premium.
In this context, short-dated options no longer embed a premium for protection, but instead reflect a market that was caught off guard by realized dynamics.
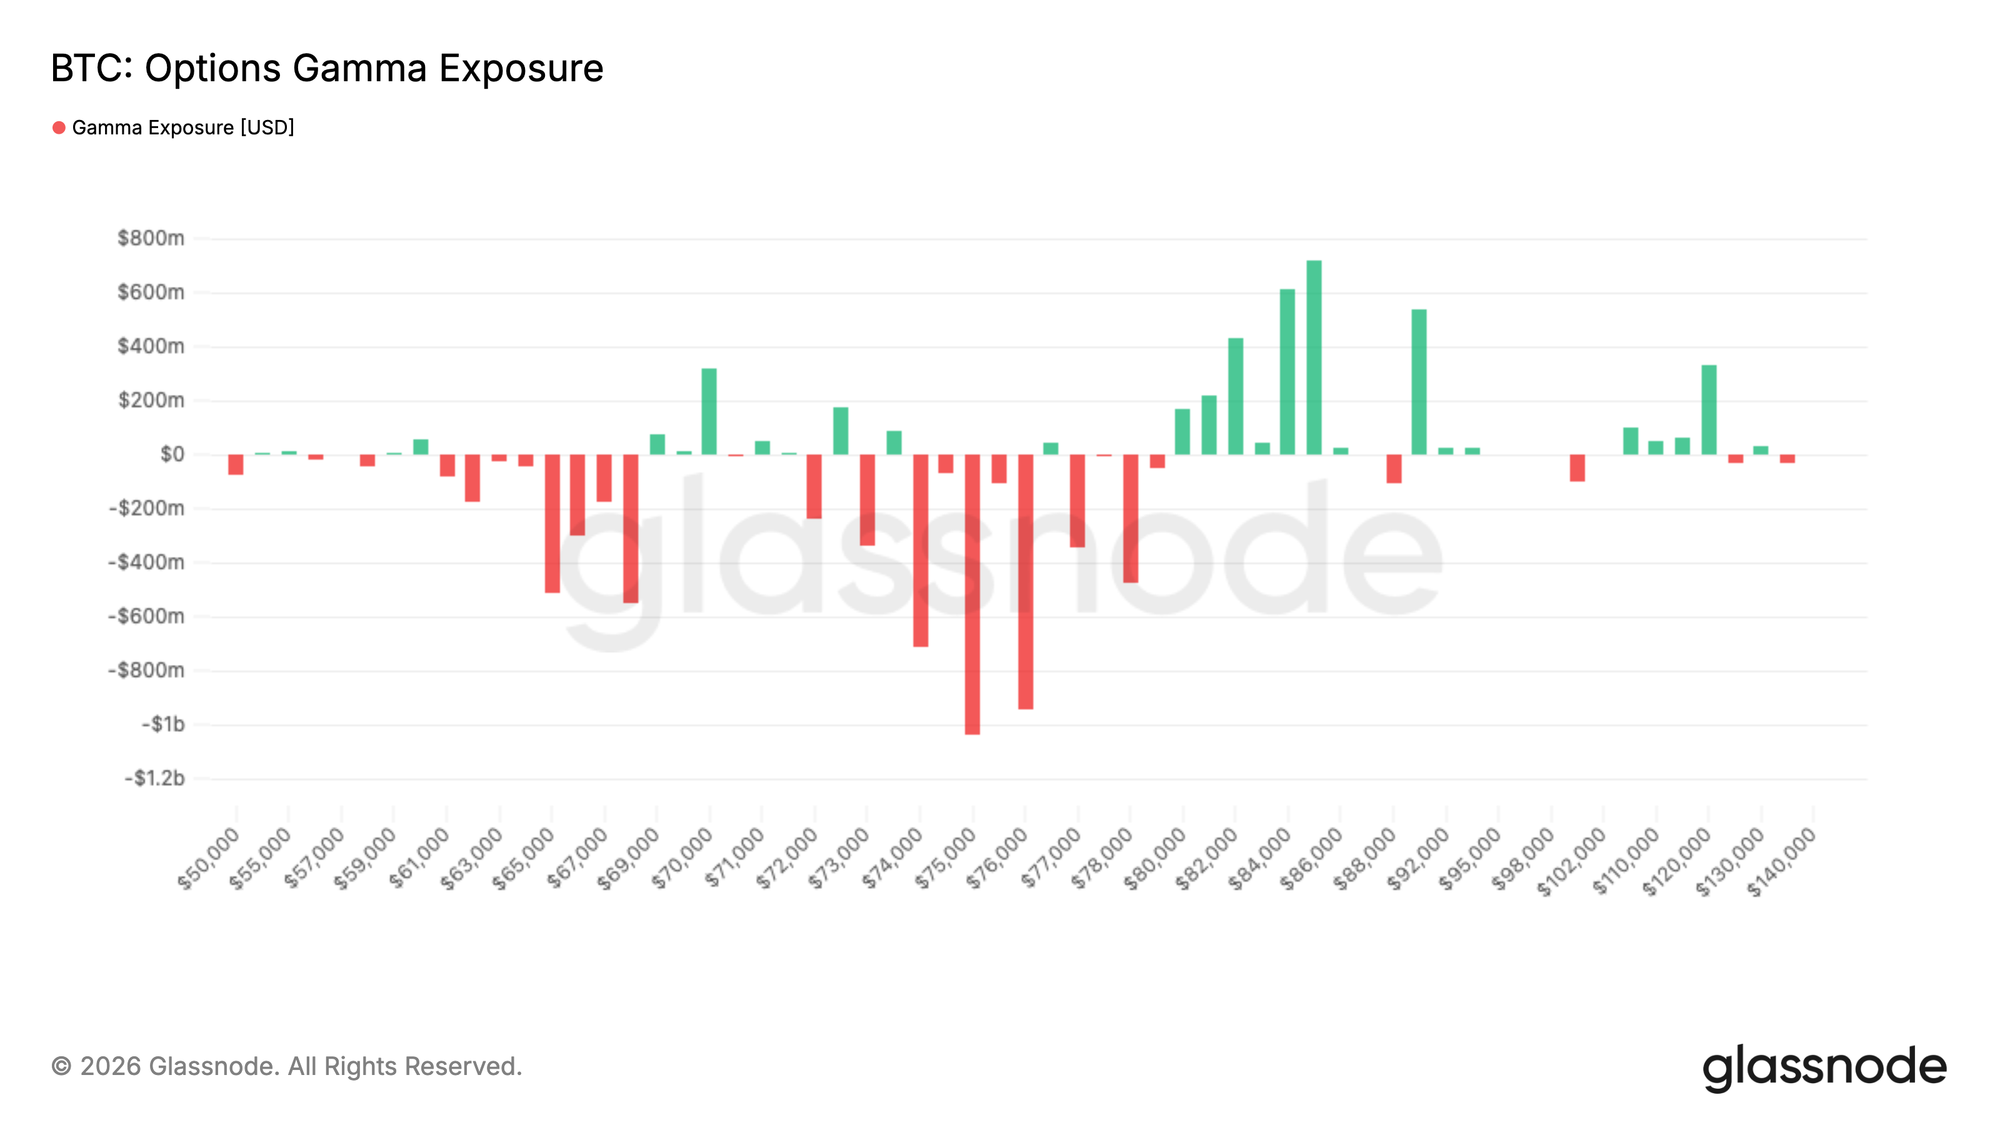
Dealer Gamma Concentration Turns $76K into a Key Pivot
From a market structure perspective, dealer positioning is playing a central role in near-term price action. A significant concentration of negative gamma sits between the $74K and $76K range, with roughly $3 billion of exposure positioned above spot, creating a zone where hedging flows can influence direction.
As spot approaches this area, dealers are required to buy into strength to manage their exposure, reinforcing upward momentum. This dynamic shifts the interpretation of resistance, as levels with high negative gamma can act as accelerants rather than barriers.
Below this zone, the absence of strong positive gamma support suggests that moves could remain sensitive to flows. The current setup reflects a market where mechanical hedging activity can amplify price action, particularly in an environment where liquidity and positioning remain relatively light.
Conclusion
In sum, the market is showing early signs of stabilization across spot, derivatives, and on-chain metrics, but the recovery remains uneven and lacks broad conviction. Spot demand has returned, ETF flows are improving, and positioning is beginning to rebuild, yet participation remains fragmented across venues and investor cohorts. Derivatives and options markets reflect this uncertainty, with neutral positioning and compressed volatility signalling a lack of strong directional bias.
At the same time, structural headwinds persist. Profit-taking is increasing into strength, short-term holders are approaching breakeven levels, and options skew continues to show a preference for downside protection. Liquidity dynamics and dealer positioning are also playing an outsized role, reinforcing a reactive, flow-driven environment.
For a more decisive trend to emerge, the market will likely require sustained inflows, stronger institutional participation, and the ability to absorb overhead supply near key resistance levels, particularly around the True Market Mean.
Disclaimer: This report does not provide any investment advice. All data is provided for informational and educational purposes only. No investment decision shall be based on the information provided here, and you are solely responsible for your own investment decisions.
Exchange balances presented are derived from Glassnode’s comprehensive database of address labels, which are amassed through both officially published exchange information and proprietary clustering algorithms. While we strive to ensure the utmost accuracy in representing exchange balances, it is important to note that these figures might not always encapsulate the entirety of an exchange’s reserves, particularly when exchanges refrain from disclosing their official addresses. We urge users to exercise caution and discretion when utilizing these metrics. Glassnode shall not be held responsible for any discrepancies or potential inaccuracies.