Mean Reclaimed, Rally on Trial
BTC reclaims $78k as spot demand and ETF inflows return. Shorts build with negative funding, creating squeeze potential. Yet elevated realized profits and soft volatility signal caution, with upside near $80k facing resistance.


Executive Summary
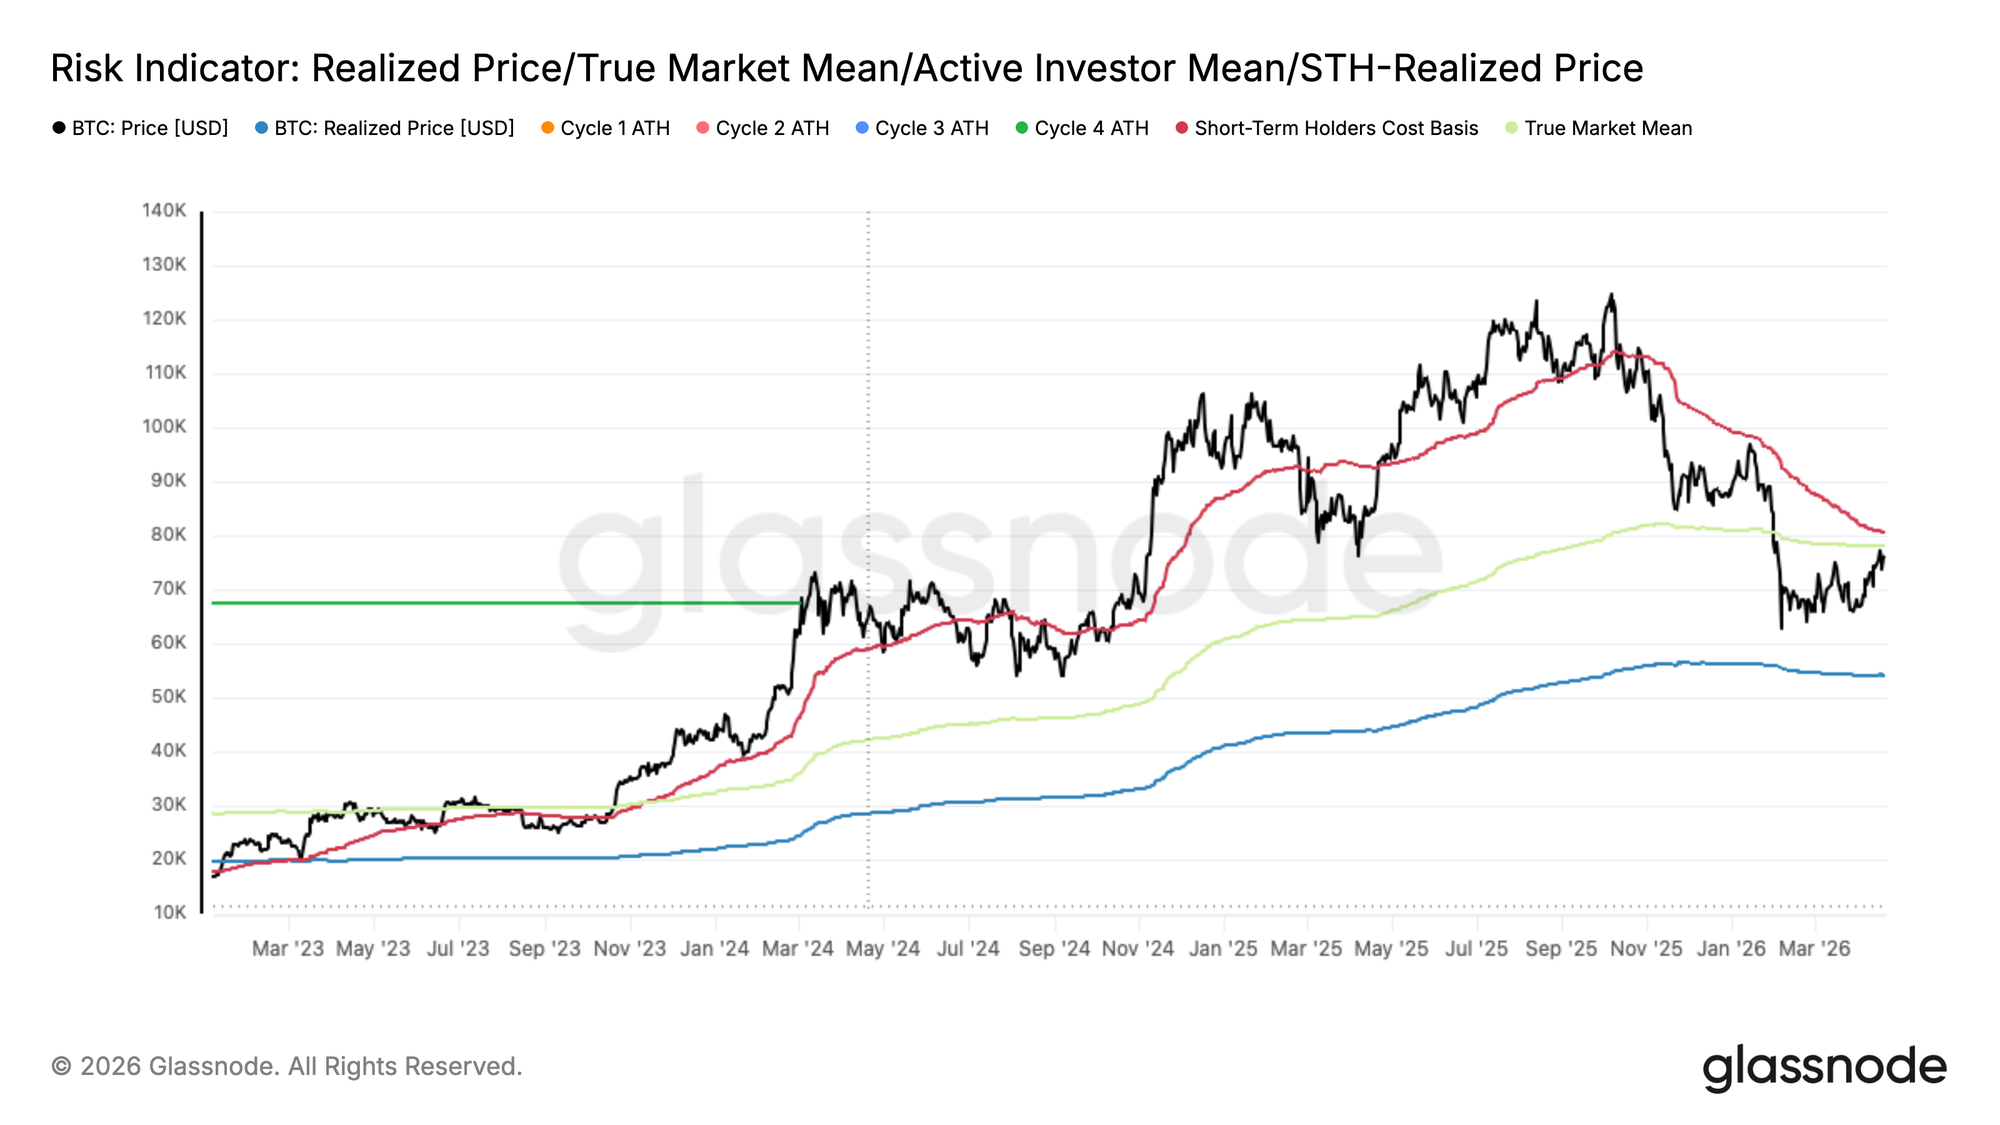
- Bitcoin has broken above the True Market Mean at $78.1k for the first time since mid-January, a significant mean reversion, with the Short-Term Holder Cost Basis at $80.1k now the immediate resistance ceiling.
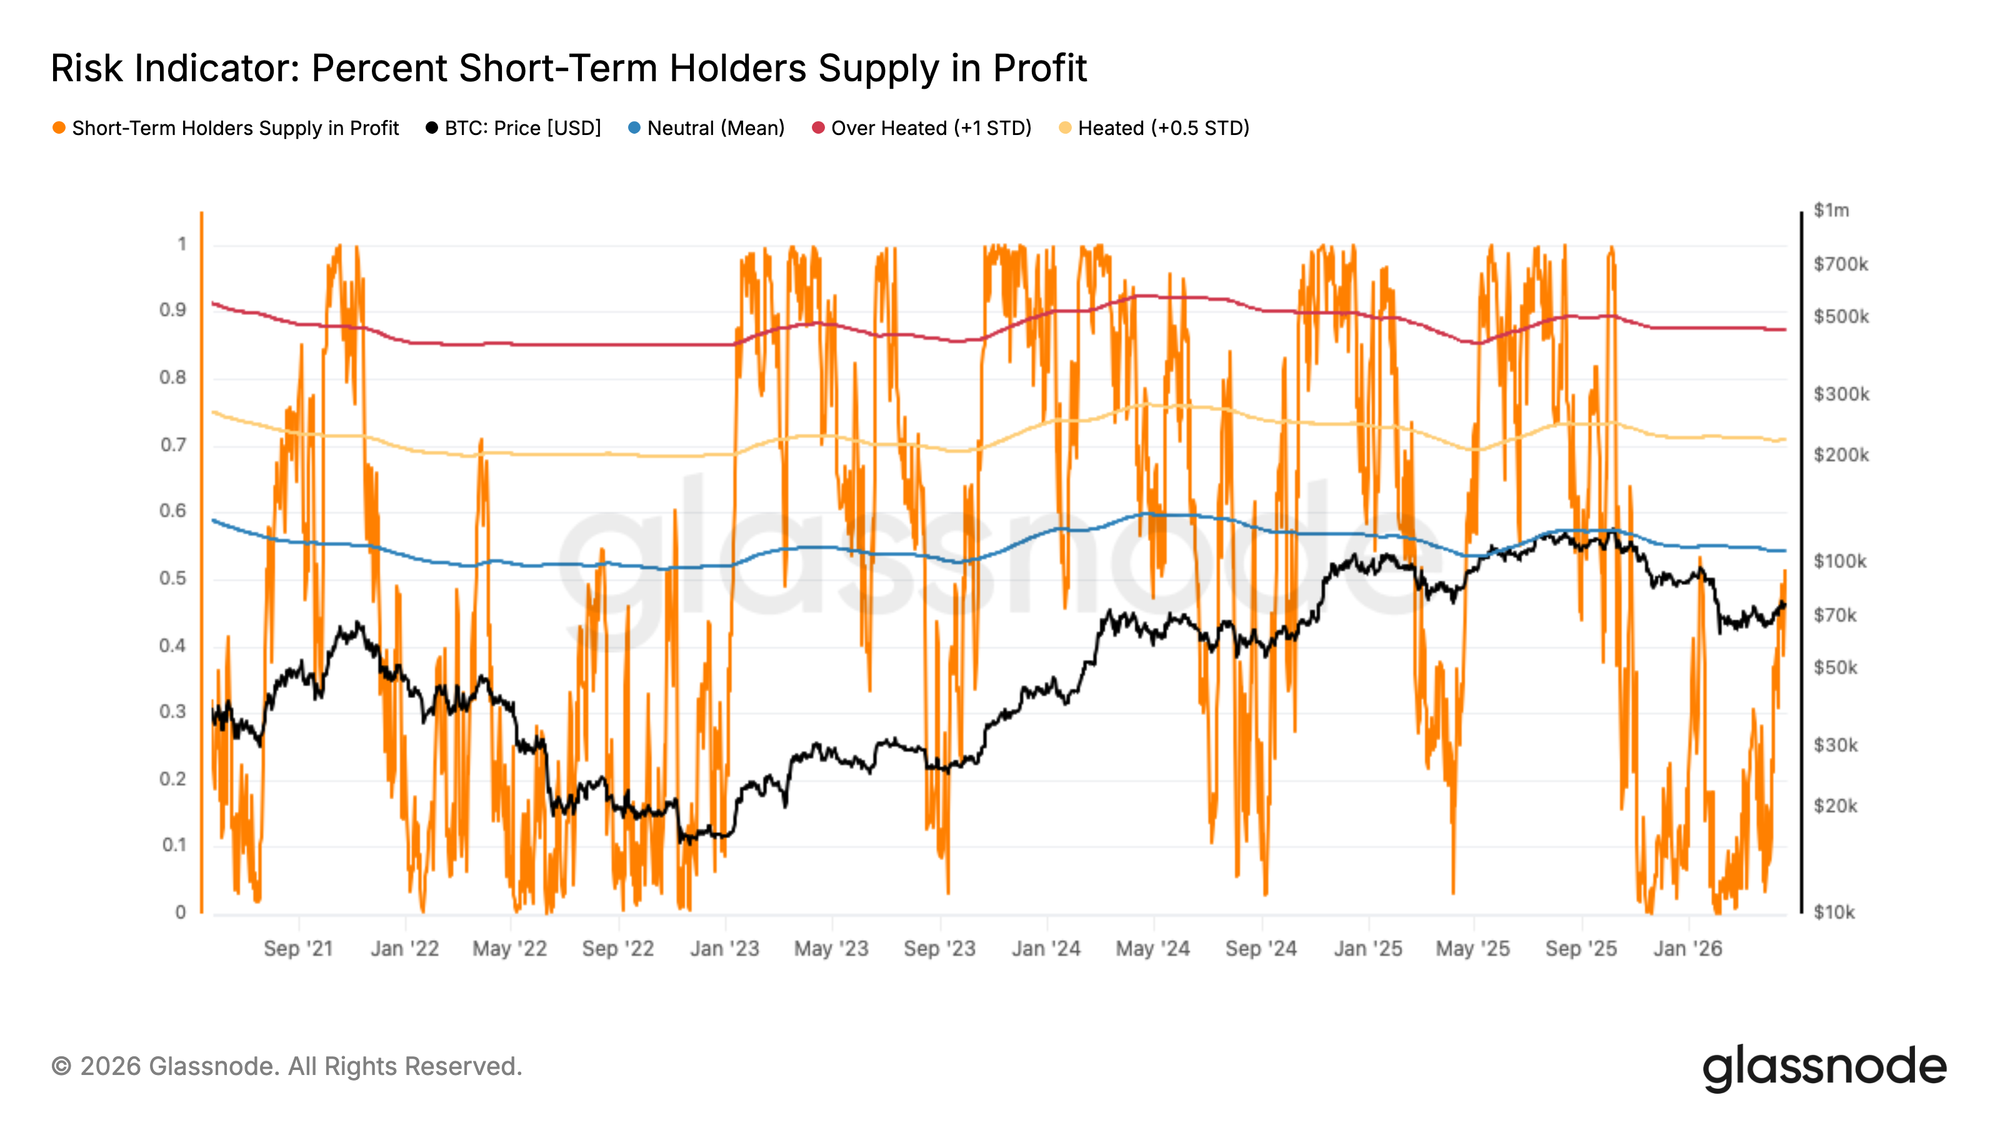
- A recovery toward $80k would push more than 54% of recent buyers into profit, historically the threshold where distribution pressure has exhausted bear market rallies, and this is the second such setup in the current cycle.
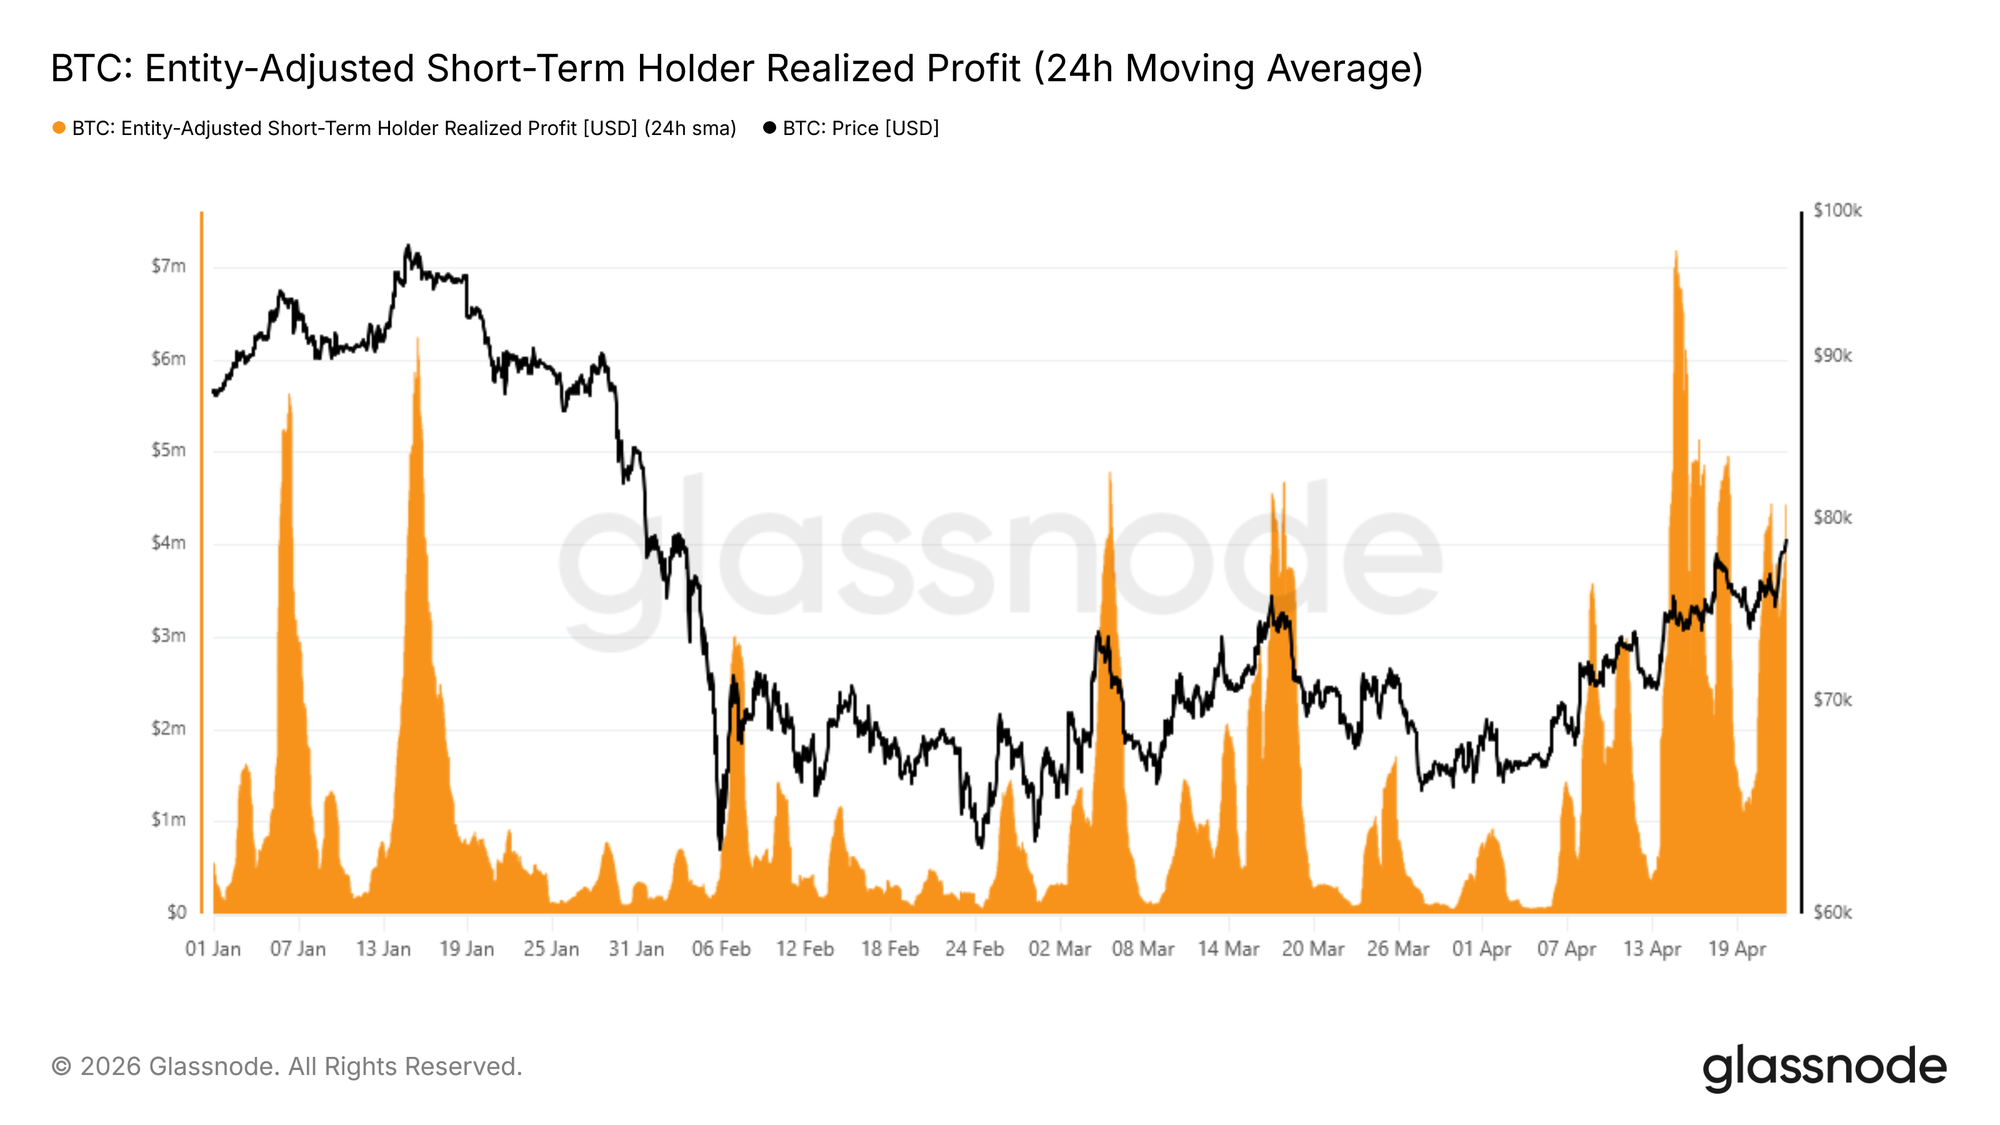
- Short-Term Holder Realized Profit has spiked to $4.4M per hour, nearly three times the $1.5M threshold that marked every local top year-to-date, signaling caution in the absence of a meaningful demand catalyst.
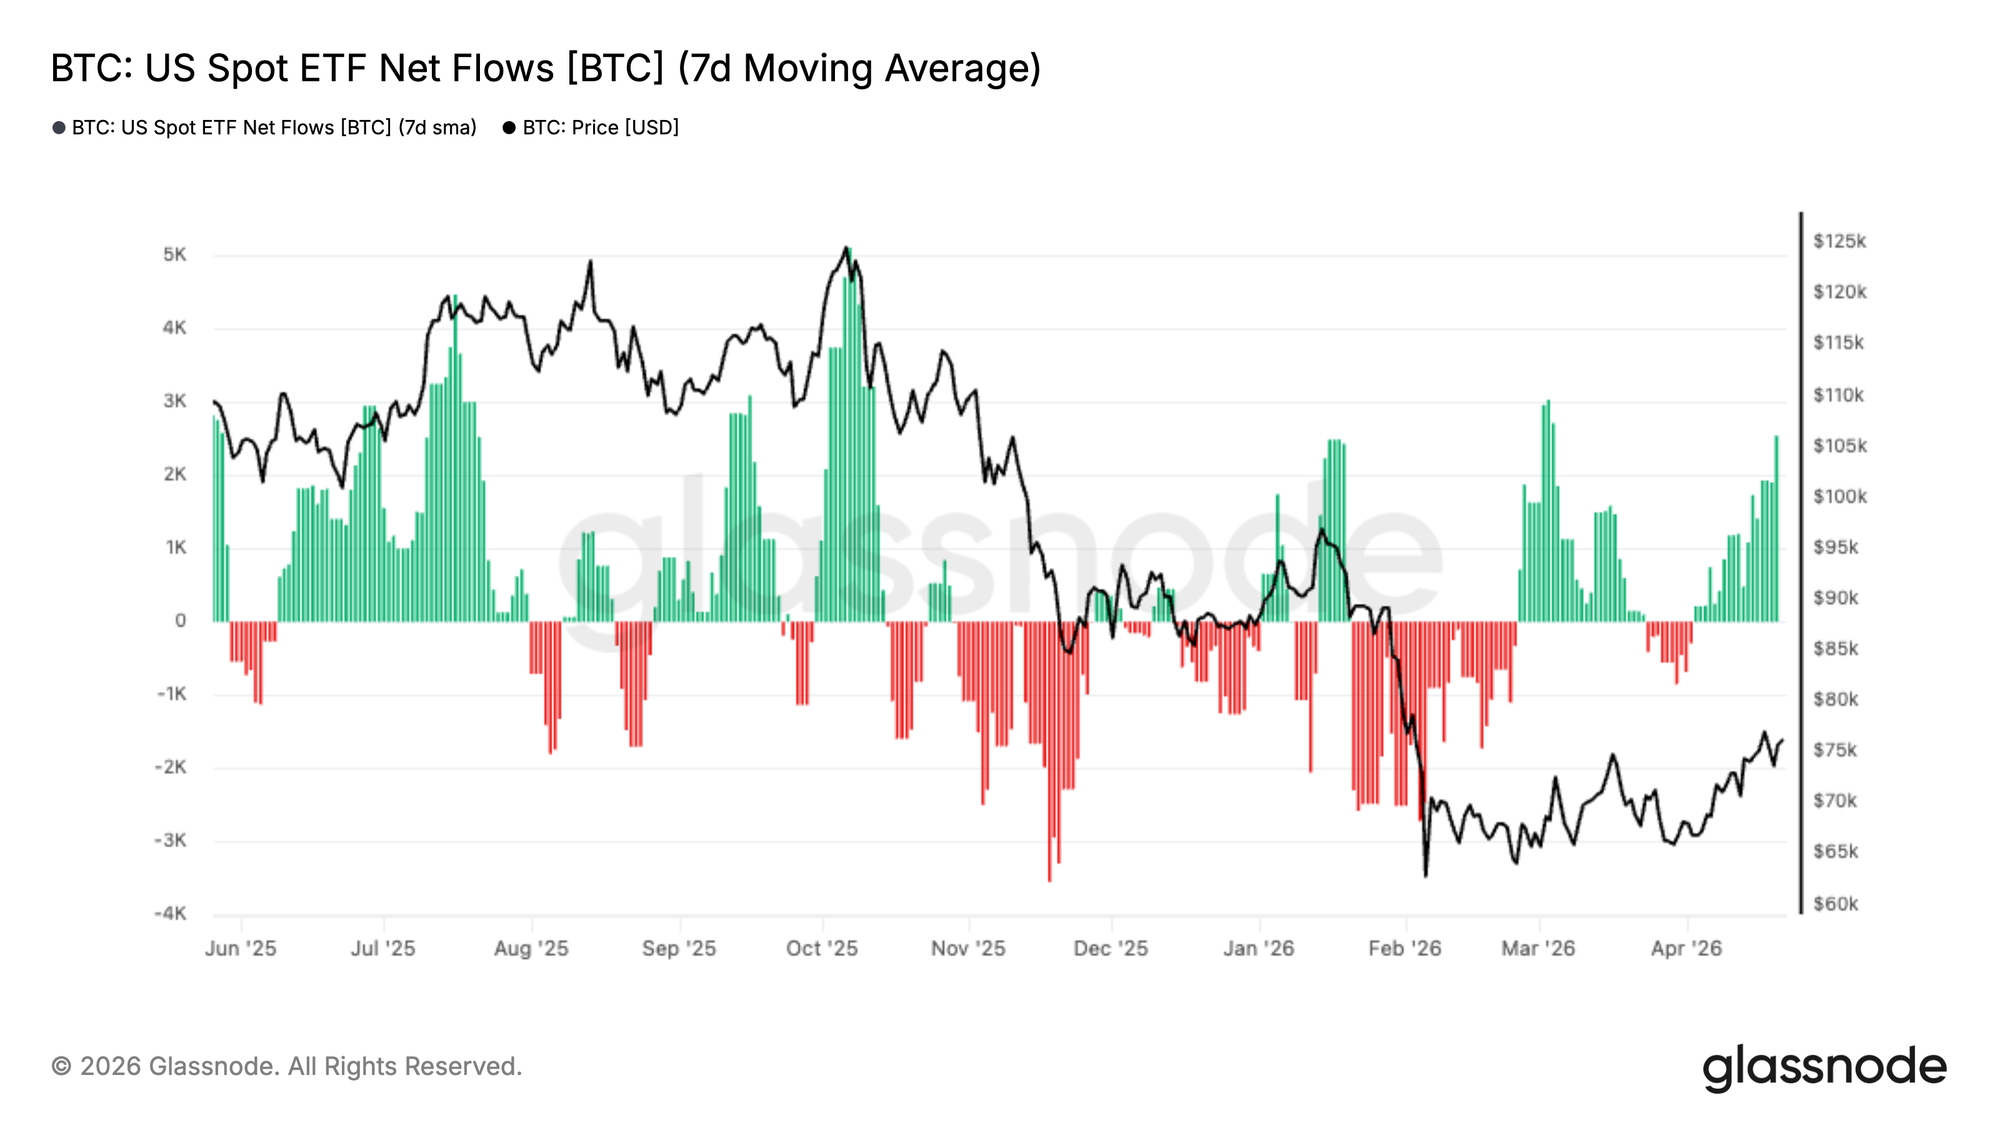
- ETF flows have turned modestly positive again, with the 7-day moving average shifting back into inflow territory, signaling a tentative return of institutional demand after a prolonged period of outflows.
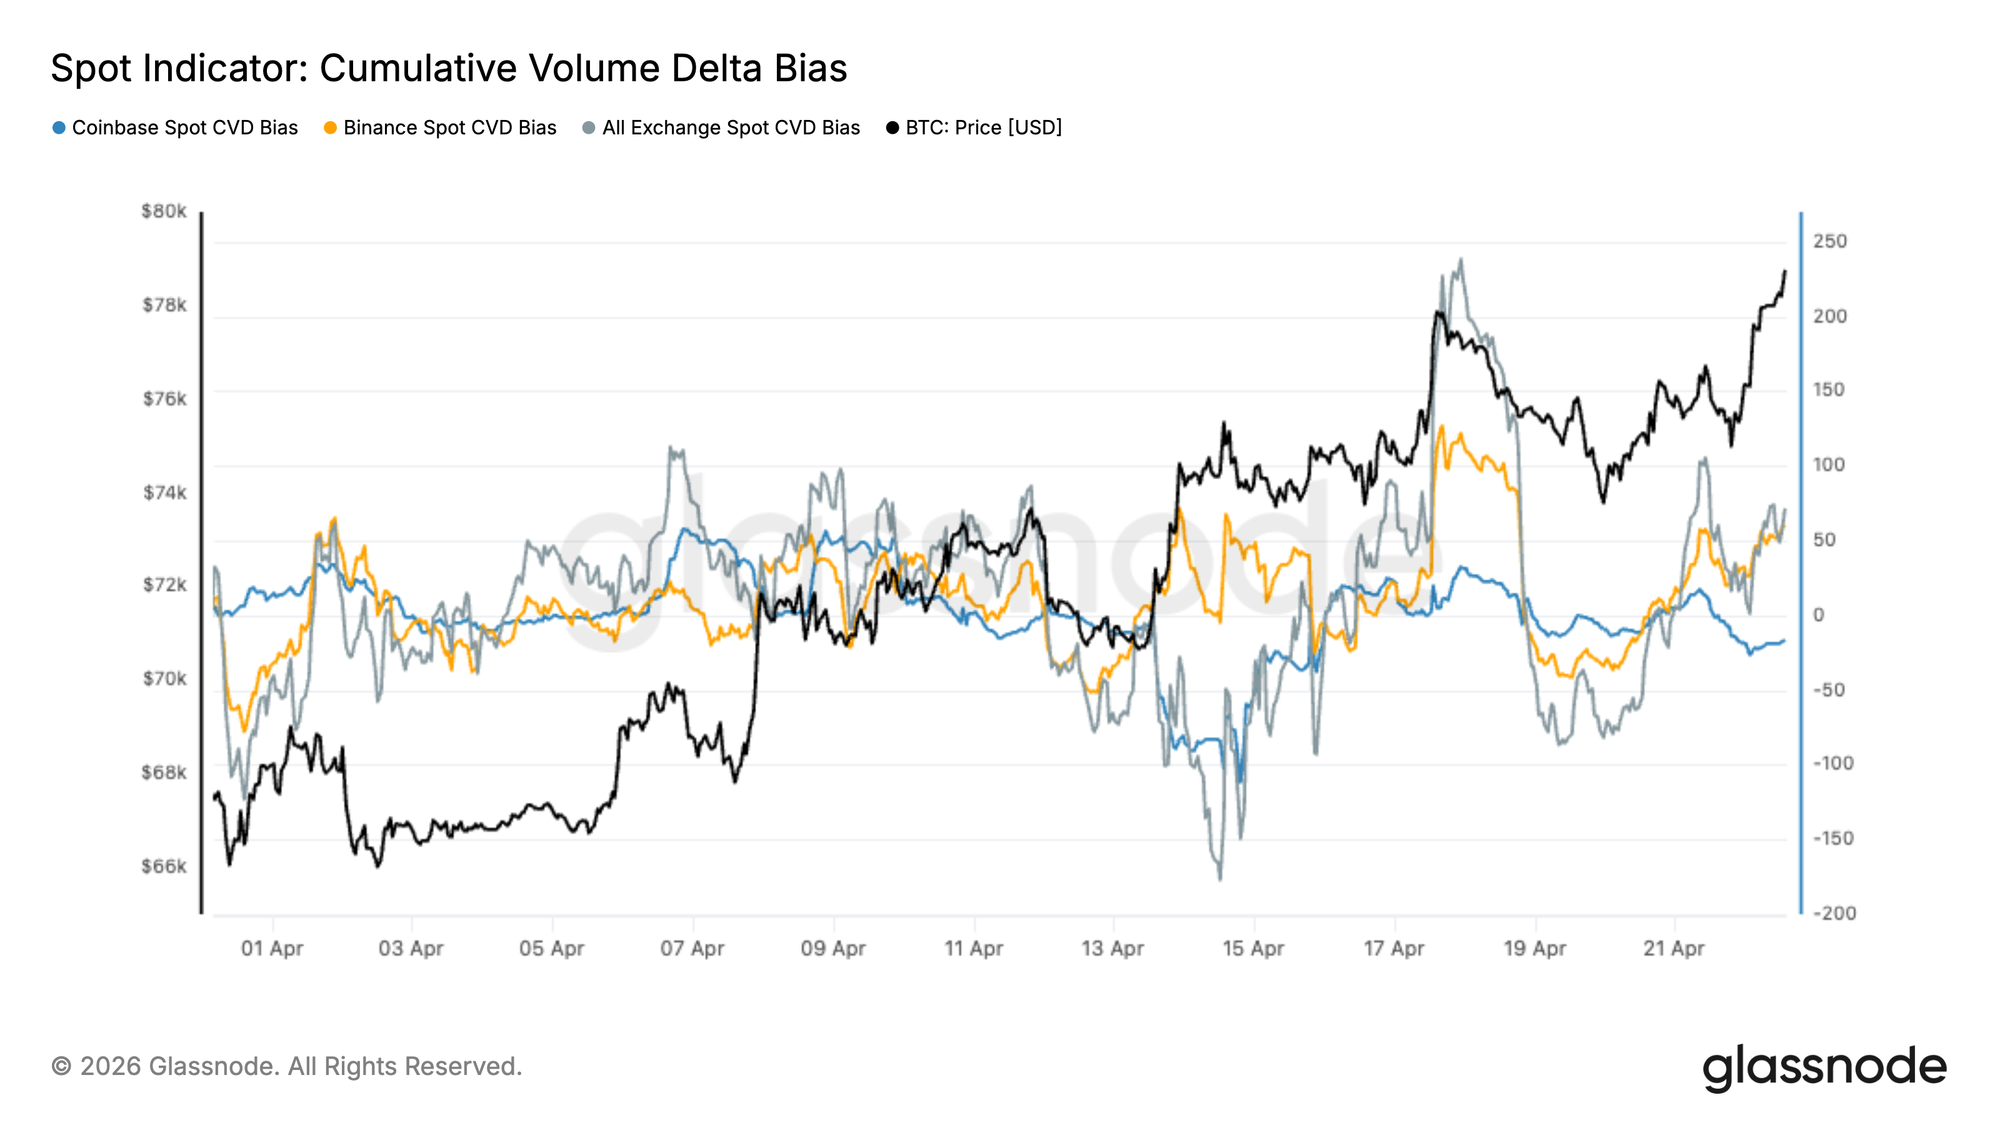
- Spot demand is showing early signs of recovery, with cumulative volume delta flipping higher and indicating renewed buyer aggression, particularly across offshore venues.
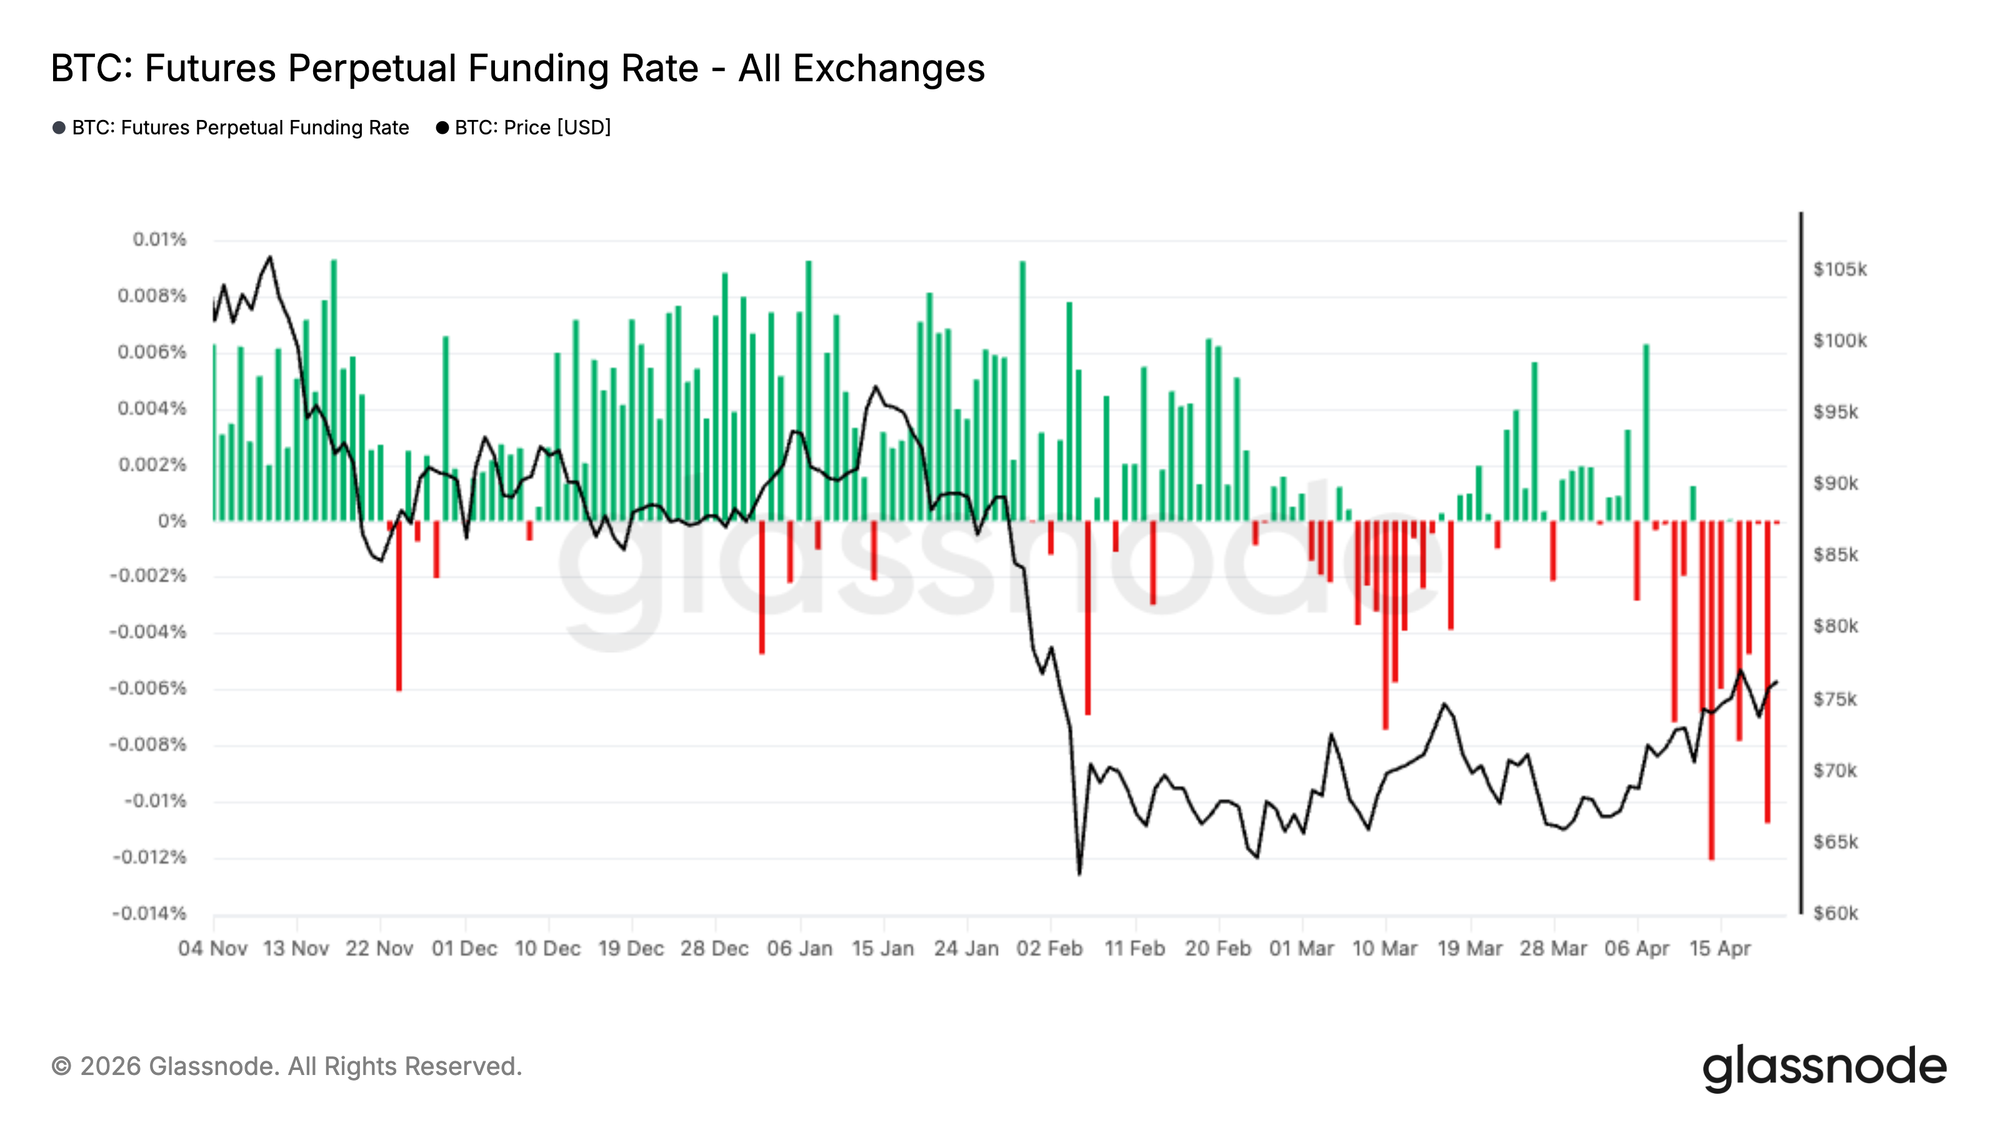
- Perpetual funding rates remain persistently negative, reflecting a market increasingly skewed toward short positioning, which may act as fuel for upside if spot demand continues to strengthen.
- Volatility remains under pressure. Implied continues to drift lower and realized confirms the compression, with no premium left in options pricing.
- Skew shows short-term positioning adjustments, but downside protection remains firmly bid further out the curve.
- Gamma and flow frame the setup: upside faces mechanical resistance near 80K, while a move back toward 75K carries higher downside acceleration risk.

On-Chain Insights
Above the Ceiling, But Not Yet Clear
Last week, this report identified the True Market Mean at $78.1k as the probable near-term resistance zone, with distribution pressure from underwater investors expected to cap any relief rally. Bitcoin has since broken above this level, a development that carries meaningful cyclical significance.
The True Market Mean tracks the cost basis of actively transacted supply, and a reclaim of this model historically marks a transition from deep bear market conditions toward a more constructive regime. This breakout represents a significant mean reversion within the ongoing bear market, with the next logical target being the Short-Term Holder Cost Basis at $80.5k.
However, mounting sell pressure from investors who accumulated within the $60k–$70k range is beginning to weigh on momentum, as this cohort approaches breakeven and faces the behavioral incentive to exit. This dynamic raises the probability of a local top formation in the near term, warranting caution despite the constructive breakout above the True Market Mean.
The Next Wall: Short-Term Holder Cost Basis
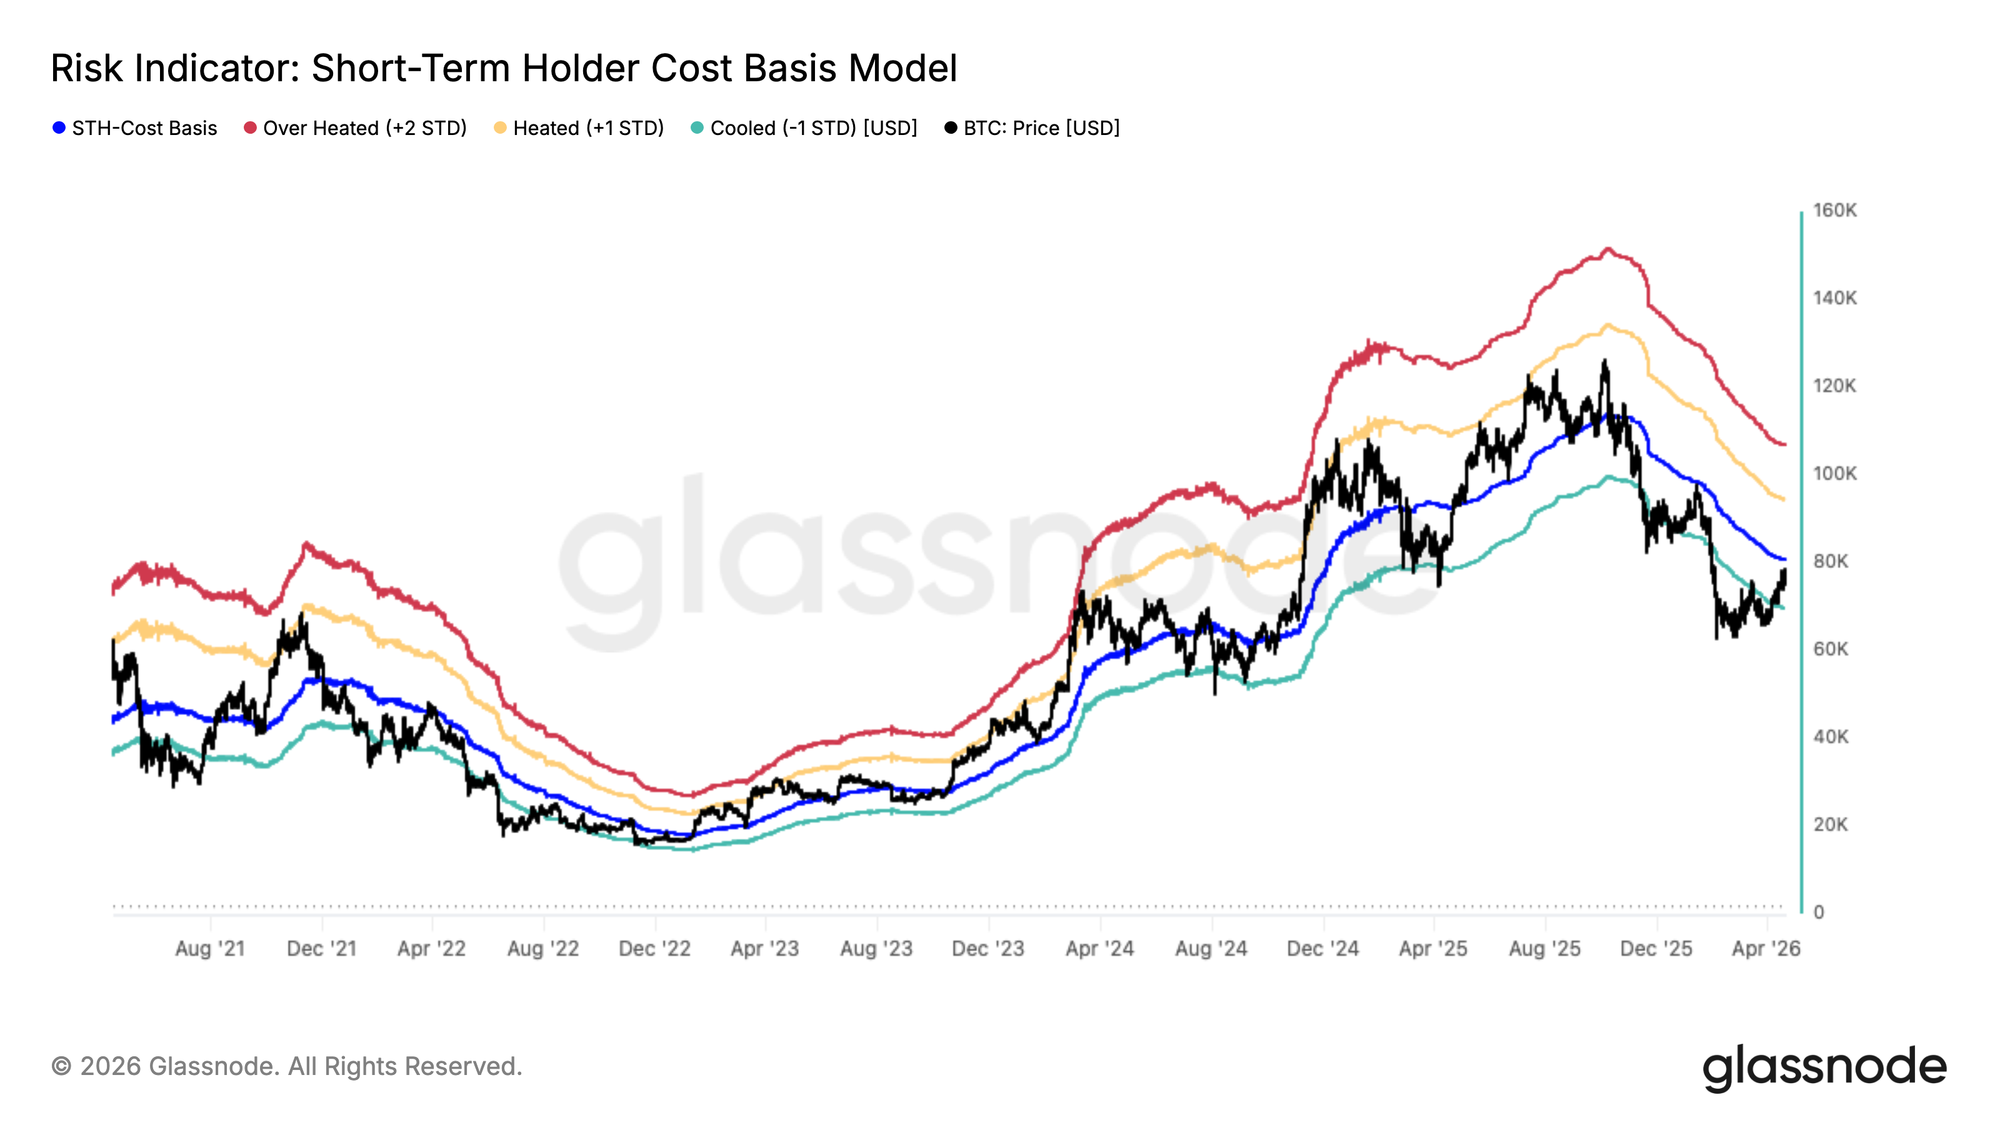
Having broken above the True Market Mean, the market now faces its next and more formidable test. The Short-Term Holder Cost Basis at $80.1k represents the average acquisition price of investors who purchased within the last 155 days, a cohort historically proven to be the most price-sensitive in the market.
As price approaches their breakeven level, the behavioral incentive to exit positions intensifies, making this zone a natural source of distribution pressure. In bear markets, rallies toward the Short-Term Holder Cost Basis have typically required multiple attempts before resolution, with price contracting back toward the -1 standard deviation lower band near $69.9k between each attempt. This pattern suggests that the $78k–$80.1k zone represents significant near-term resistance, while $70k is increasingly assuming the role of a developing mid-term support floor as the market works through this overhead supply.
Where Bear Rallies Exhaust
With the Short-Term Holder Cost Basis at $80.1k marking the immediate resistance ceiling, the Percent of Short-Term Holder Supply in Profit provides a complementary lens that explains precisely why this level carries such behavioral significance. This metric measures the share of recently acquired supply currently held at an unrealized gain, and a reading above 54% has historically coincided with peak distribution pressure during bear market rallies, as the concentration of profitable short-term holders becomes sufficient to overwhelm incoming demand. A recovery toward the $80k zone would simultaneously push this indicator above its statistical mean of 54%, triggering a wave of profit realization from recent buyers seizing the opportunity to exit near breakeven. Notably, this is not an isolated occurrence in the current cycle; this is the second instance of this structure forming, with a comparable setup having already played out earlier in this bear market. Repeated encounters with this threshold reinforce its reliability as a local top indicator.
Profit Taking Spikes Confirm the Warning
Reinforcing the exhaustion signals discussed above, real-time spending behavior by short-term holders is now corroborating the structural picture. As price re-tests the Short-Term Holder Cost Basis for the second time since mid-January, pushing more than 50% of recent buyers back into profit, the 24-hour SMA of Short-Term Holder Realized Profit Volume has spiked above $4.4M per hour.
This reading is particularly telling when placed in year-to-date context: every prior spike above $1.5M per hour has coincided with a local top formation, making the current reading nearly three times that historical warning threshold.
In the absence of a meaningful demand catalyst capable of absorbing this wave of profit realization and sustaining momentum above the Short-Term Holder Cost Basis, a pullback from current levels would be entirely consistent with the pattern this report has outlined. The signals, taken together, point toward caution rather than conviction at this juncture.
Off-Chain Insights
ETF Flows Turn Positive Again
US Spot ETF flows have begun to recover, with the 7-day moving average shifting back into positive territory after a prolonged period of sustained outflows. This marks a notable change in institutional demand, following heavy distribution throughout late January and February.
The recent inflow clusters suggest renewed allocation from traditional investors, coinciding with Bitcoin’s rebound from the ~$65K lows into the mid-$70Ks. While the magnitude of inflows remains below the peaks observed in late 2025, the directional shift is significant, indicating that institutional appetite is beginning to return.
From a structural perspective, ETFs remain a key marginal buyer in the market. A sustained period of positive flows would provide a strong demand base, helping to absorb sell-side pressure and reinforce price strength. However, consistency will be key, as prior rallies have struggled to hold when ETF demand fades.
Spot Demand Returns
Spot CVD bias has shown a notable shift toward buyer dominance in recent sessions, with a clear uptick in cumulative volume delta across major exchanges. This suggests that recent price strength has been supported by genuine spot demand, rather than purely derivatives-driven flows.
Exchange-level dynamics reveal some divergence under the surface. Binance spot CVD has led much of the recent buying pressure, while Coinbase activity has remained comparatively muted, pointing to a stronger participation from offshore or retail-driven flows. However, the aggregate CVD trend across all exchanges has turned positive, reinforcing the view that buyers are stepping in with conviction.
Importantly, this renewed spot demand has coincided with a push higher in price, indicating a more constructive market structure than prior rallies which lacked underlying volume support. If sustained, this shift in spot positioning could provide a more durable foundation for further upside, especially when viewed alongside the growing short bias in derivatives markets.
Shorts Build as Funding Stays Negative
Perpetual funding rates have shifted decisively lower in recent weeks, with sustained prints in negative territory across most major exchanges. This marks a clear transition from the predominantly positive regime observed through November and December, where long positioning dominated and traders were willing to pay a premium to maintain exposure.
The current structure reflects a market increasingly skewed toward short positioning, with participants positioning defensively following the sharp drawdown into early February. Notably, the persistence of negative funding through March and into April suggests this is not a fleeting sentiment shift, but rather a more entrenched bias toward downside hedging and speculative short exposure.
From a positioning standpoint, this creates a constructive backdrop. Crowded short positioning can act as fuel for upside moves, particularly if spot demand re-emerges or macro conditions stabilize. However, in the absence of strong directional flows, this imbalance may instead reflect a market that remains cautious.
Implied Volatility Continues to Drift Lower
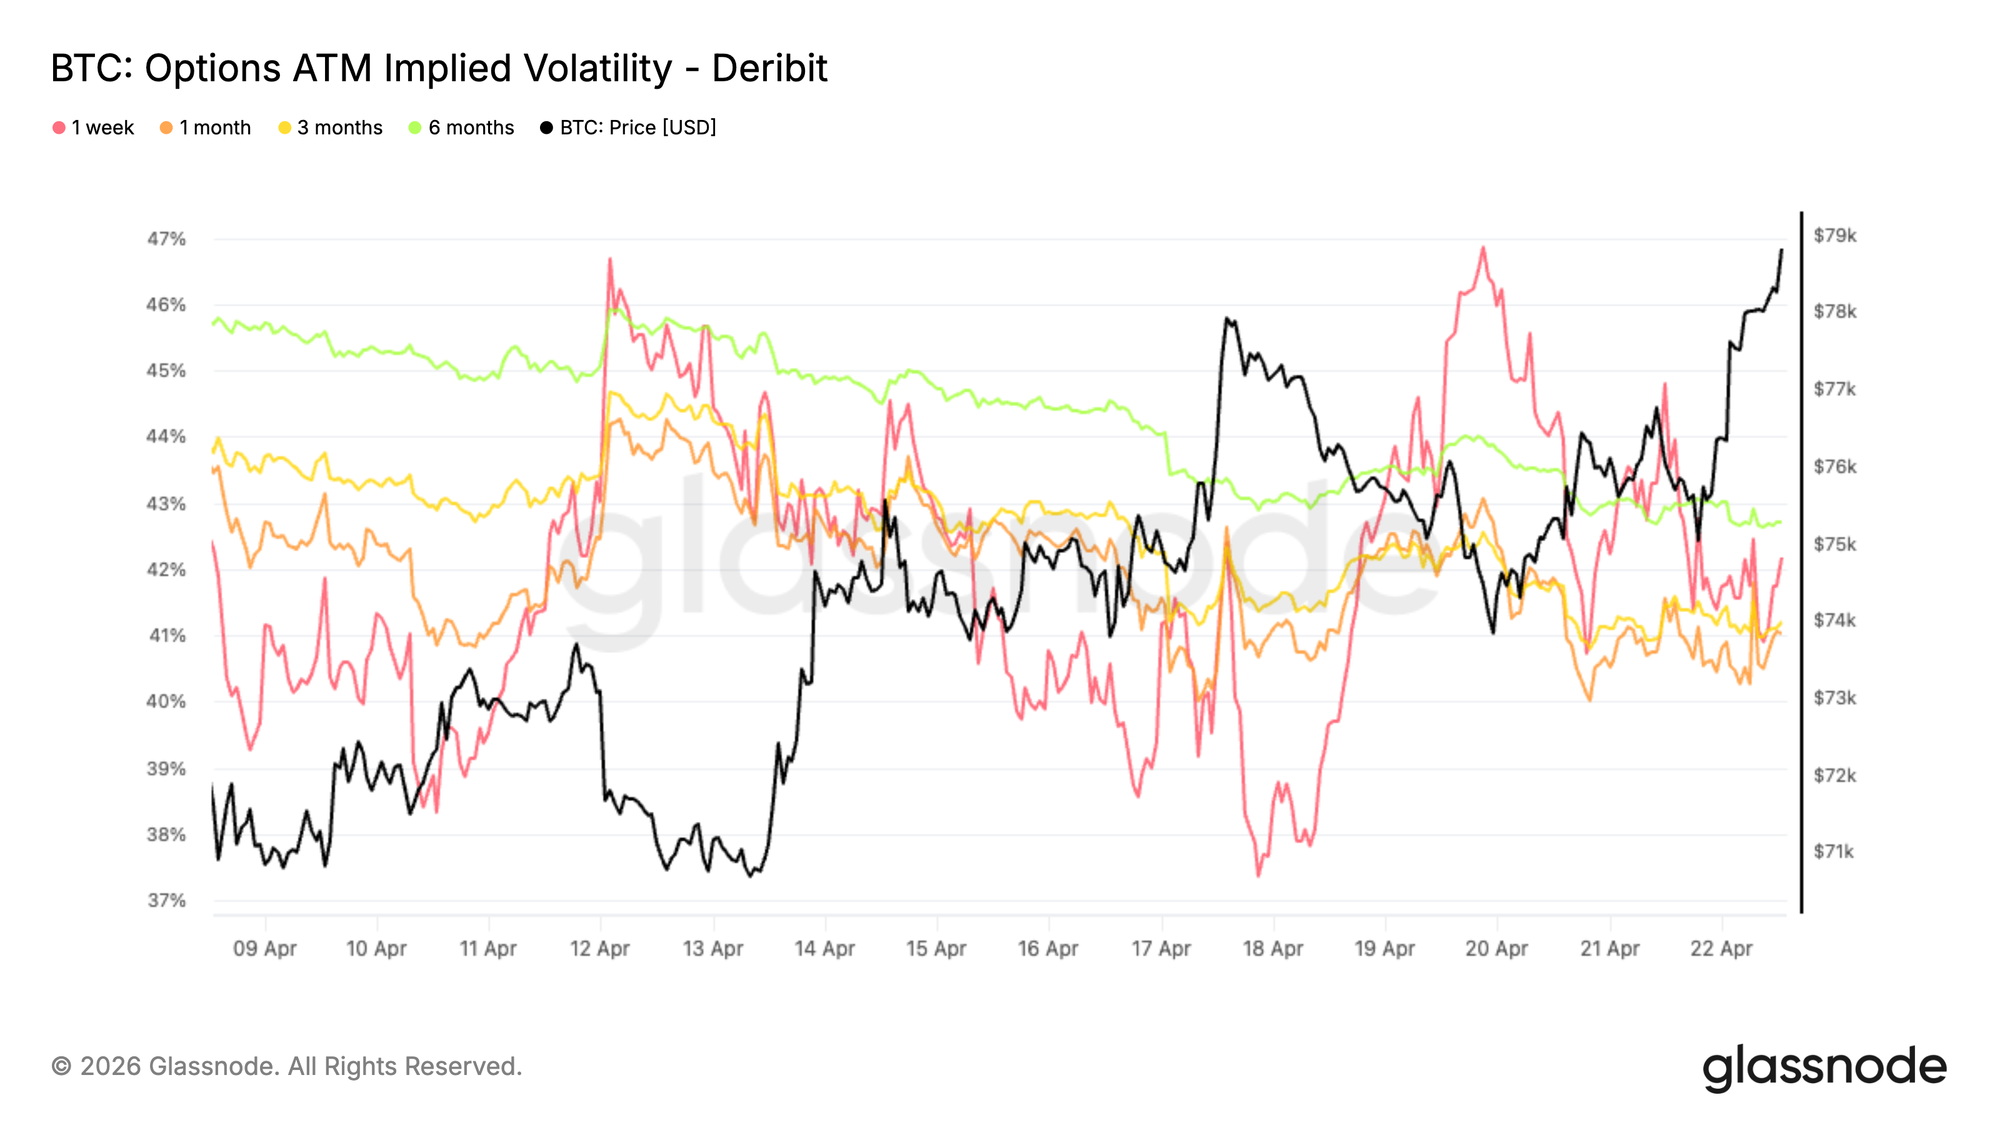
Starting with implied volatility, the dominant move remains to the downside across the curve. The 1 month, 3 month, and 6 month tenors have been grinding lower over the past two weeks, reflecting a steady compression in volatility expectations.
The 1 week has been more reactive, with a few sharp spikes toward 46%, but these moves have not held and have quickly faded back into the broader downtrend. This suggests the market is not willing to sustain a bid for short-term protection. Instead, volatility is being consistently sold across maturities.
Even as price trends higher, implied volatility fails to expand, pointing to a lack of urgency in hedging and limited chasing to the upside. The overall structure remains soft, with no clear sign of a broader volatility regime shift, just a continuation of sellers leaning on the surface.
Realized Volatility Confirms the Compression
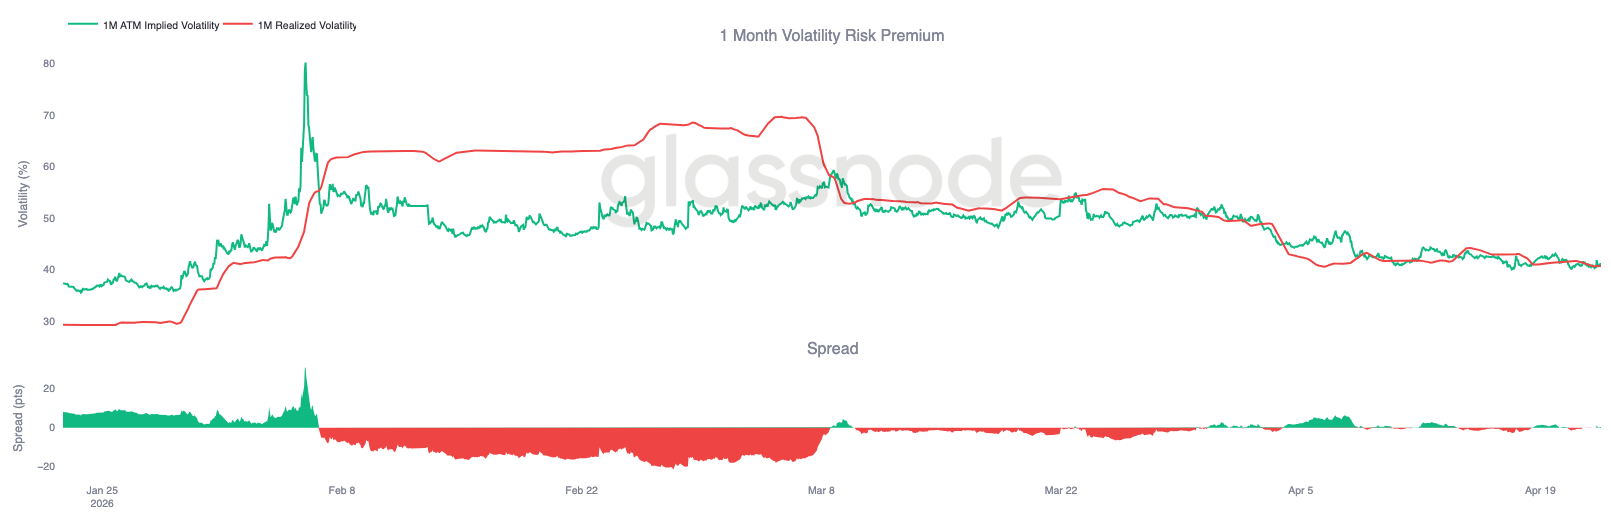
Following the steady selling in implied volatility, realized volatility is moving in the same direction and reinforcing the trend.
Bitcoin’s 30 day realized volatility now stands at 40.7%, down from 49% at the start of April, with price action remaining contained and showing limited follow-through. This matters because realized volatility anchors how options should be priced. When realized stays low, it becomes difficult for implied volatility to sustain any upside, as there is no stress in the underlying to justify higher premiums.
This is clearly reflected in the volatility risk premium, which now sits around zero, meaning implied volatility is no longer pricing any meaningful premium over realized. Options are being priced in line with what has already happened, not what could happen.
The combination of low realized moves and steady vol selling keeps the overall environment soft, with no pressure for volatility to reprice higher.
Short-Term Skew Swings, Broader Structure Holds
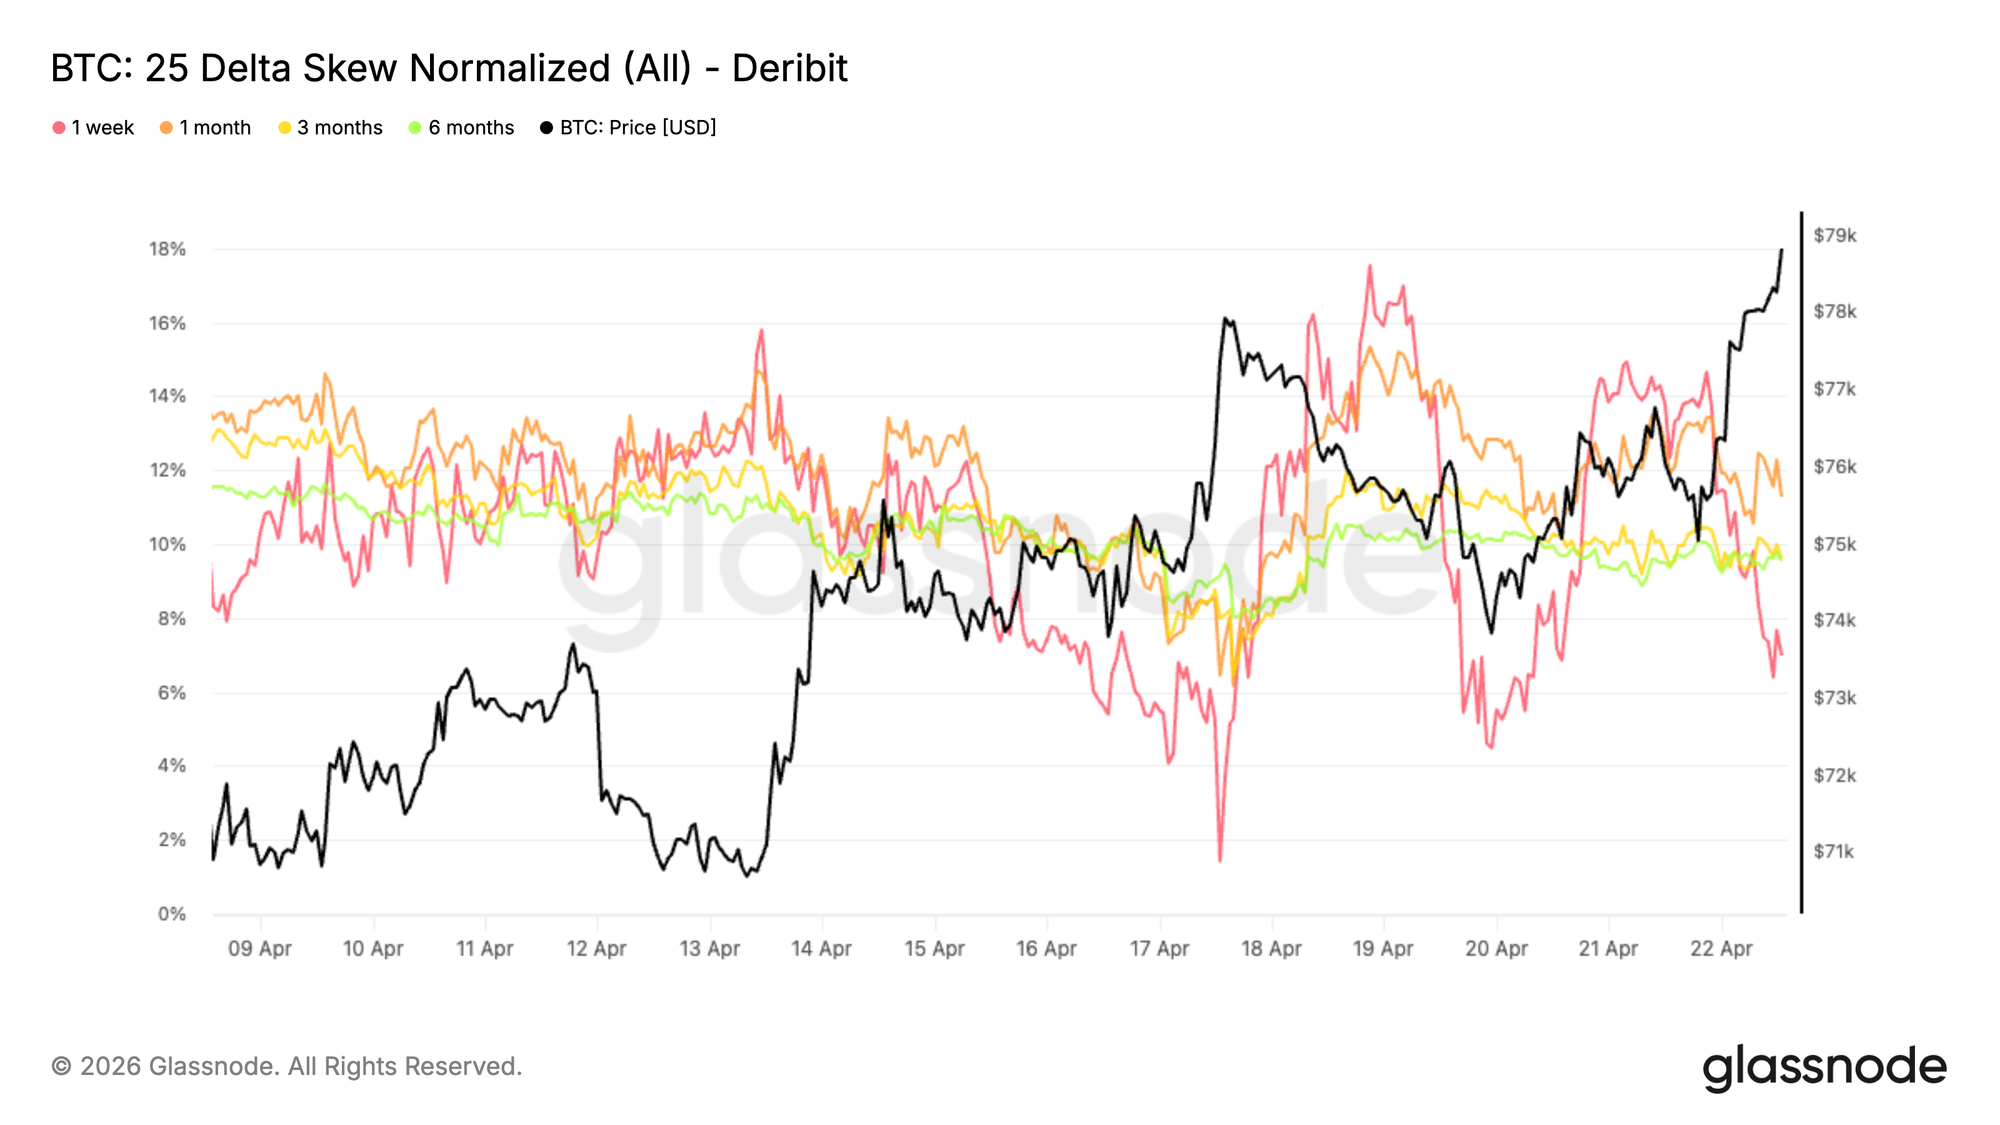
Skew adds more nuance to the picture. The 25 delta skew, calculated as put minus call implied volatility, saw a sharp move in the front end on Friday, with the 1 week put premium collapsing toward 2% before rebounding back above 7% over the weekend.
This quick round trip highlights how reactive short-dated positioning remains. In contrast, the 1 month, 3 month, and 6 month tenors have stayed relatively stable over the past two weeks, holding around 10% to 12%, and continue to reflect a firm bid for downside protection. This divergence suggests the move was driven by short-term positioning rather than a broader shift in sentiment.
The temporary drop points to a brief unwind of near-term hedges, but the fast recovery shows that demand for protection has not disappeared. The market is adjusting tactically in the front end, while maintaining a cautious stance further out the curve.
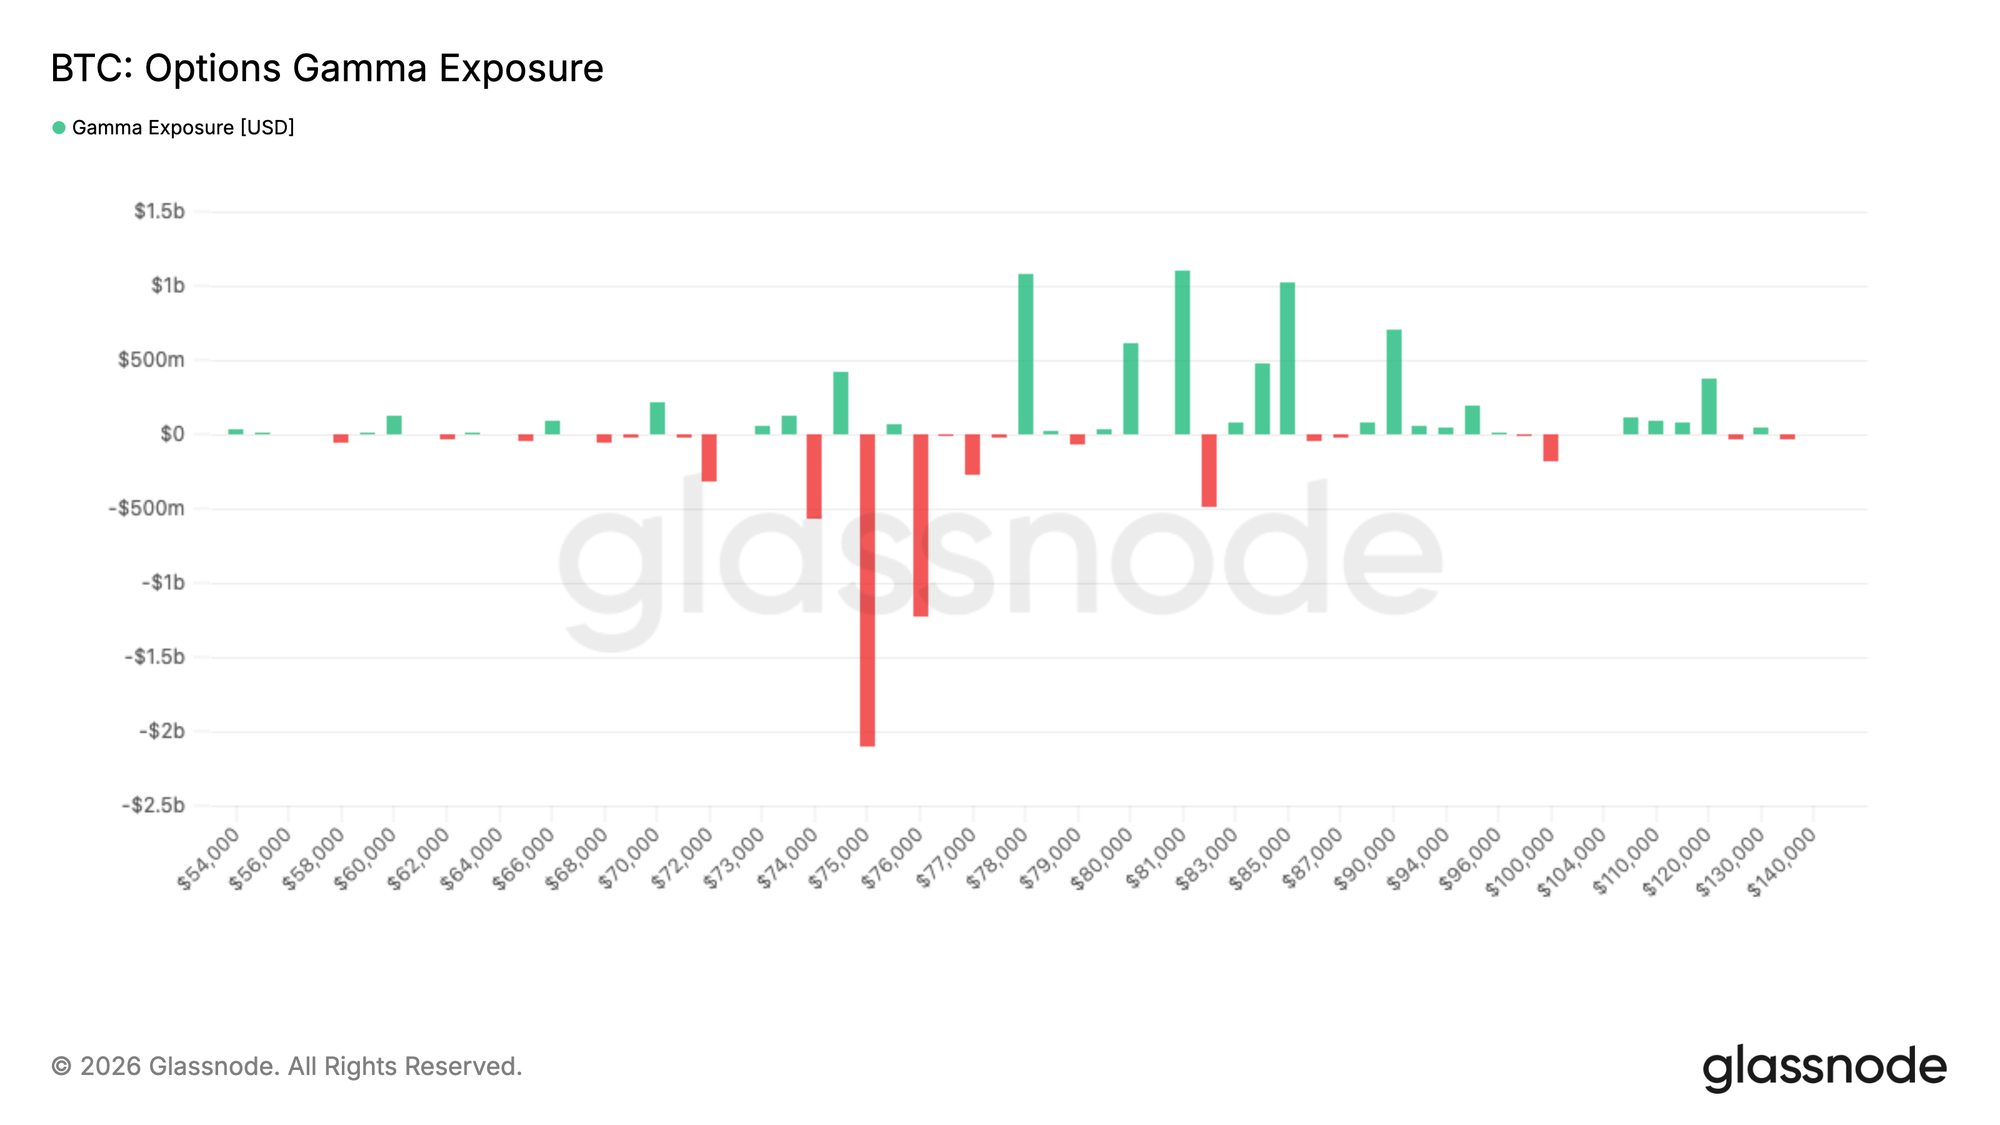
Gamma Positioning Frames Near-Term Resistance and Downside Risk
The positioning picture becomes clearer when looking at dealer gamma. A large concentration of negative gamma sits below the current price, particularly in the 75K region, where exposure reaches its most extreme levels.
With Bitcoin now trading around 79K, price is sitting above this zone, while the immediate upside shifts into a long gamma area. In this regime, hedging flows tend to dampen moves to the upside, creating a form of mechanical resistance as dealers sell into strength. However, the risk sits below. A move back toward the mid 75K region would bring price into the short gamma zone, where dealers hedge can accelerate downside price action.
Recent flow adds an important nuance. Over the past 7 days, call buying has led activity, pointing to a market positioning for upside. But in the last 24 hours, as spot approaches 80K, the flow has shifted toward call selling, suggesting that upside is now being monetized rather than chased.
Conclusion
Bitcoin’s move back above the True Market Mean marks an important shift in market structure, with price reclaiming a key cost basis level that often defines the boundary between bearish and constructive regimes. This recovery is now being supported by improving spot demand and a tentative return of ETF inflows, suggesting that both retail and institutional participation are beginning to re-engage.
At the same time, derivatives positioning paints a more cautious picture. Persistent negative funding highlights a growing short bias, which can act as fuel for upside if demand continues to build. However, elevated realized profits and a lack of volatility premium indicate that conviction remains fragile, with traders still hesitant to aggressively position for continuation.
Taken together, the market appears to be transitioning into a more constructive phase, but one that still requires confirmation. A sustained push through the $80K level would likely depend on continued spot absorption and consistent ETF demand, while failure to hold current levels could see downside moves accelerate given the relatively thin liquidity environment.
Disclaimer: This report does not provide any investment advice. All data is provided for informational and educational purposes only. No investment decision shall be based on the information provided here, and you are solely responsible for your own investment decisions.
Exchange balances presented are derived from Glassnode’s comprehensive database of address labels, which are amassed through both officially published exchange information and proprietary clustering algorithms. While we strive to ensure the utmost accuracy in representing exchange balances, it is important to note that these figures might not always encapsulate the entirety of an exchange’s reserves, particularly when exchanges refrain from disclosing their official addresses. We urge users to exercise caution and discretion when utilizing these metrics. Glassnode shall not be held responsible for any discrepancies or potential inaccuracies.