Risk-Off Capital Rotation
While digital asset prices have remained stagnant in recent months, several indicators point towards a risk-off rotation of capital taking place beneath the surface. Volumes have dried up, and investors are increasingly expressing a preference for stablecoin capital.


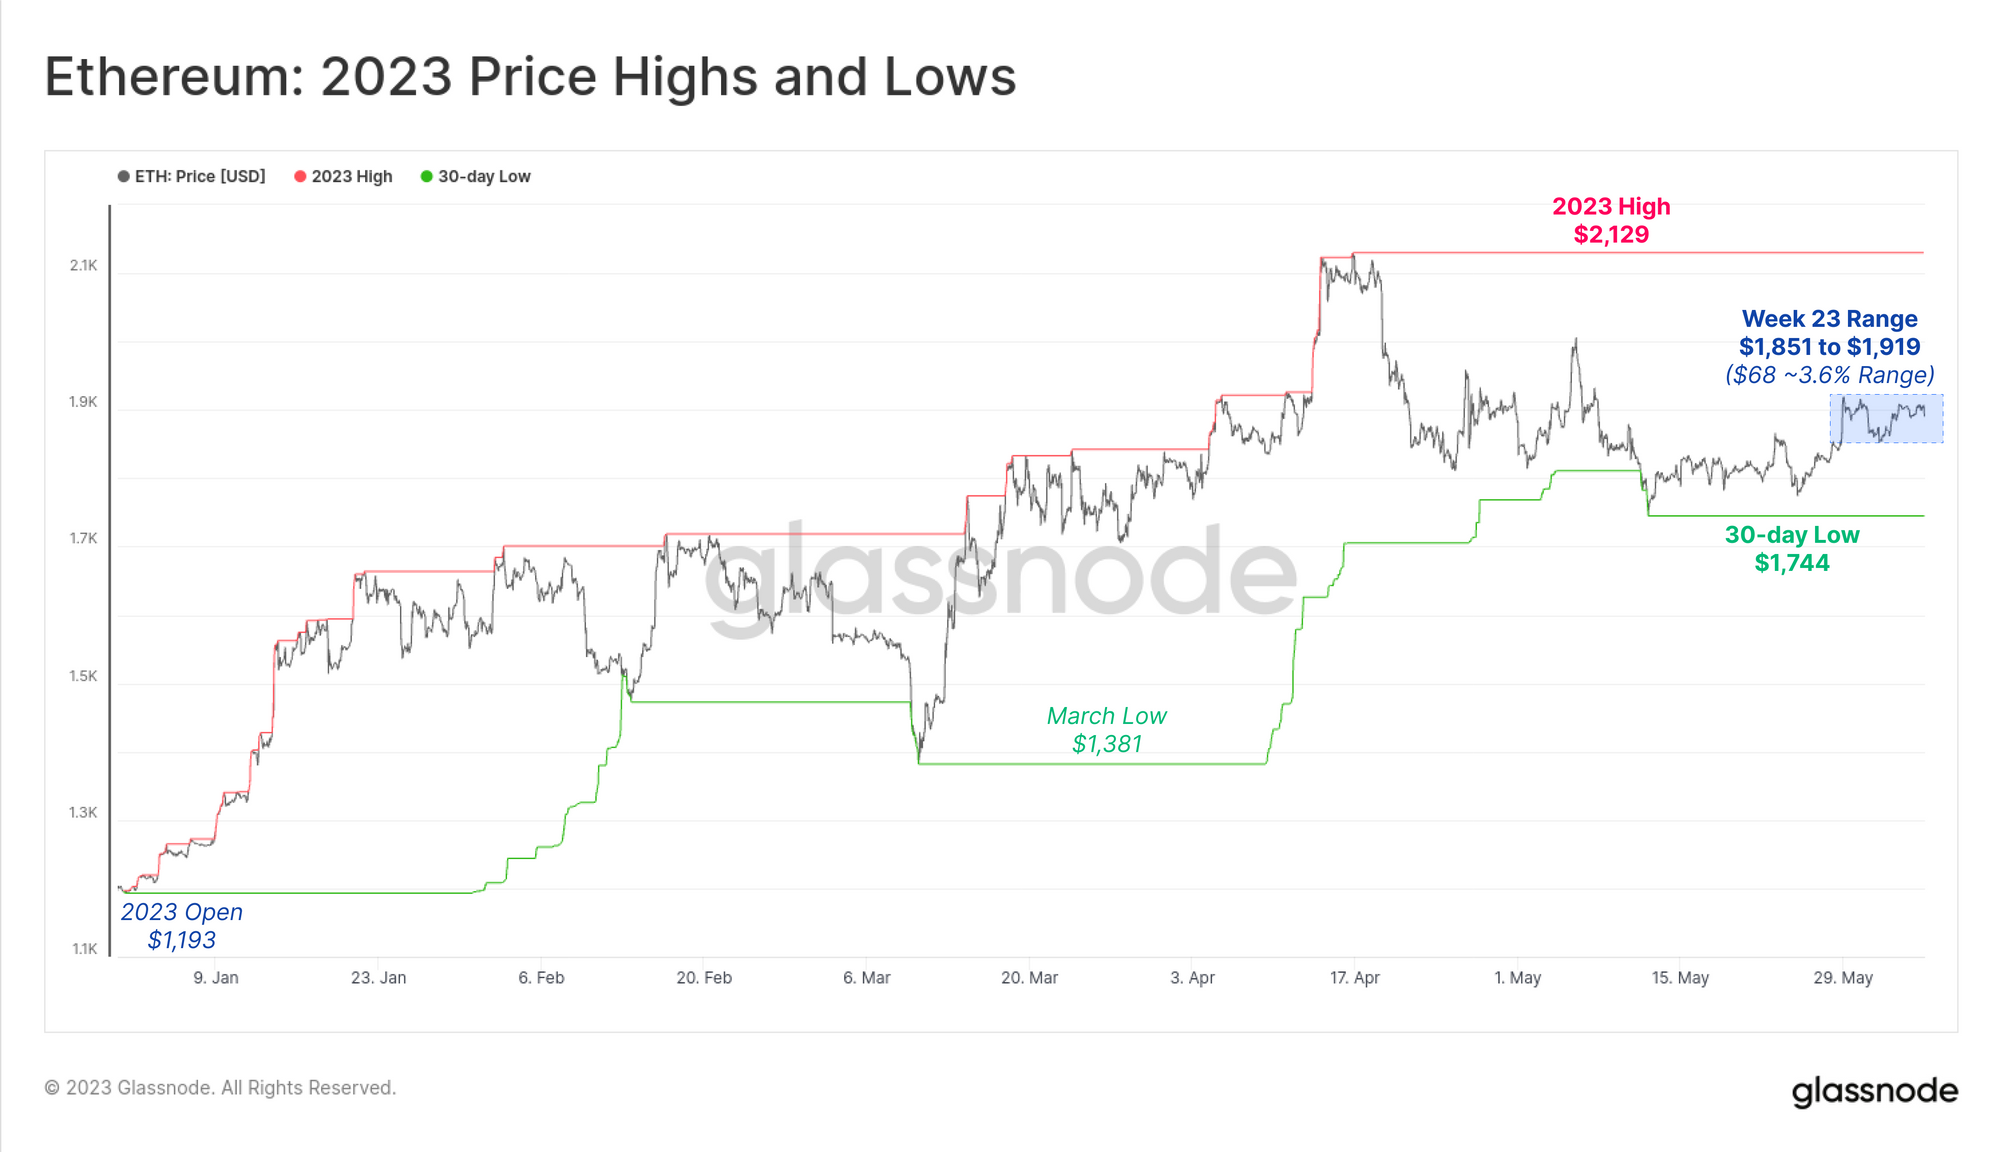
The quiet and calm persists in digital asset markets, with the price of ETH remaining confined to a $68 range this week (3.6%), trading between a low of $1,861 and a high of $1,931. Aside from a small surge in ETH markets following the Shanghai upgrade, ETH prices have been more or less flat since mid March.
As the market grinds sideways, there are growing divergences in market preference occurring beneath the surface, many hinting at a risk-off environment. Trade volumes remain depressed, DeFi usage has becoming increasingly automated, and a market preference is growing for stablecoins, specifically for Tether (USDT).
In this edition, we will explore these developing undercurrents, and how we can observe them through on- and off-chain data.
Automated Arbitrage
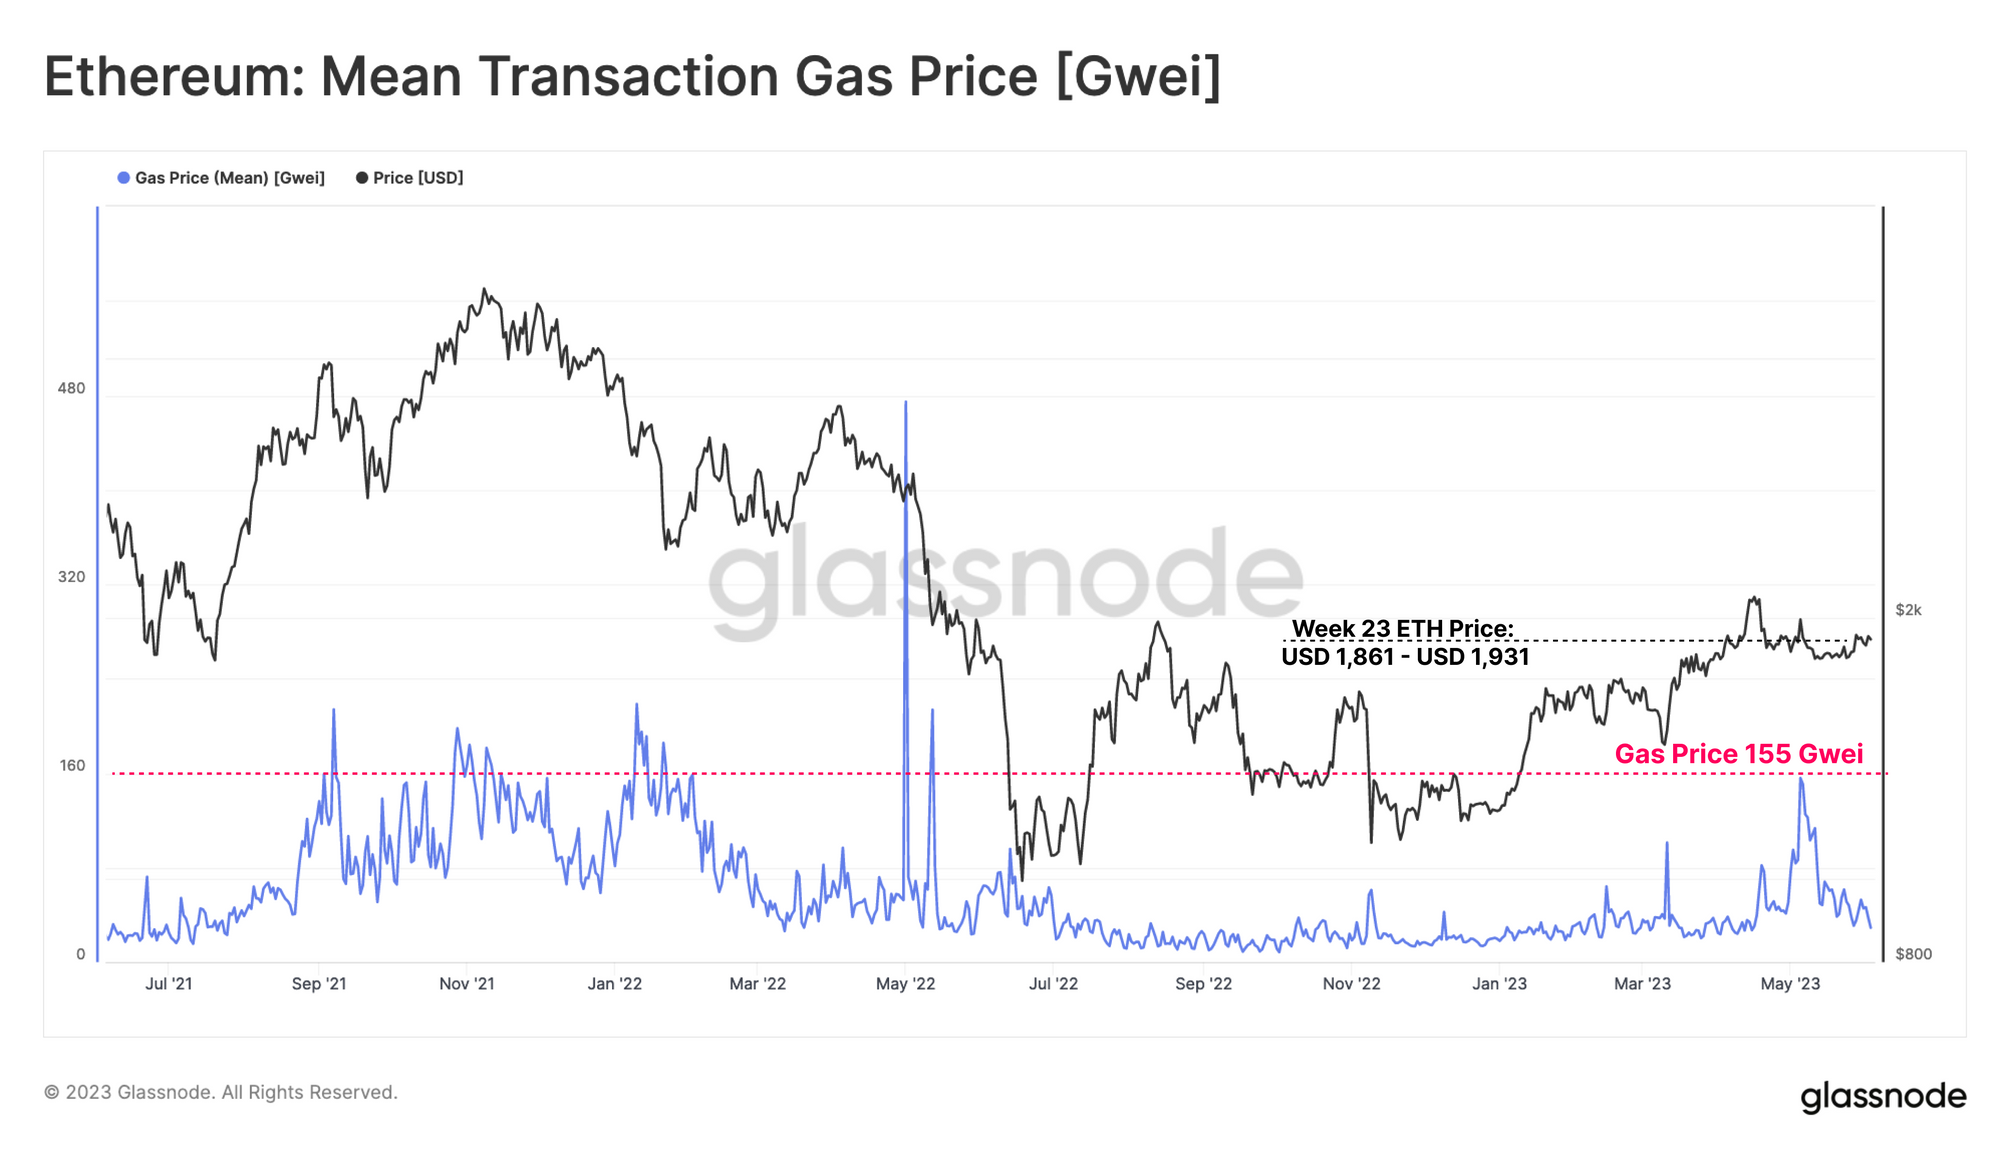
Whilst ETH prices have remained relatively flat and range-bound since March, gas prices did experience a non-trivial uptick in the month of May. Gas prices increased to an average gas price of 76 Gwei, equating to $1.14 for a regular ETH transfer transaction. Mean gas price reached over 155 Gwei in early May ($6.53 per ETH transfer), which is almost as high as during the 2021-22 bull cycle.
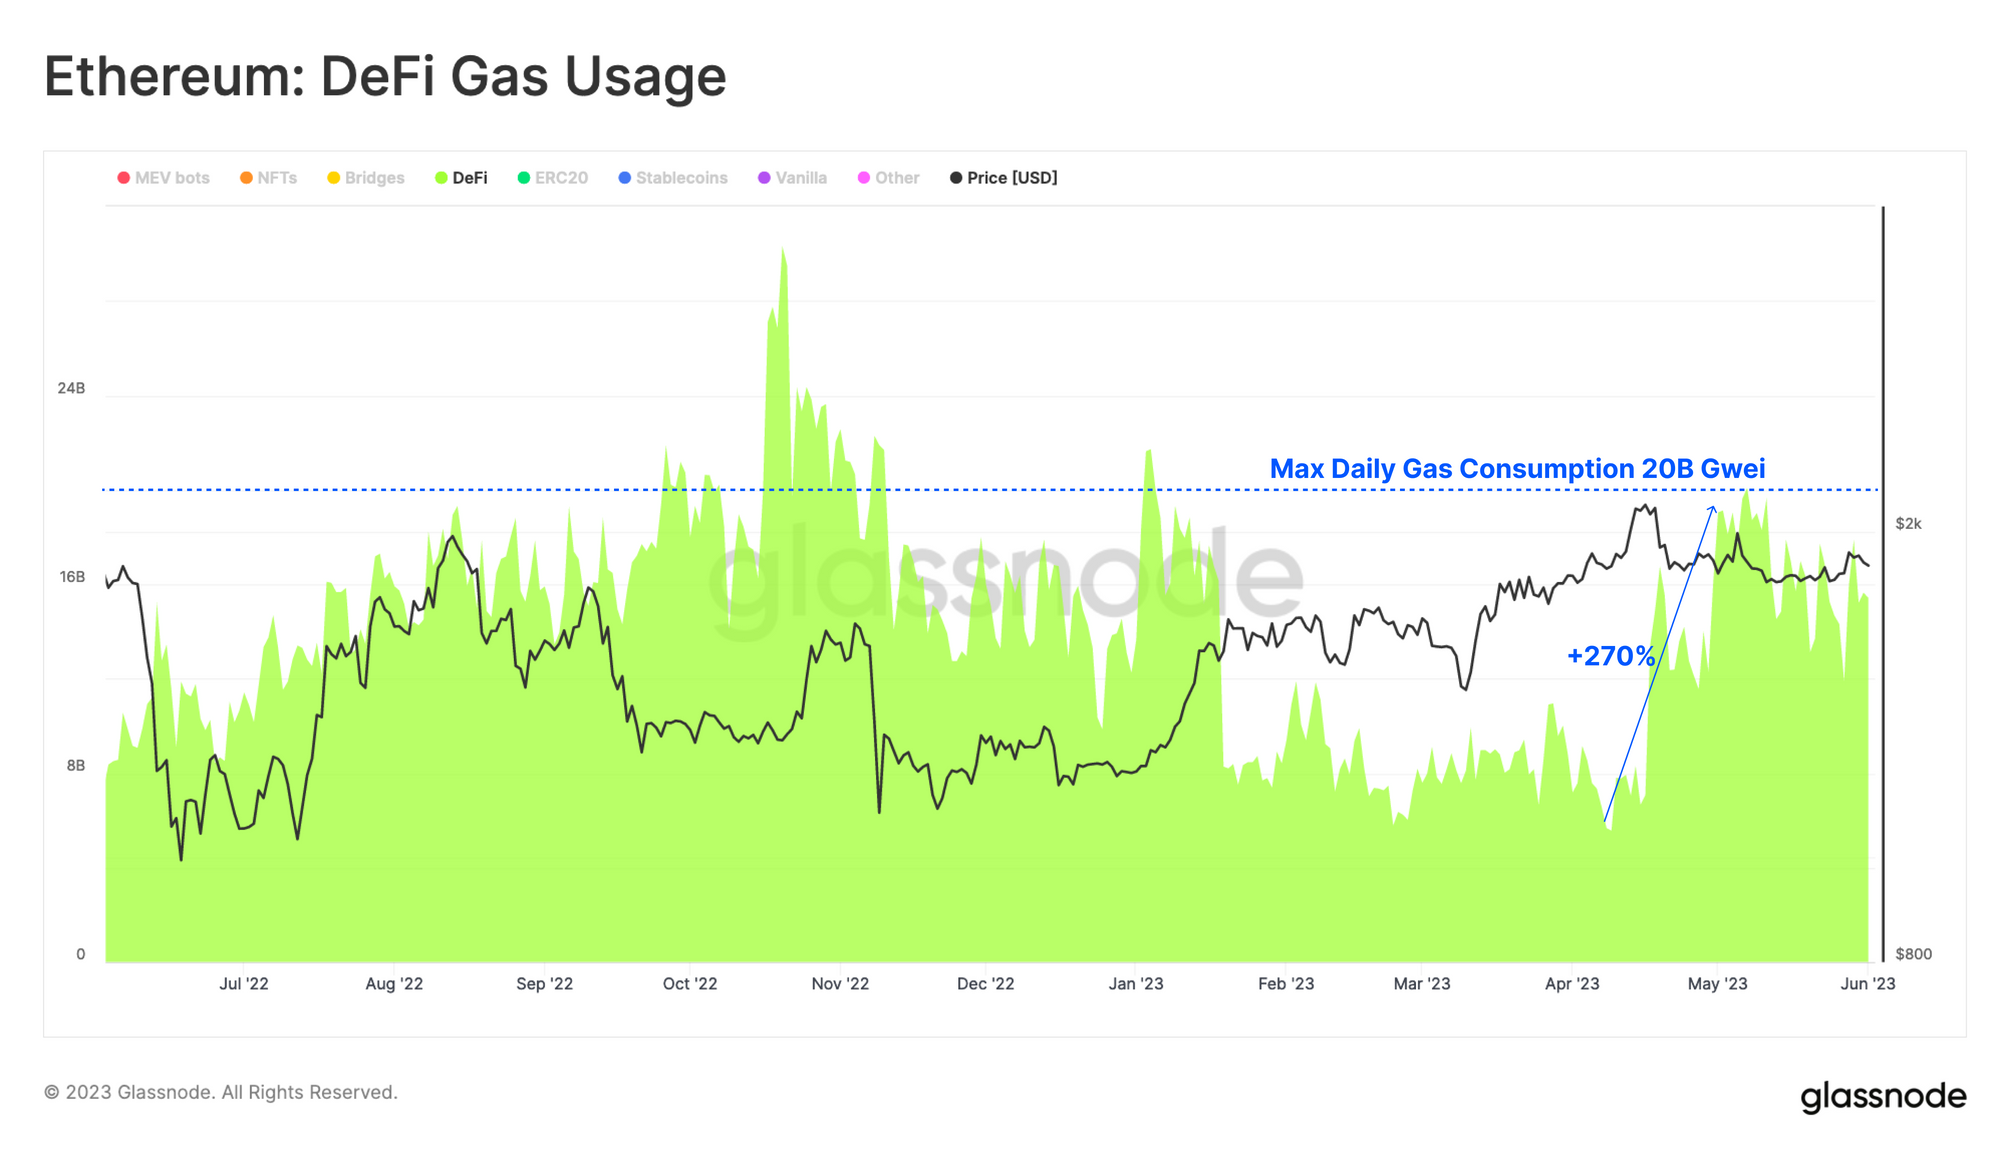
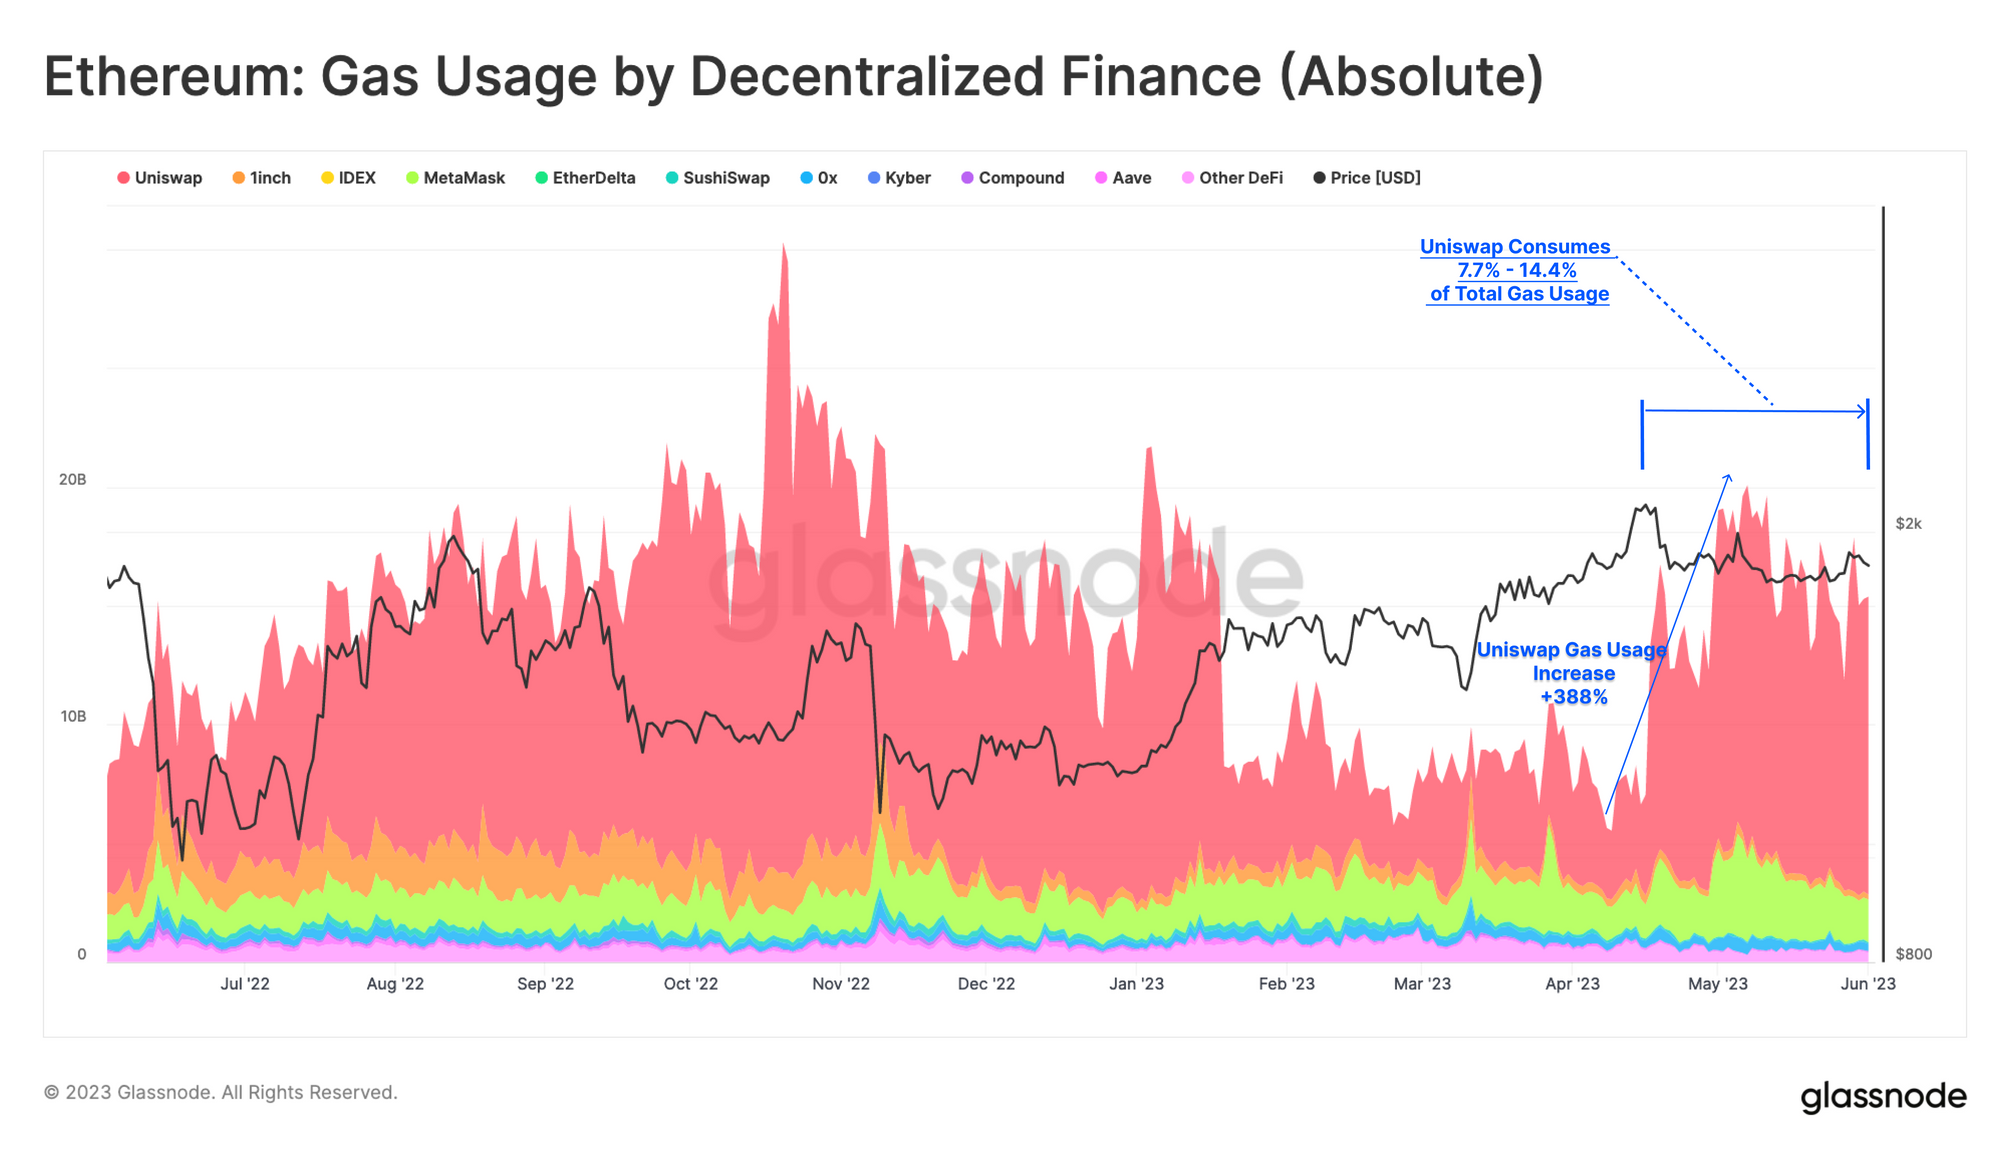
Smart contract interactions are more gas intensive and can cost multiples of a simple transfer. Gas usage associated with DeFi protocols rose 270% in late April, pushing daily gas consumption by the sector above 20B gas units.
If we break down DeFi gas by protocol, we quickly determine that the primary uplift in activity is driven by trading activity on decentralized exchanges. Uniswap remains the primary venue, seeing a 388% increase in gas usage since April, and now accounts for between 7.7% and 14.4% of total Ethereum gas demand.
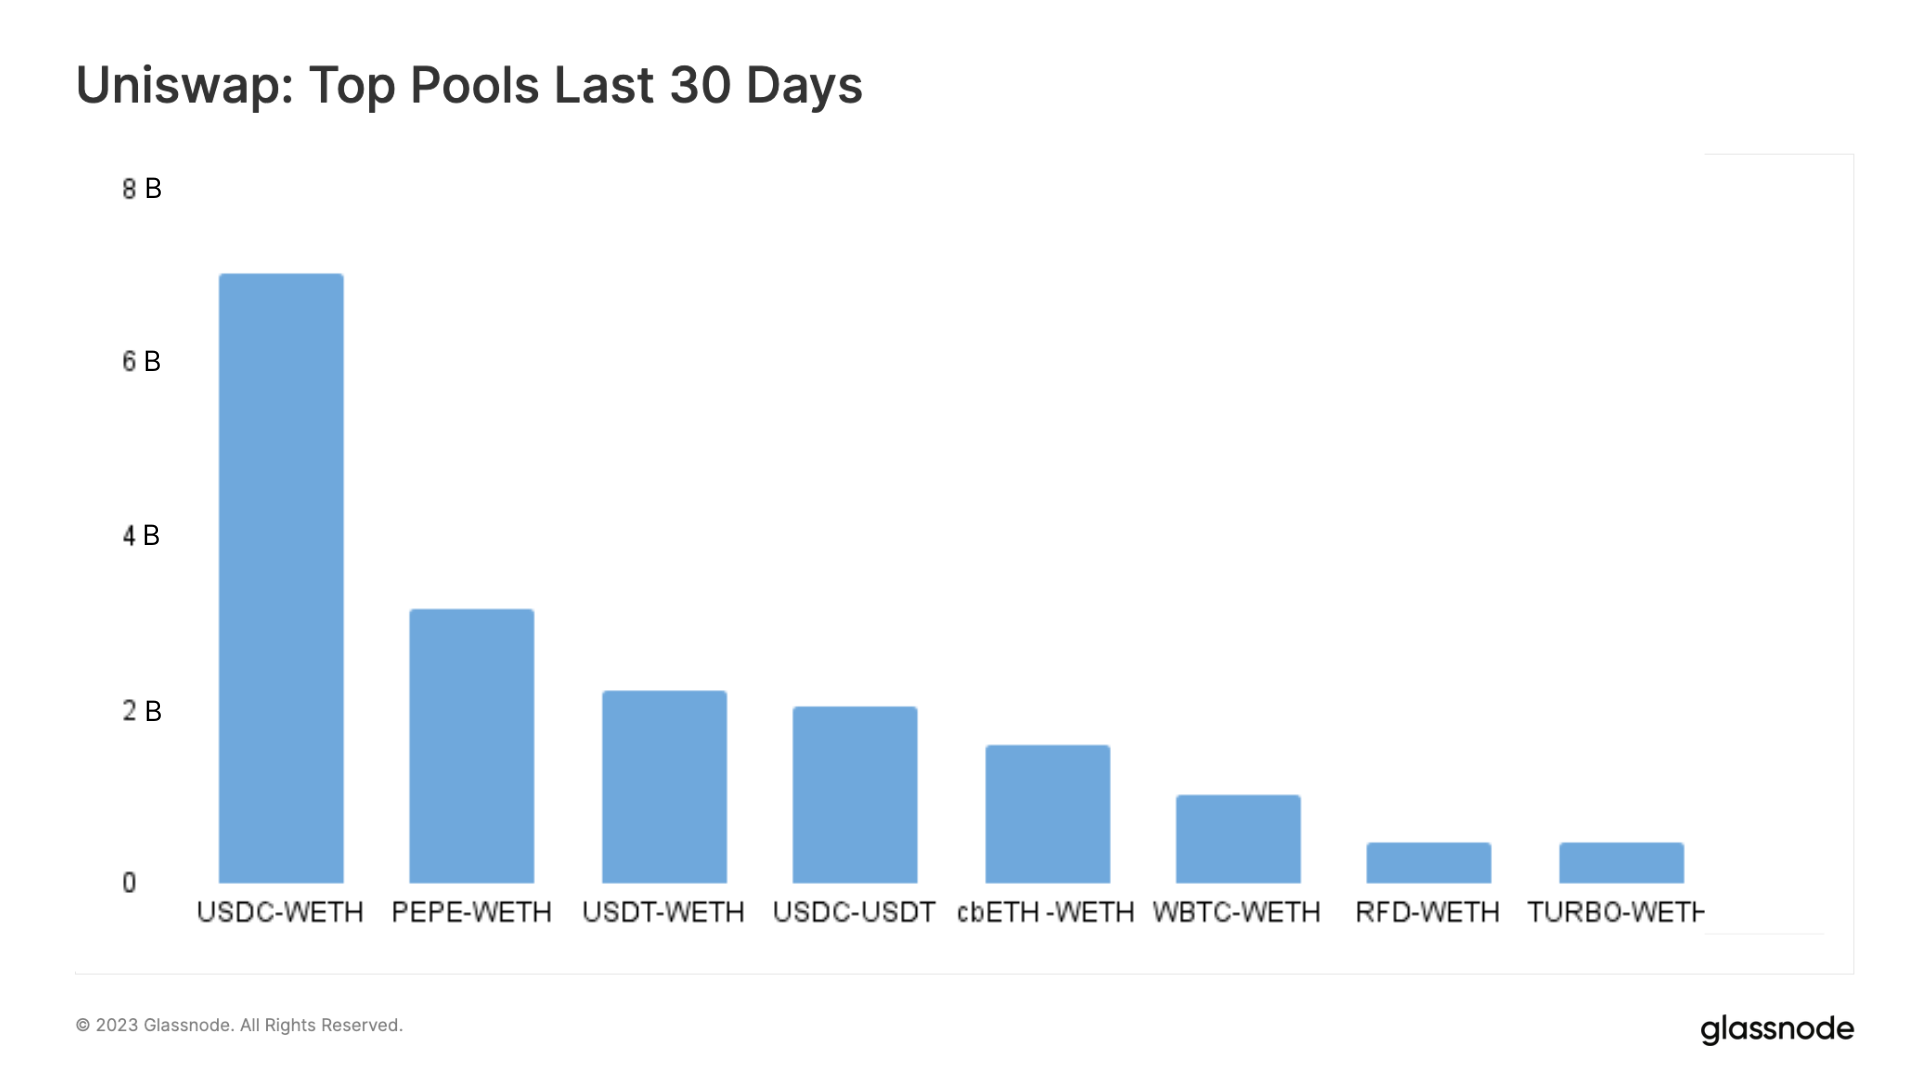
Those who follow the news might assume that this increase in activity is due to the recent Memecoin hype, which revolved around tokens such as PEPE and HEX. However, a more detailed analysis of trading volume on Uniswap paints a more detailed picture.
The chart below shows the top traded pools on Uniswap, revealing that the highest volumes over the past 30 days were primarily related to larger market cap assets like ETH, stablecoins, WBTC and the Coinbase's staking derivative cbETH.
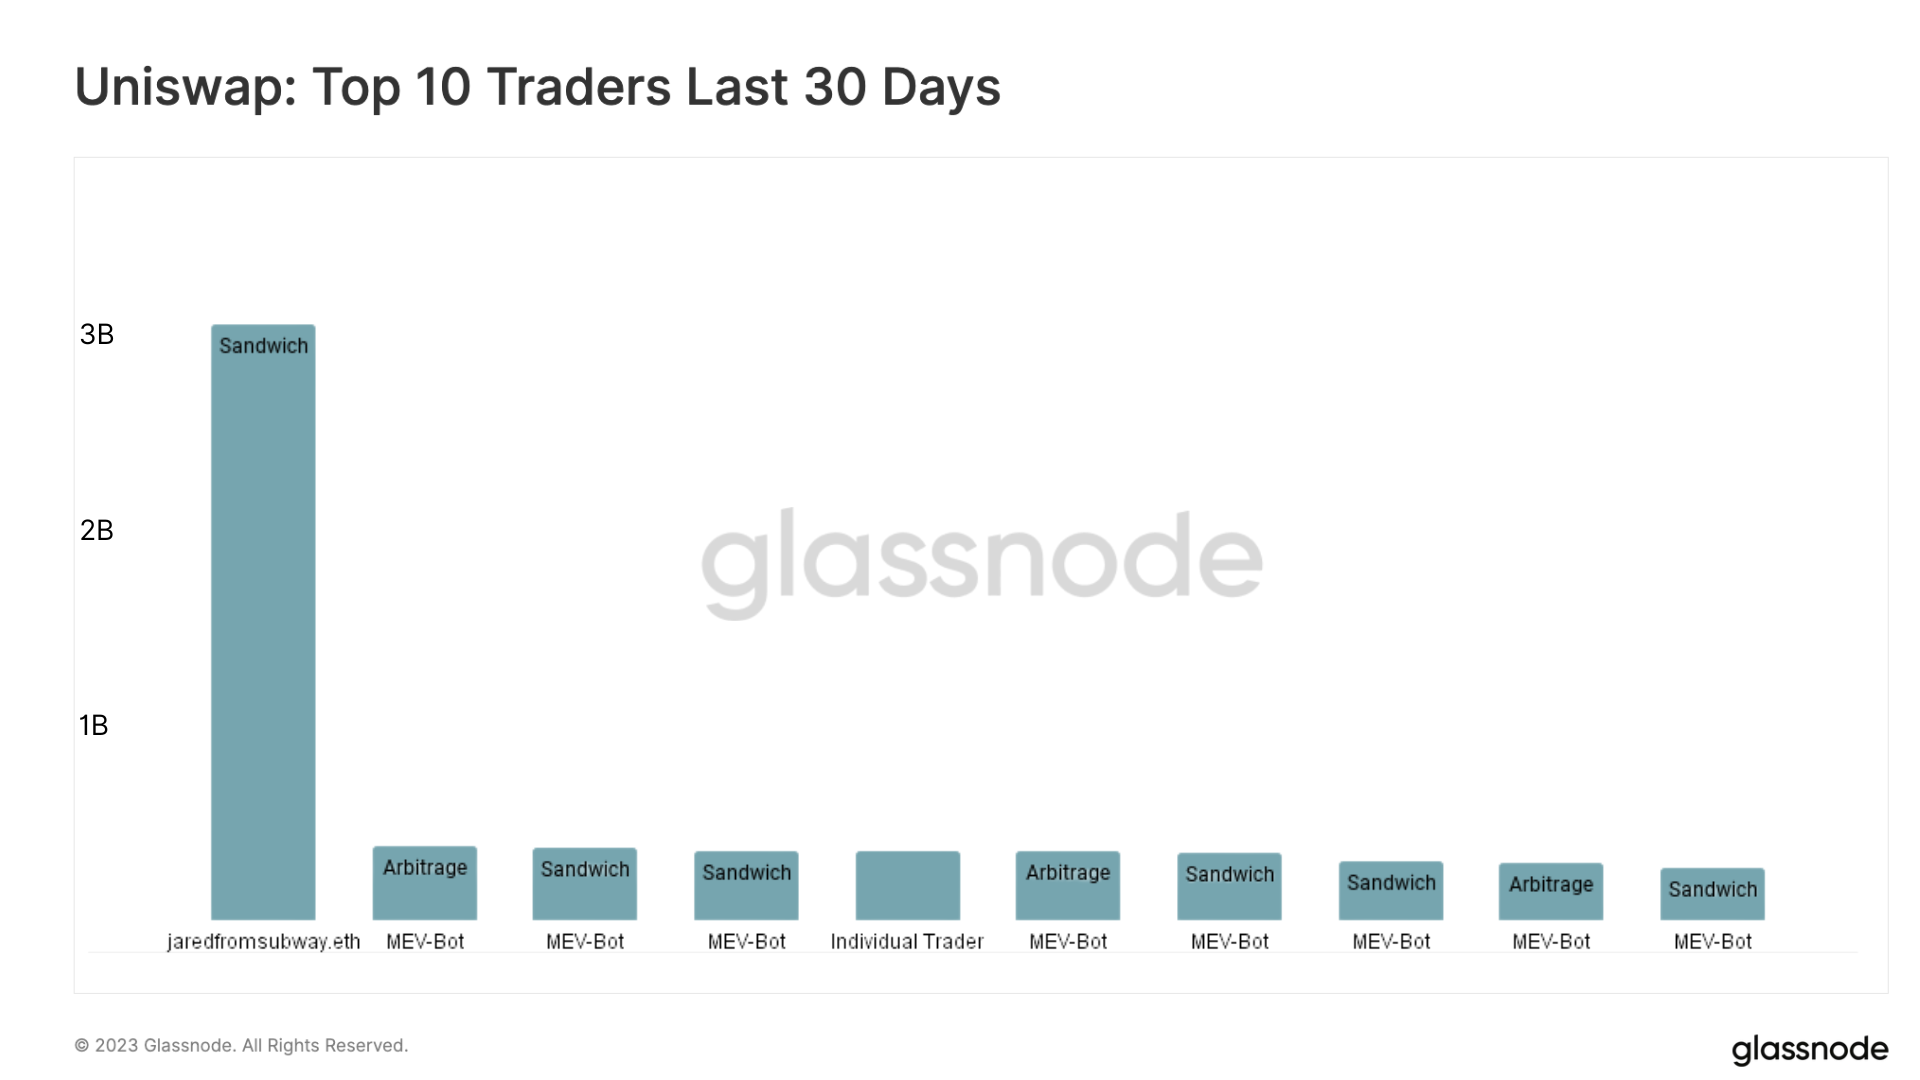
After comparing the addresses of the top 10 traders with our labels, we found that all but one were associated with MEV bots. With the infamous MEV-bot jaredfromsubway.eth making over USD 3B in trading volume during the past month.
Whilst it requires further research to determine how many of the global pool of traders are bots, the volume size generated by the top ten already gives us an idea of how much of Uniswap's volume may in fact be automated arbitrage.
One way to rationalize this is to consider the exponential scope of arbitrage opportunities available across Ethereum DEXs:
- As the price of each token (+ slippage) changes, eventually the gas fee will justify an arbitrage transaction.
- Each DEX pool hosting that token provides a venue for an arbitrage transaction.
- Thus, the number of potential arbitrage transaction opportunities will grow exponentially, related to both the number of DEX liquidity pools, and the number of tokens available to trade.
If we take into account that many bots engage in arbitrage or sandwich attacks, the degree of 'organic' trading volume on Uniswap may well account for over two-thirds of all DEX activity.
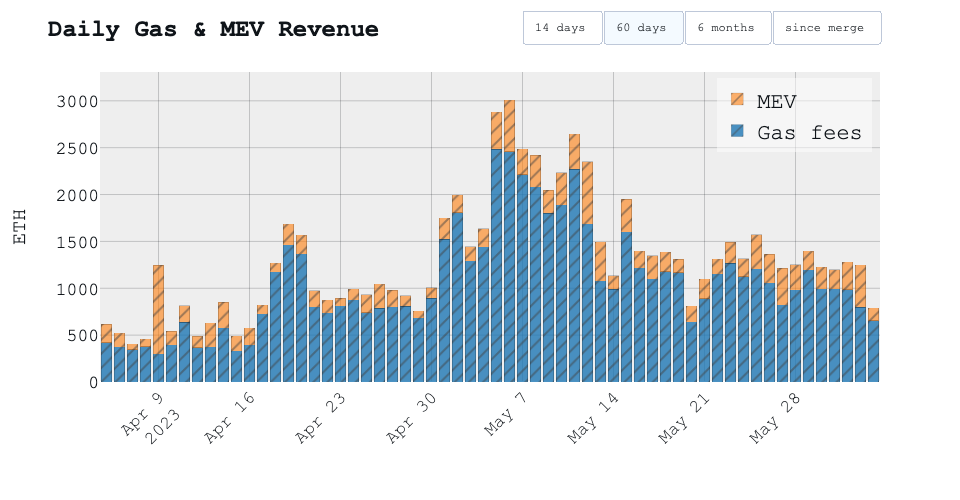
While the activities of these trading bots may be considered harmful for end-users of Ethereum, it does have benefits for Ethereum validators. In the past month, validators not only earned higher rewards due to increased priority fees, but also benefited from MEV-boost payments. These payments are collected from traders and bots who pay to have their transactions ordered in the most profitable way within a block.
In many ways, this highlights an increasingly favourable trend for staked ETH as a primary asset within the Ethereum ecosystem. This also establishes a native hurdle rate which tokens must compete with in order to attract capital flows.
Risk-Off Rotation
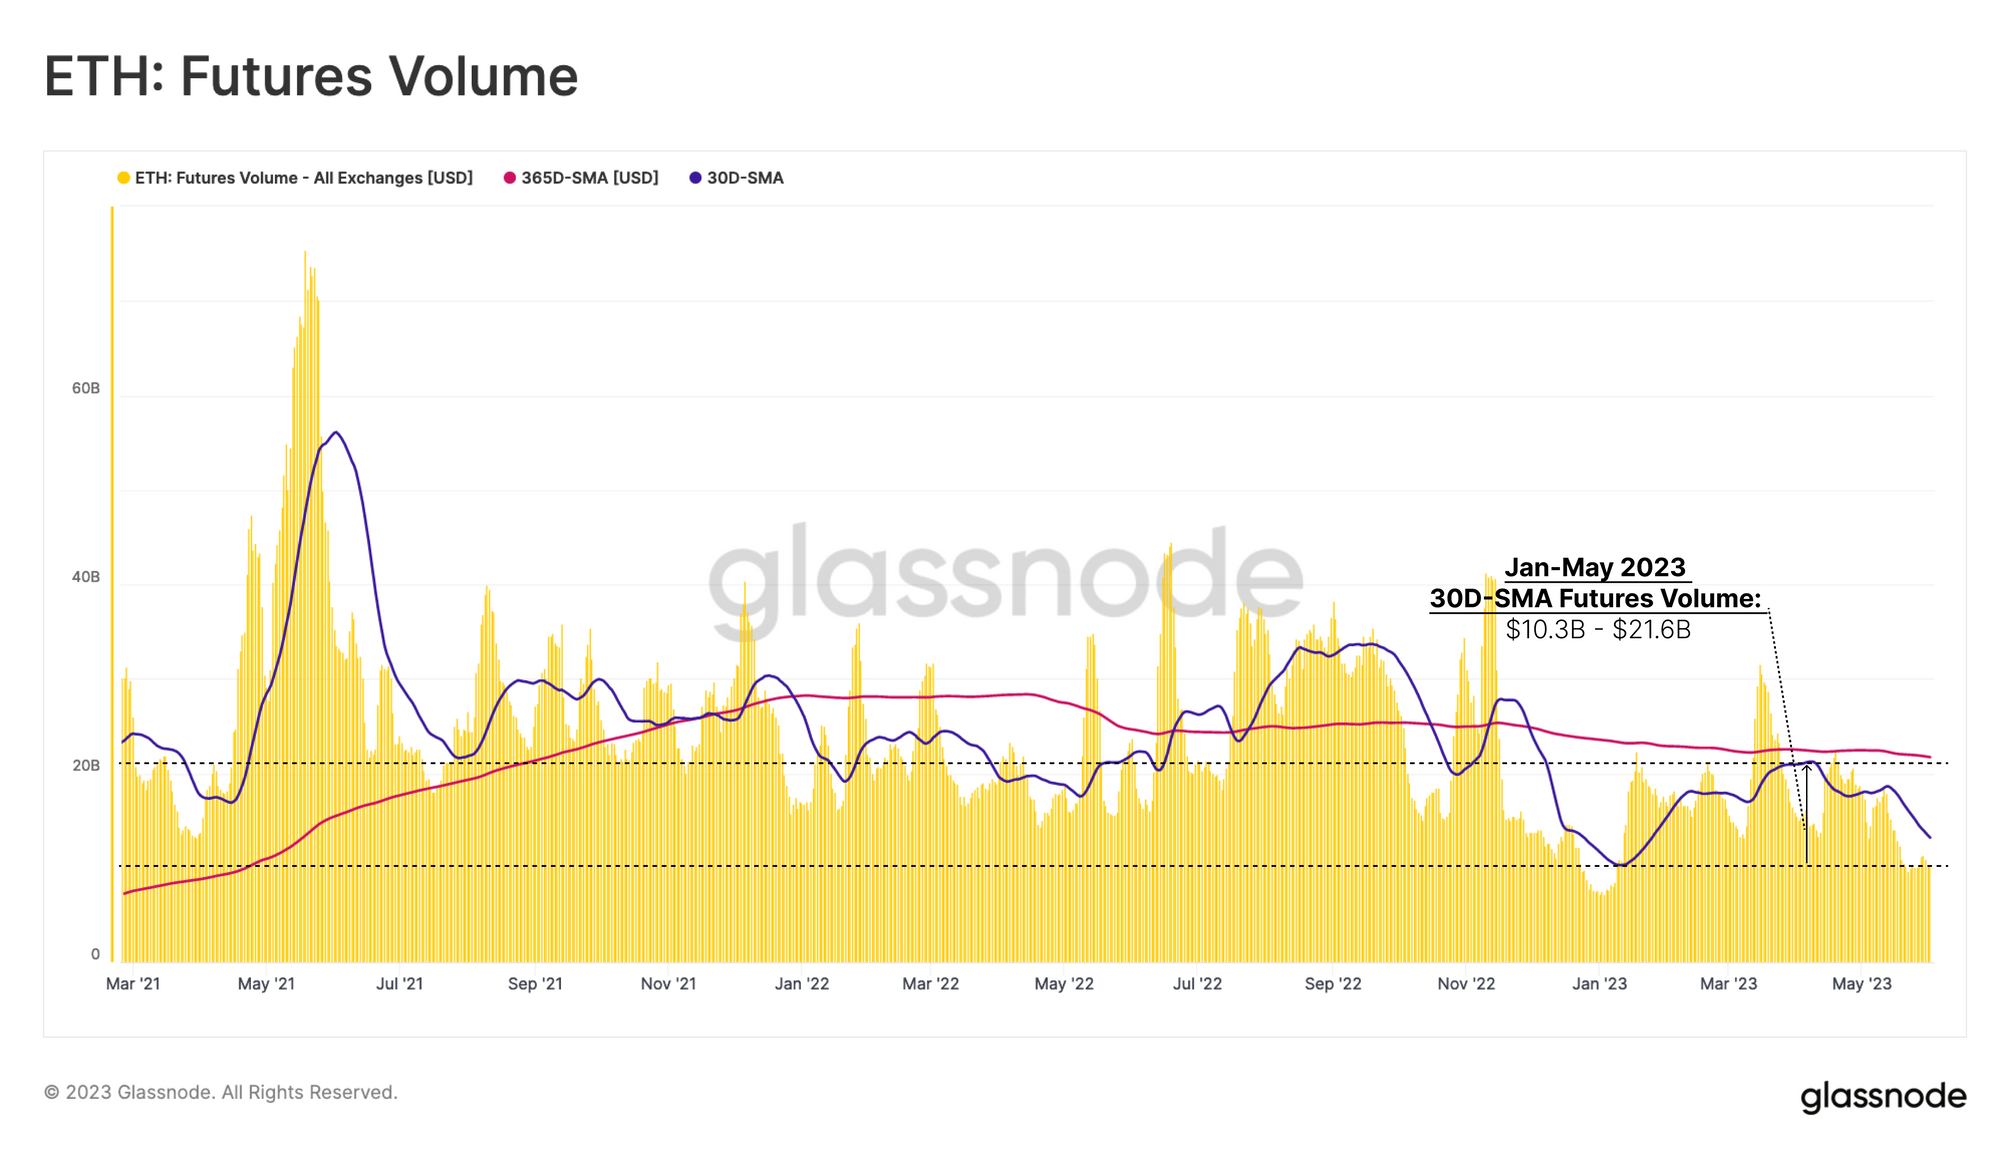
There are also strong indications of capital rotation moving lower on the risk curve, shifting towards stablecoins and BTC as liquidity lightens. If we start with Ethereum Futures markets, we can obtain a view into market participants beyond the crypto-native traders usually found on decentralized exchanges.
After the FTX collapse, futures trade volume collapsed to just ~$7.5B/day. Volumes have seen a comeback in 2023, however the 30-day average ($12.0B/day) remains well below the yearly average ($21.5B/day).
Unlike the uptick in Uniswap trading activity, futures trading has continued to contract through May, indicating that institutional trading interest and liquidity remains quite weak.
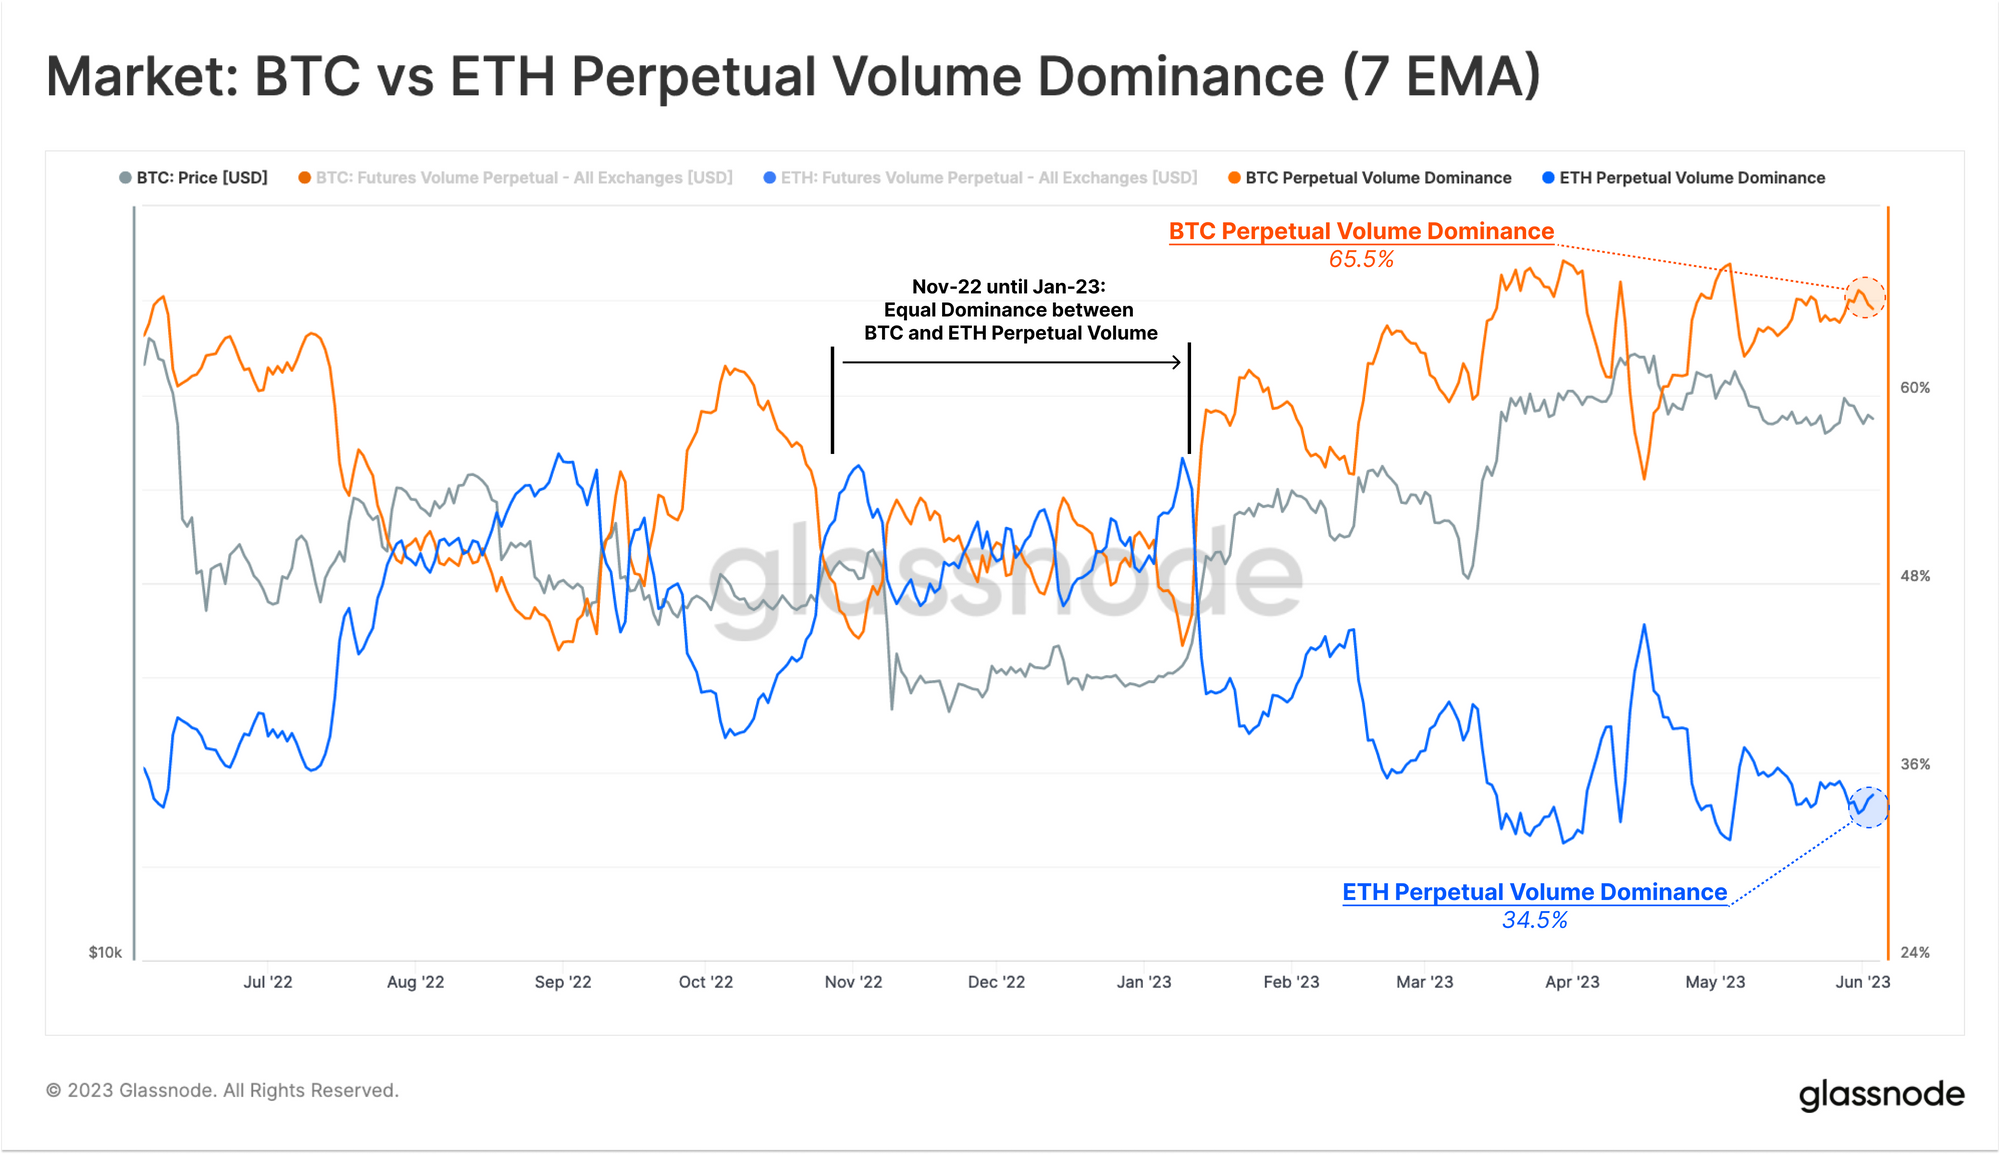
We can see a supporting trend in the relative volume dominance between BTC and ETH in perpetual swap markets. Whilst trade volume between both assets reached parity in late 2022, Ethereum's relative share of futures volume has decreased massively in 2023.
ETH currently represents 34.5% of trade volume between the two majors, suggesting liquidity is moving down the risk curve, and preferring to concentrate in BTC markets on a relative basis.
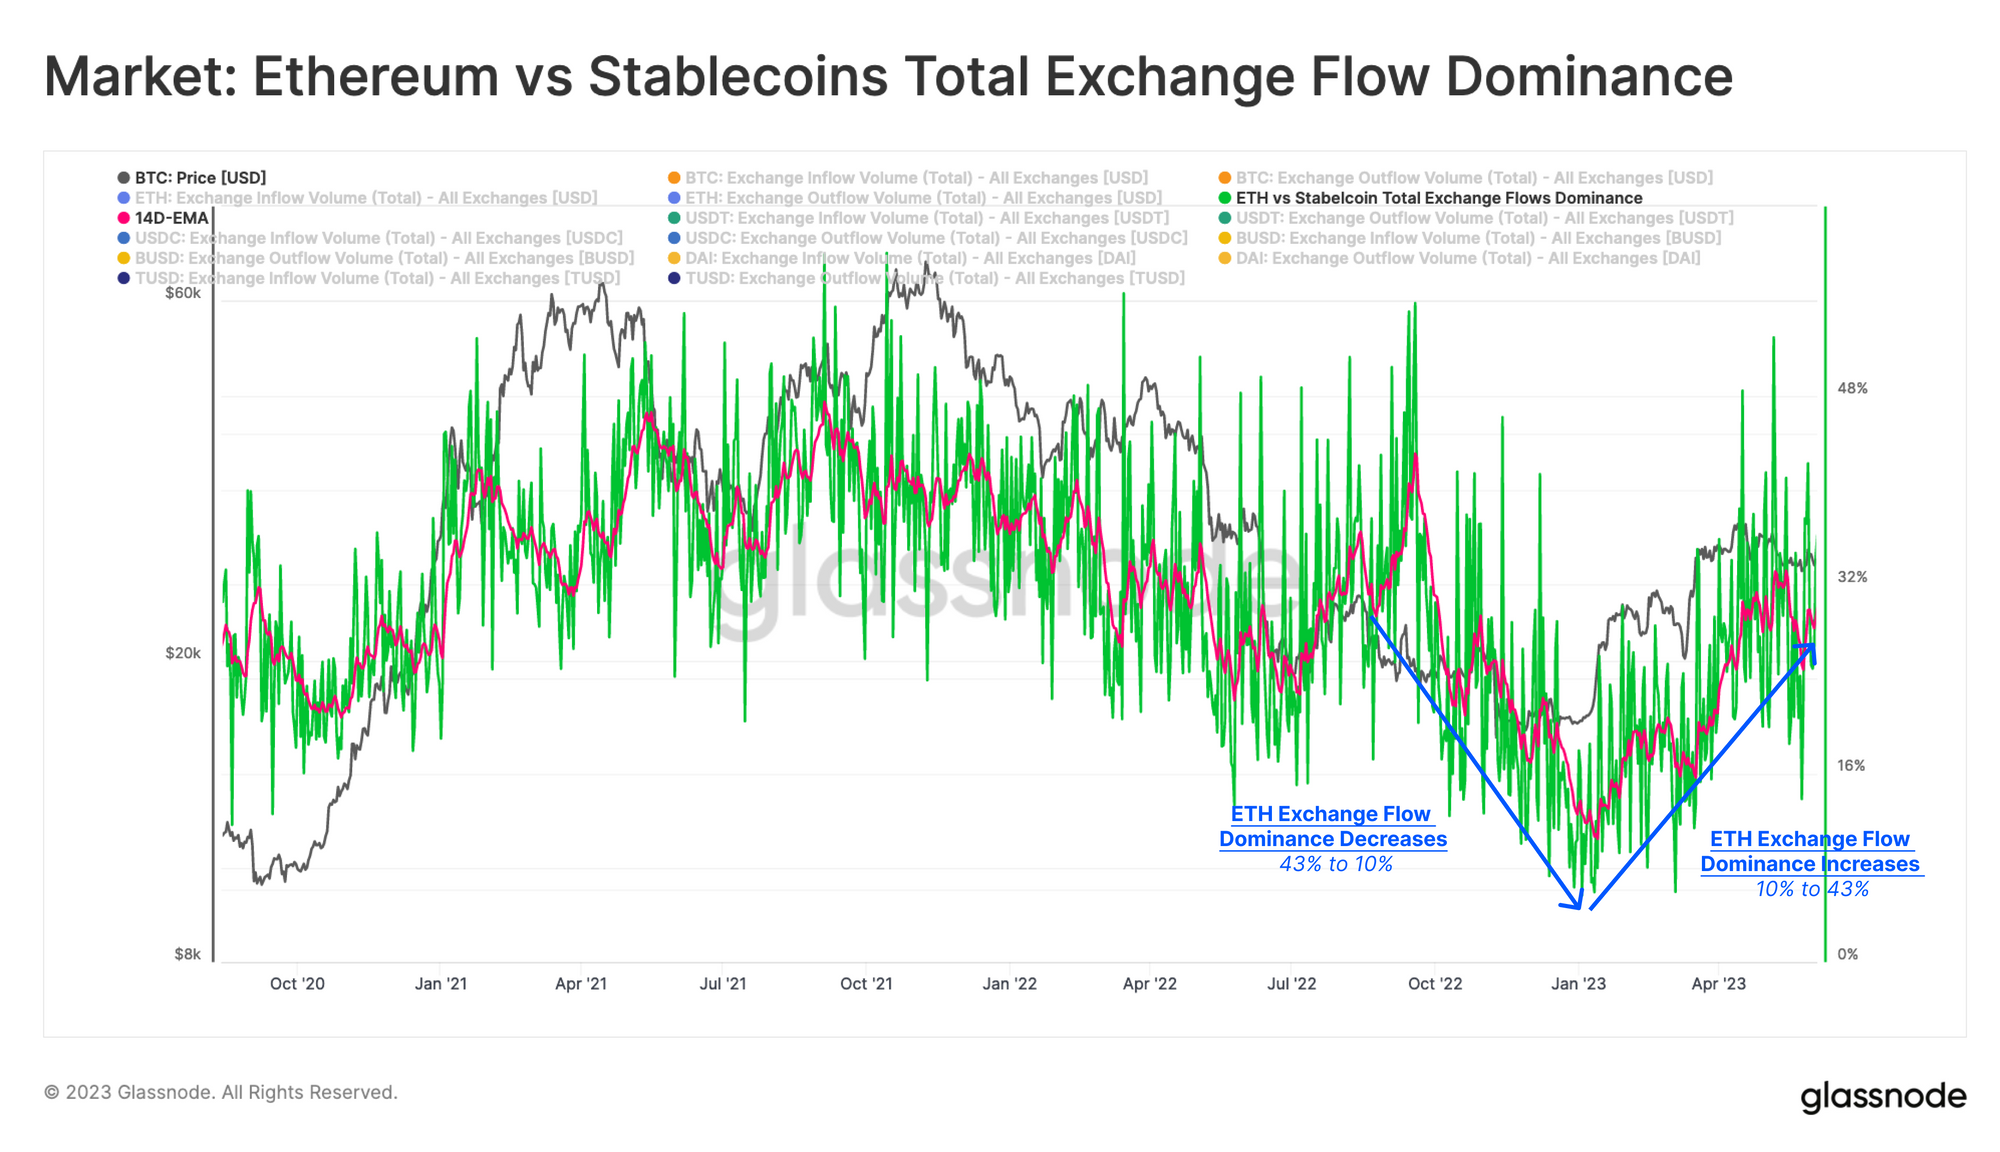
On-chain data provides another view into capital flows and rotation within crypto markets. The chart below compares the total USD denominated value of ETH vs stablecoins flowing in and out of exchanges. During the massive deleveraging in 2022, a noticeable shift in investor preference developed, with ETH dominance in capital flows declining from ~35% to 10%.
In 2023, we observed a strong reversal, with ETH's proportion of exchange flows rising back to 25%. However, this trend stalled in early May, suggesting a potential change in risk appetite. Investors who benefited from the strong first quarter returns, may be starting to transition capital back towards stablecoins.
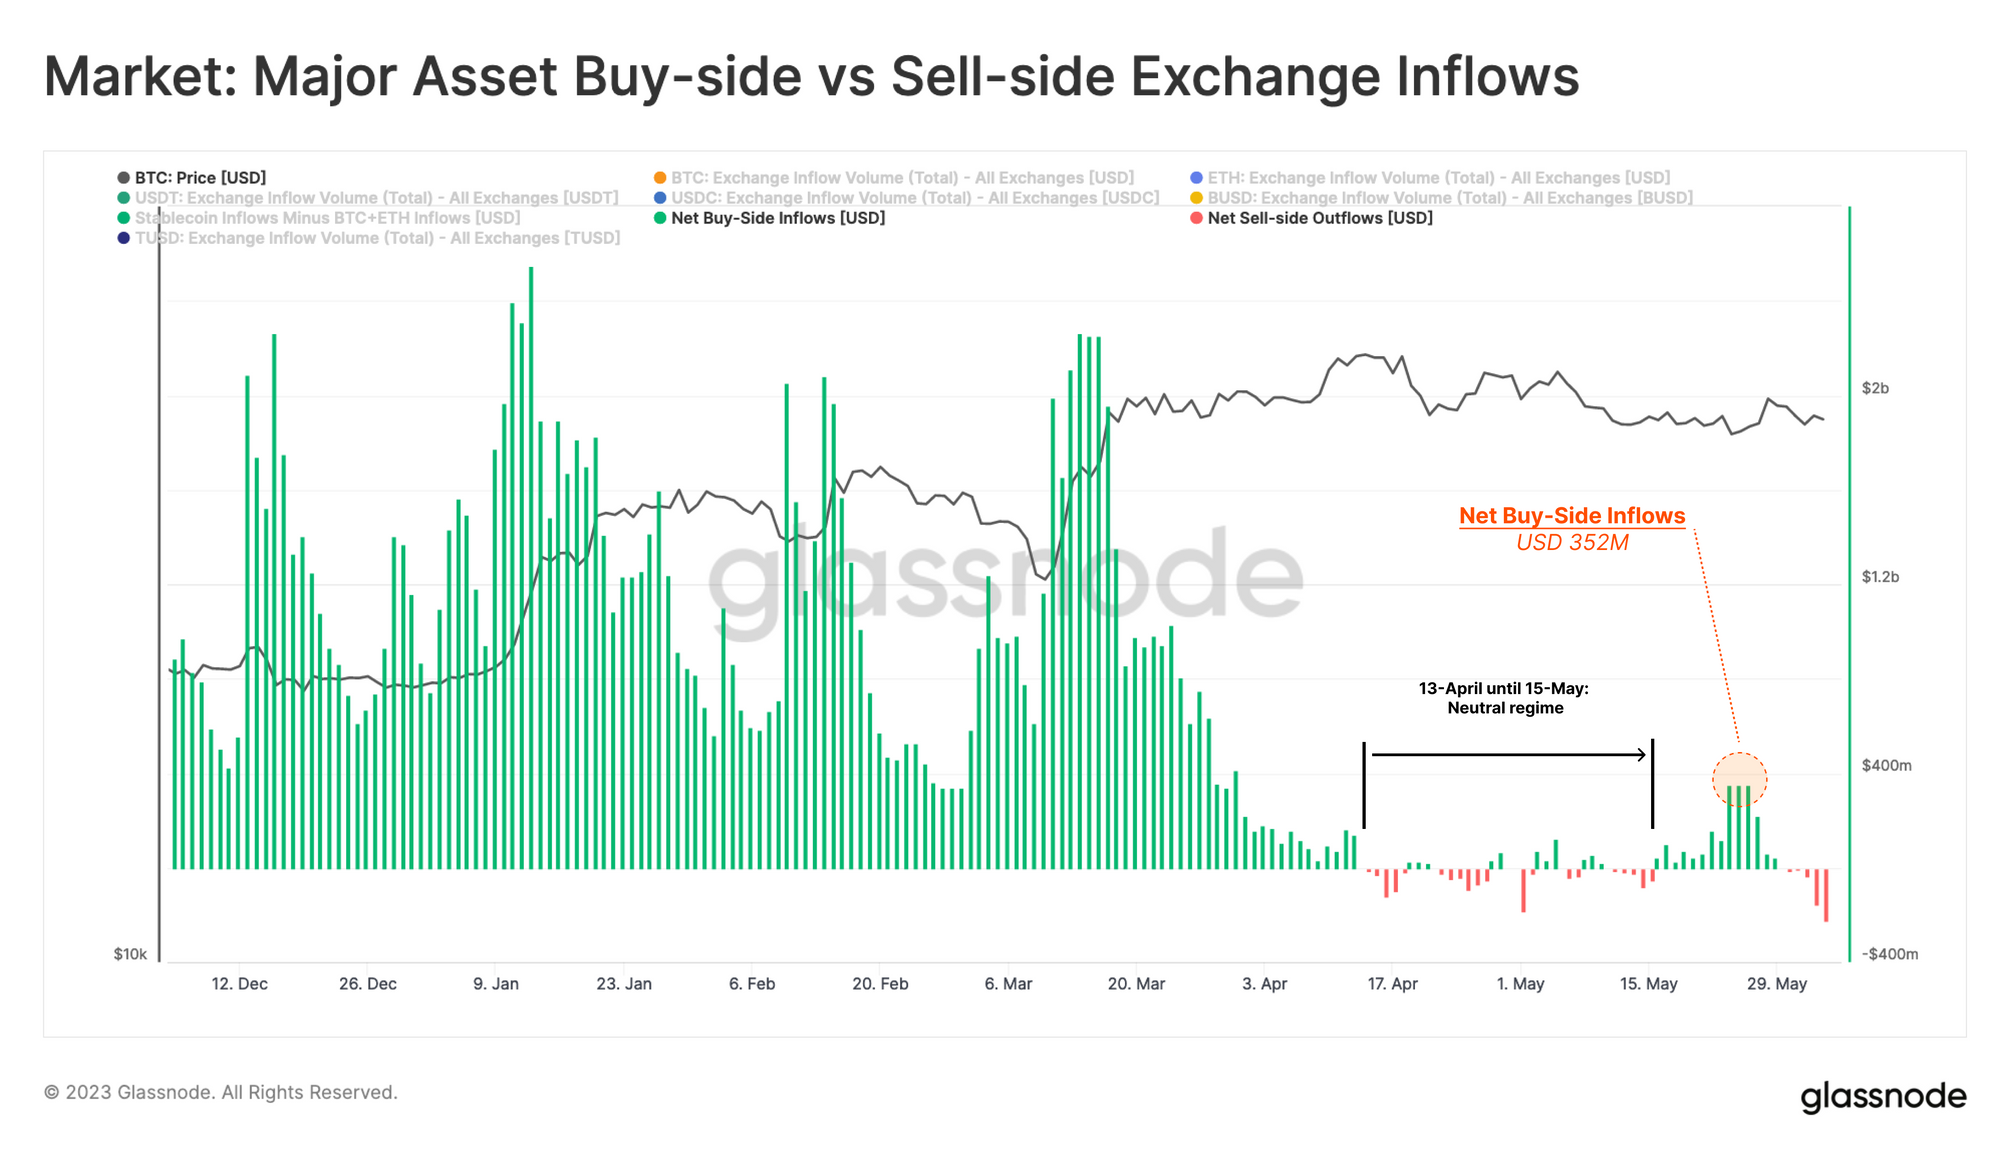
Another way to firm up this conclusion is by comparing the daily exchange inflows of each asset as a measure of buy-side and sell-side pressure. For this simplified model, we assume that BTC+ETH exchange inflows represent sell-side pressure, whilst and Stablecoin inflows represent buy-side pressure.
Negative values suggest that we have seen a net sell-side regime since the beginning of April 2023, where inflows of BTC+ETH started to exceed those of stablecoins. This is a distinct break from the significant buy-side pressure seen in Q1, with buy-side weakening in early April, which coincided with the start of the prevailing market correction.
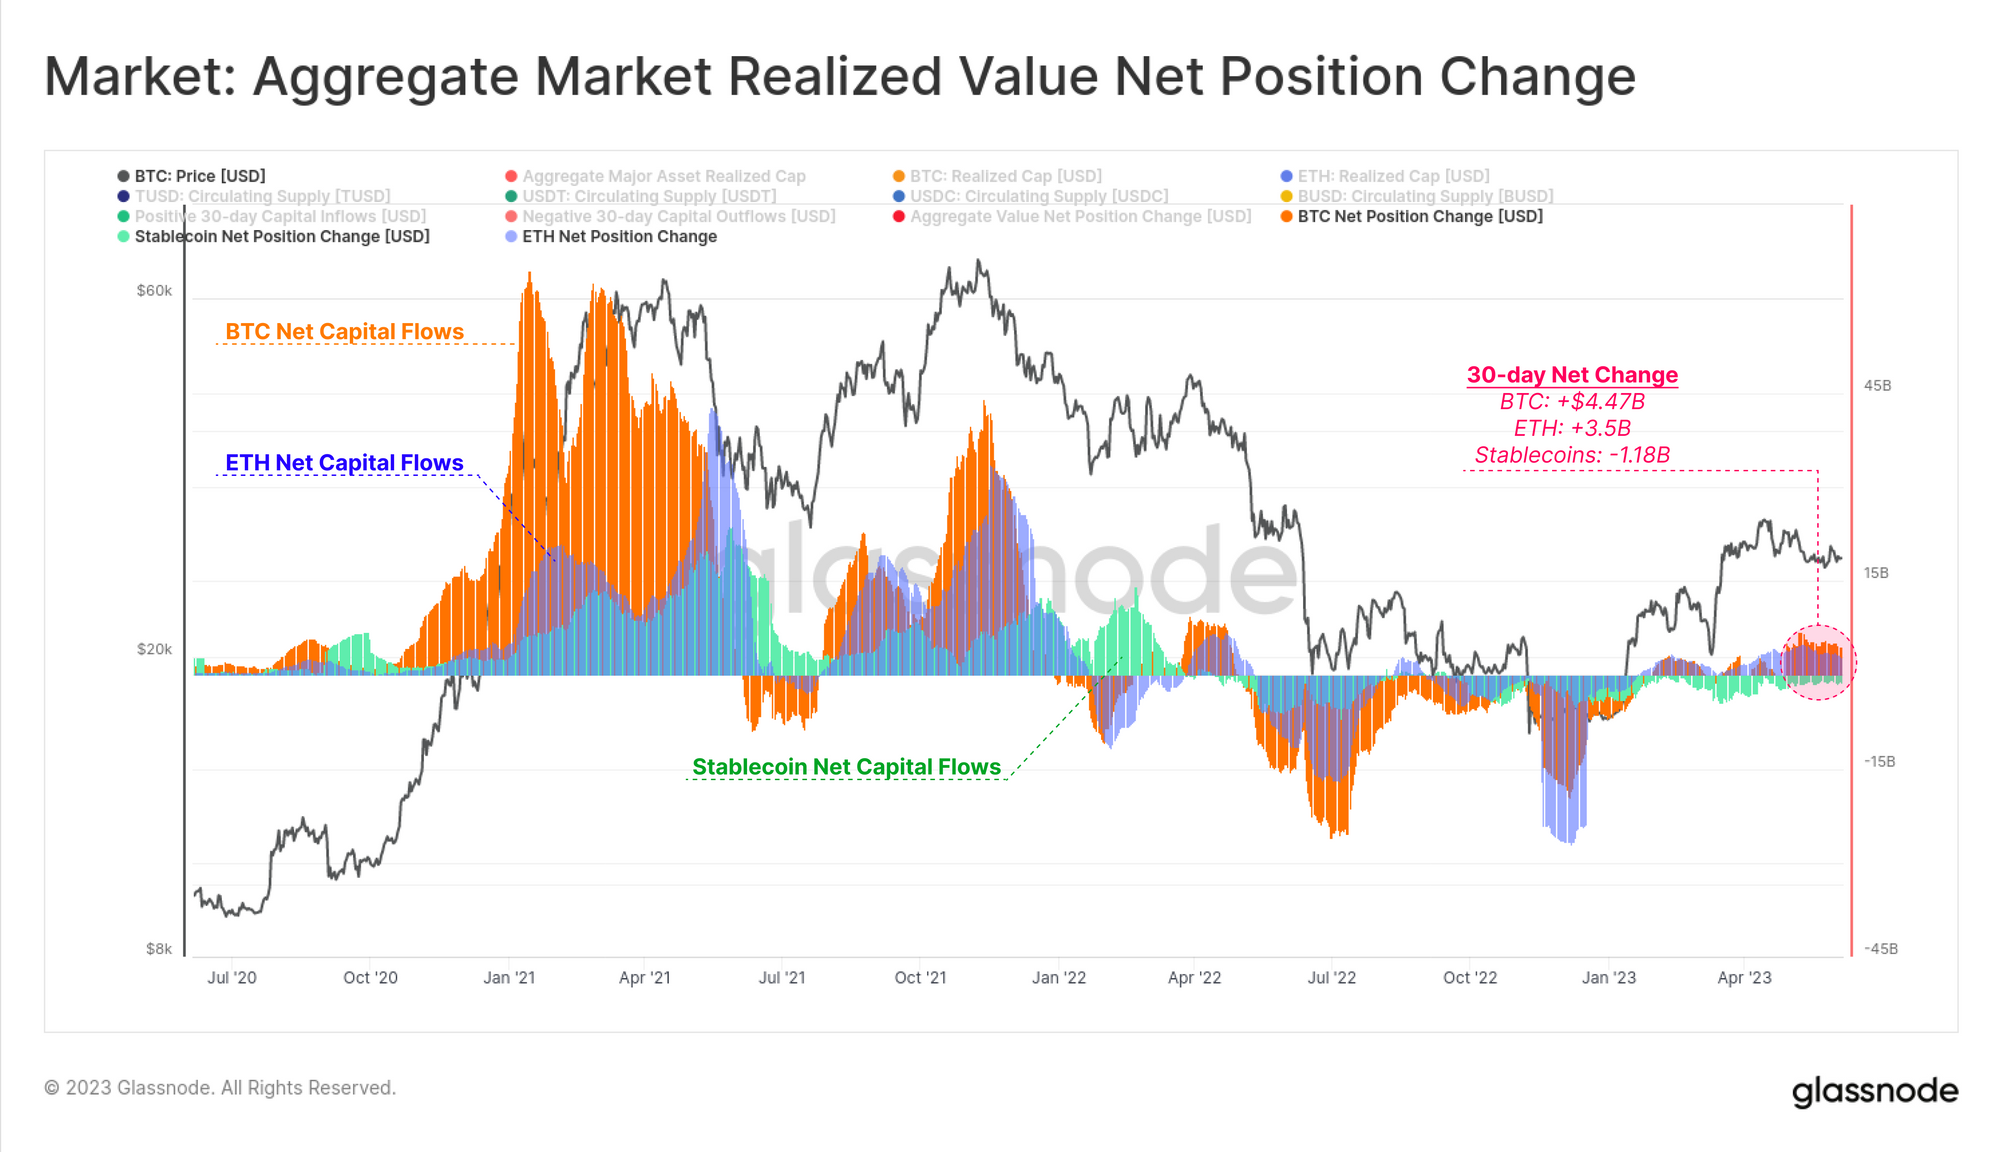
Generally speaking, capital tends to flow into digital assets through the two majors, BTC and ETH, or via stablecoins. Therefore, we can estimate the direction of aggregate capital flows by aggregating and comparing two metrics:
- Realized Cap for BTC and ETH (being the net change in value for coins moved on-chain)
- Circulating supply for stablecoins (considering USDT, USDC, BUSD, TUSD, and DAI)
From this, we can see that capital flows into the crypto markets has been primarily driven by an uptick in capital flows into BTC (+$4.47B/mth), followed by ETH (+$3.5B/mth). However this has been offset in part by around -$1.2B in capital outflows from stablecoins, as significant redemptions take place within the stablecoin sector.
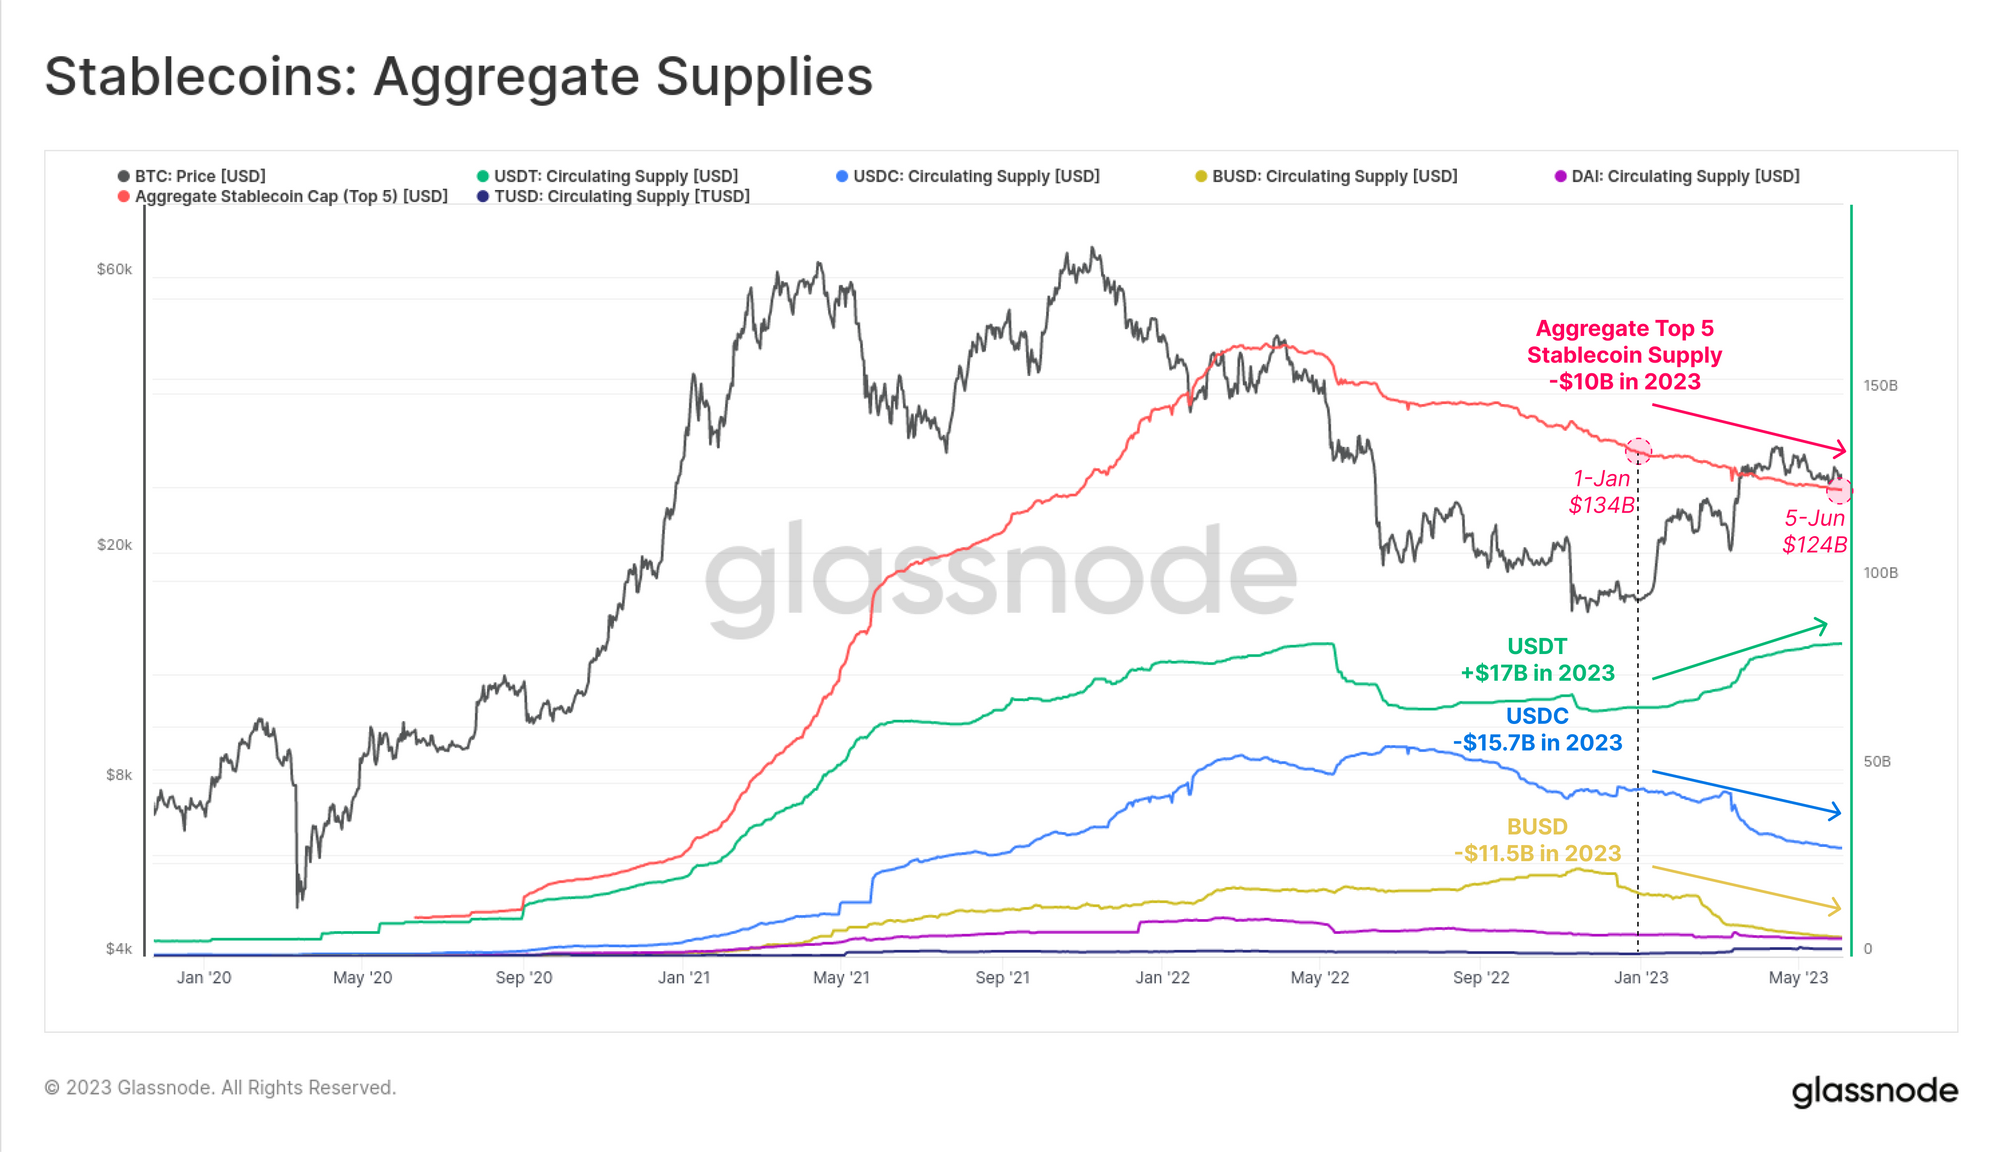
Recent stablecoins capital outflows are driven primarily by the second (USDC), and third (BUSD) largest assets, seeing supplies fall in 2023 by -$15.7B and $-11.5B, respectively. USDT has absorbed a significant proportion of these flows, pushing to a new ATH supply of $83.1B.
It is likely that this reflects a geographical divergence, with US regulated entities historically having expressed a preference for USDC over USDT.
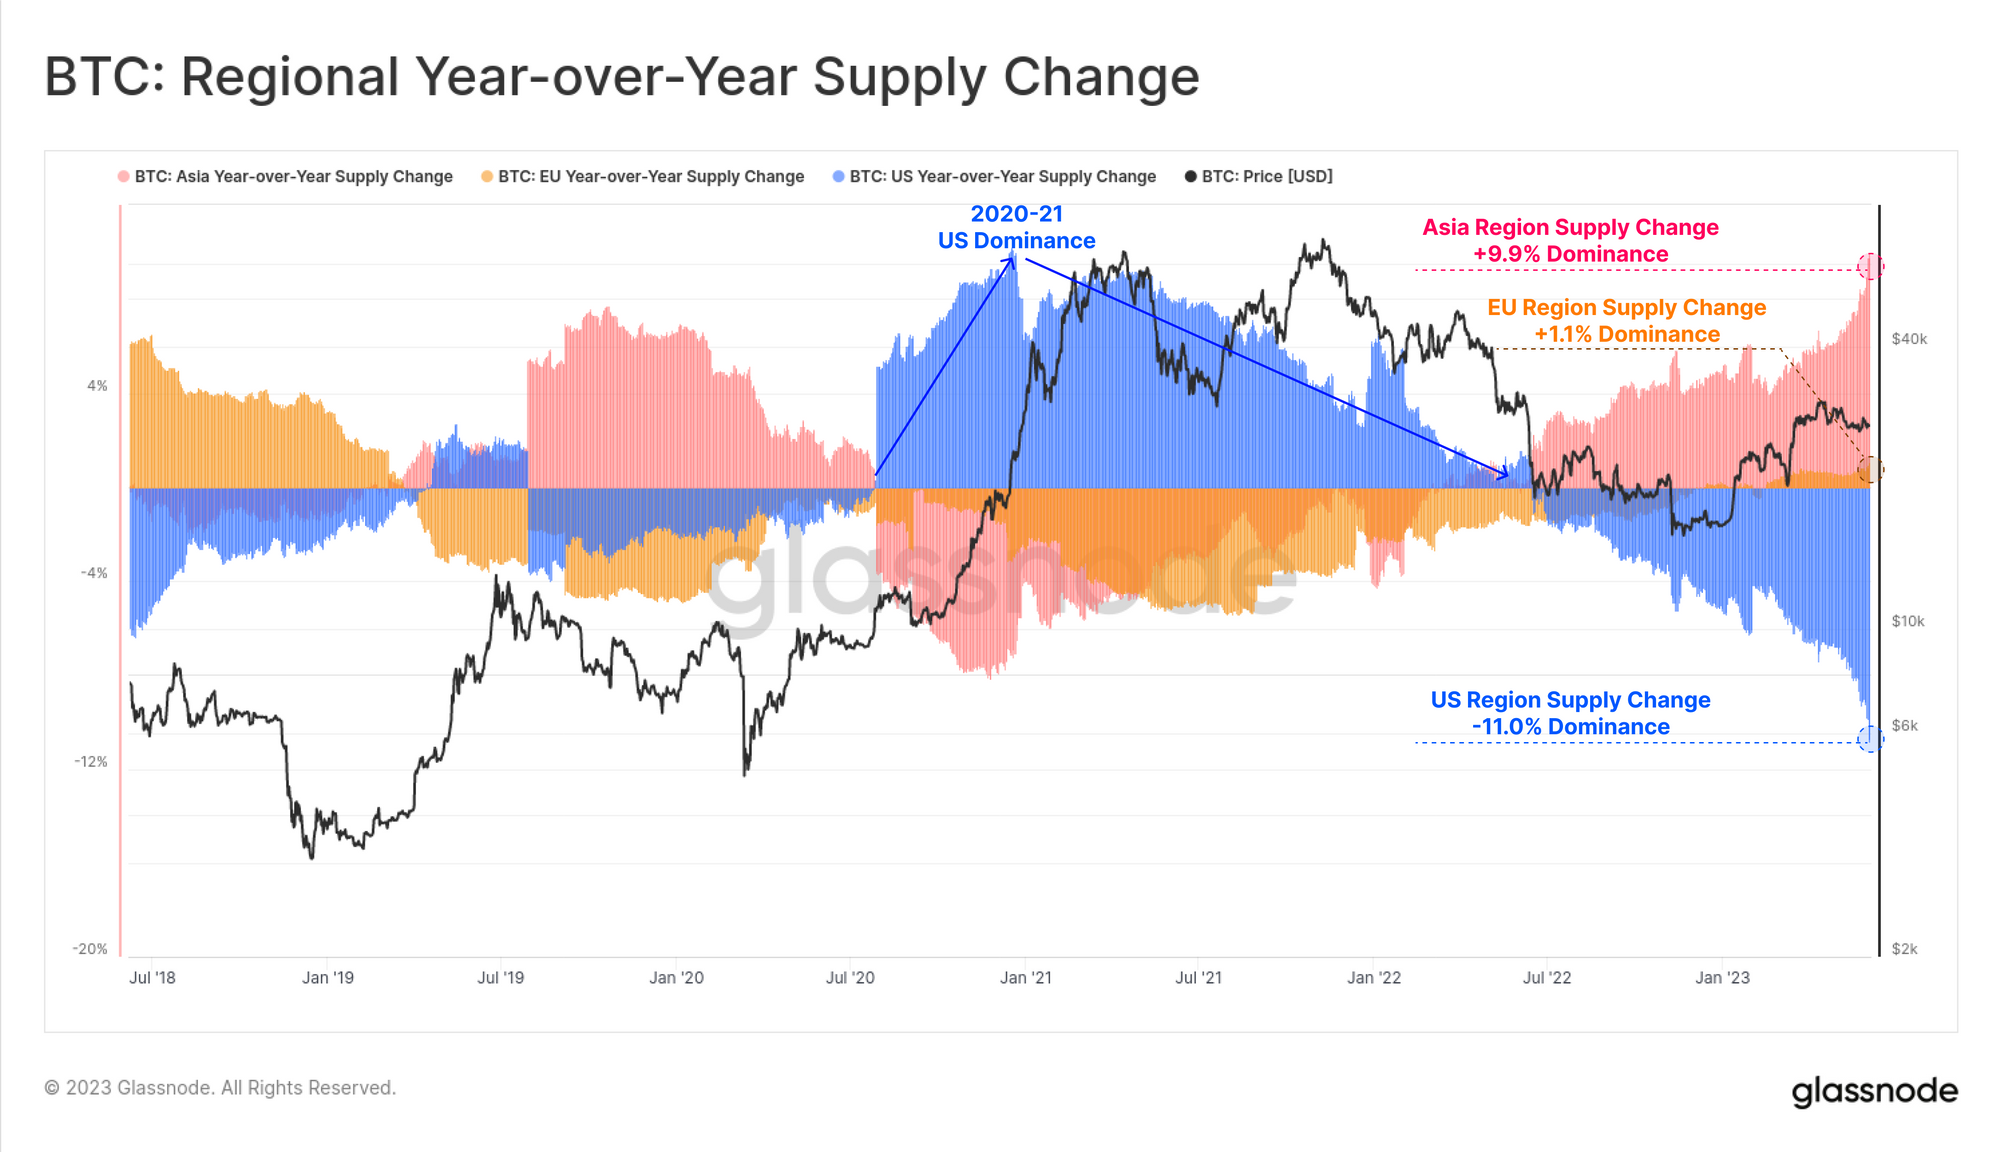
We will close out by noting that a similar divergence is visible in the year-over-year BTC supply change based on geographical regions. The extreme dominance of US entities in 2020-21 has clearly reversed, with US supply dominance falling by 11% since mid-2022. European markets have been fairly neutral over the last year, whilst a significant increase in supply dominance is visible across Asian trading hours.
Summary and Conclusions
Over the past month, there has been increased activity on decentralized exchanges, particularly on Uniswap. Although one may think Memecoins had sparked this activities, a closer look reveals most of the volume was generated on larger and deeper WETH-Stablecoin pools. Remarkably, only a fraction of this trading actvities seems to have been organic, suggesting it is primarily arbitrage, MEV, and algorithmic trading.
Given US interest rates are now over 5%, non-interest-bearing stablecoins have become less attractive, especially to investors with access to US capital markets. Tether on the other hand has historically found wider adoption in markets outside the US, where national currencies are often weaker, and access to USD less common. Similarly, as an increasingly hostile regulatory environment is established in the US, capital appears to be flowing out, and eastward in the digital asset sector.
Much of this hints to a generally risk-off environment, with the remaining capital concentrating in the more liquid majors, and a growing preference for stablecoin capital.
Disclaimer: This report does not provide any investment advice. All data is provided for information and educational purposes only. No investment decision shall be based on the information provided here and you are solely responsible for your own investment decisions.
- Join our Telegram channel
- Follow us and reach out on Twitter
- Visit Glassnode Forum for long-form discussions and analysis.
- For on-chain metrics, dashboards, and alerts, visit Glassnode Studio
- For automated alerts on core on-chain metrics and activity on exchanges, visit our Glassnode Alerts Twitter
