An On-chain Ghost Town
Despite Bitcoin’s elevated price, a clear divergence has emerged between market valuation and network activity. In this report, we explore investor activity across both on and off-chain markets, and examine how network metrics have changed this cycle.


Executive Summary
- Network activity shows a decline in transaction count but a rise in settlement volume, pointing to increased usage by large entities. While fewer transactions are being broadcast, the average transaction size has grown significantly, indicating that institutional or high-net-worth participants are becoming more dominant in on-chain activity.
- Fee pressure remains subdued, with minimal demand for block space despite Bitcoin trading near all-time highs. This presents a notable divergence from previous cycles, where periods of elevated prices typically coincided with fee spikes due to congestion and heightened network usage.
- Activity has increasingly migrated to off-chain venues, with centralized exchanges now commanding the majority of trading volume, with futures markets in particular leading this shift. Notably, combined spot, futures, and options volumes routinely surpass on-chain settlement by 7–16x.
- Leverage continues to accumulate, with total open interest in futures and options reaching $96.2B. Importantly, the collateral composition has improved materially, with stablecoin-margined positions now comprising the majority of open interest.
A Quiet Chain
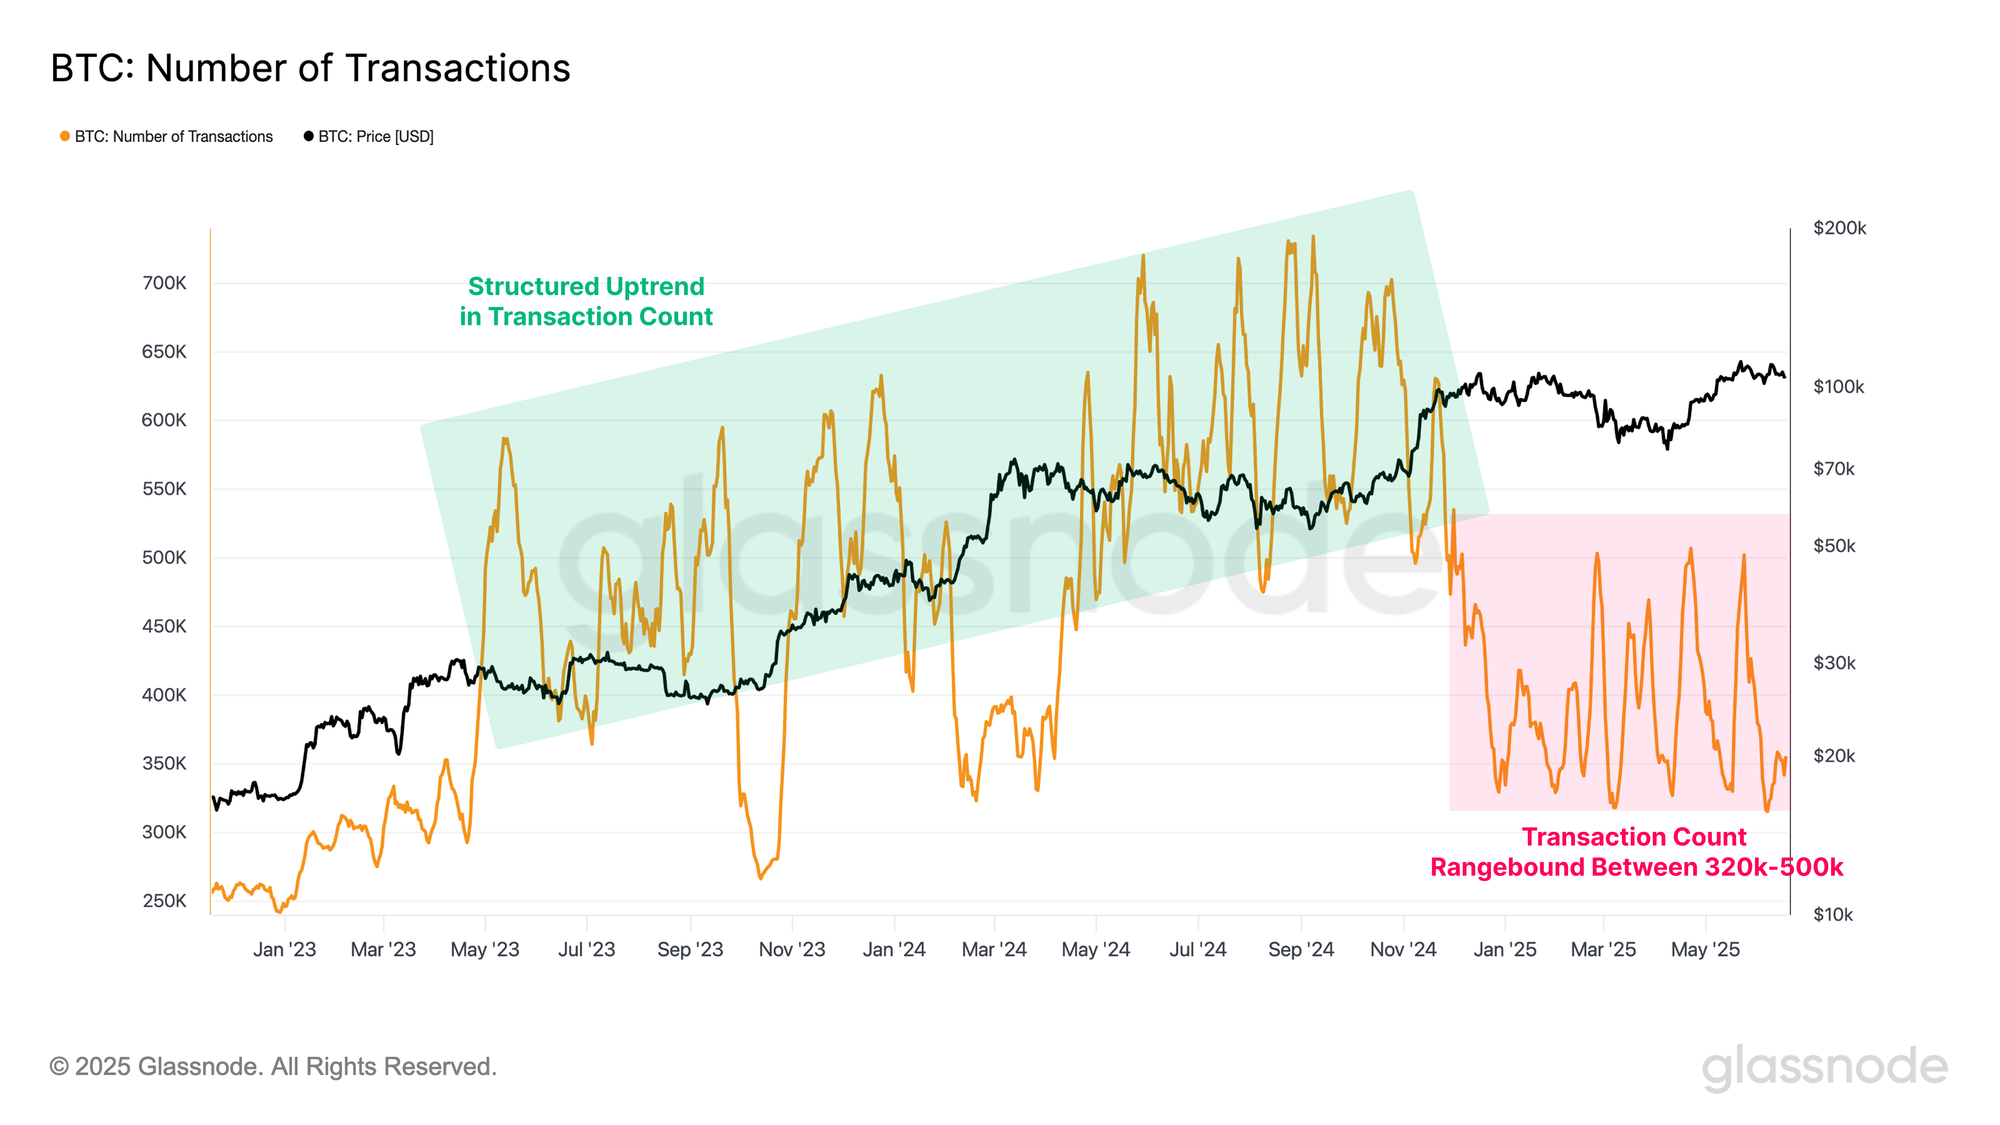
Bitcoin is holding firmly above the psychologically significant $100K level, and is just 6% shy of its all-time high of $111.7K. One might expect on-chain activity on the Bitcoin network to be equally vibrant, however a distinct divergence has emerged; whilst spot prices remain elevated, network activity is unusually quiet.
To assess this disconnect, we begin by examining the number of transactions settled each day by the Bitcoin network. Throughout 2023 and 2024, transaction counts experienced a structured uptrend, peaking at 734k per day. However, since the start of 2025, throughput has declined markedly, with daily transactions ranging between 320k and 500k per day, a notable contraction compared to the cycle’s earlier highs.
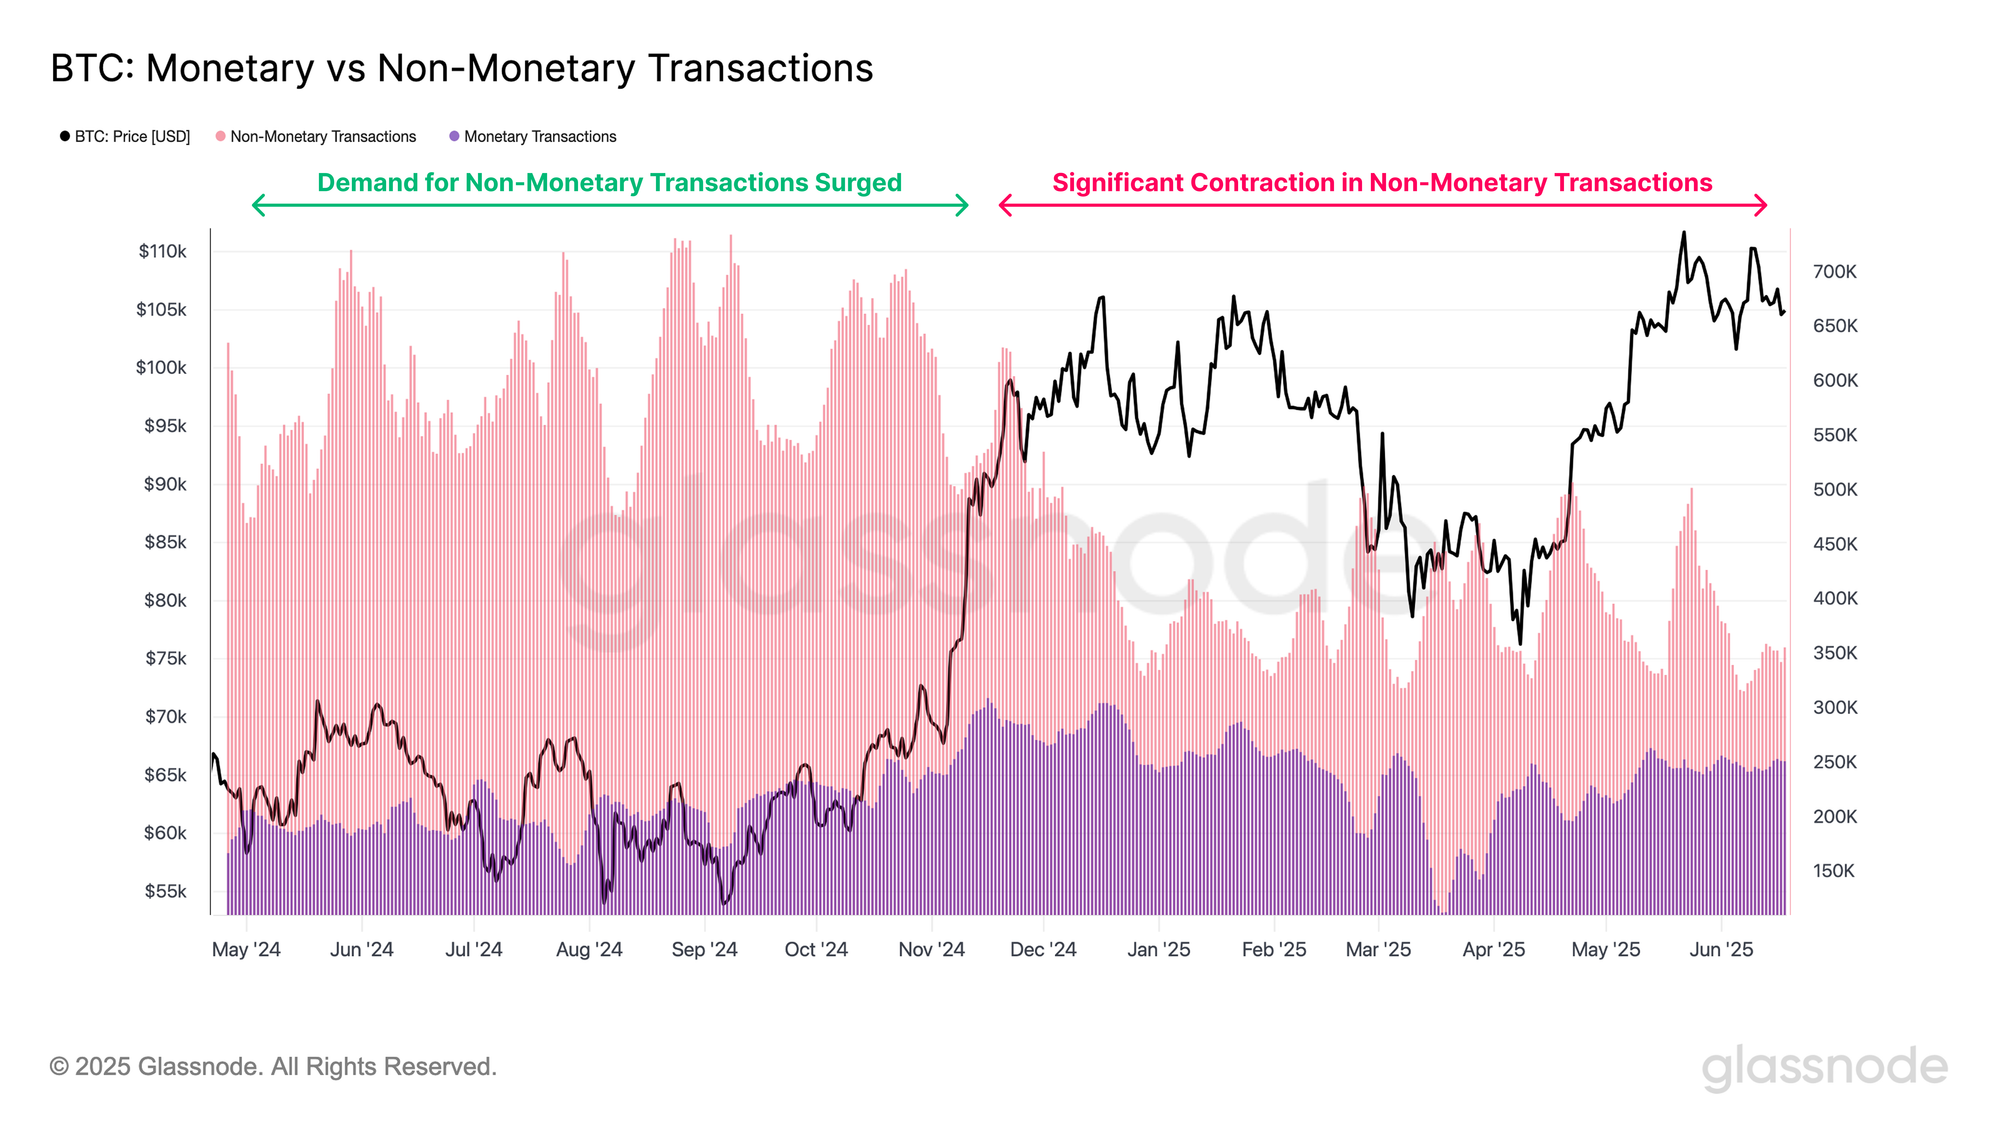
To better understand the nature of activity on the Bitcoin network, we can classify transactions into two categories:
- Monetary transactions, which involve the transfer of value.
- Non-monetary transactions, such as those related to Inscriptions and Runes, which embed arbitrary data via Taproot witness data and OP_RETURN fields, respectively.
The number of monetary transactions has remained relatively stable over the past year, suggesting a consistent base of value transfer activity. On the other hand, non-monetary transactions have exhibited a more volatile pattern. Between July and December 2024, demand for non-monetary transactions surged, significantly increasing the total transaction count. However, since the start of 2025, non-monetary activity has declined significantly, heavily contributing to the recent contraction in overall network throughput.
Volumes Remains Robust
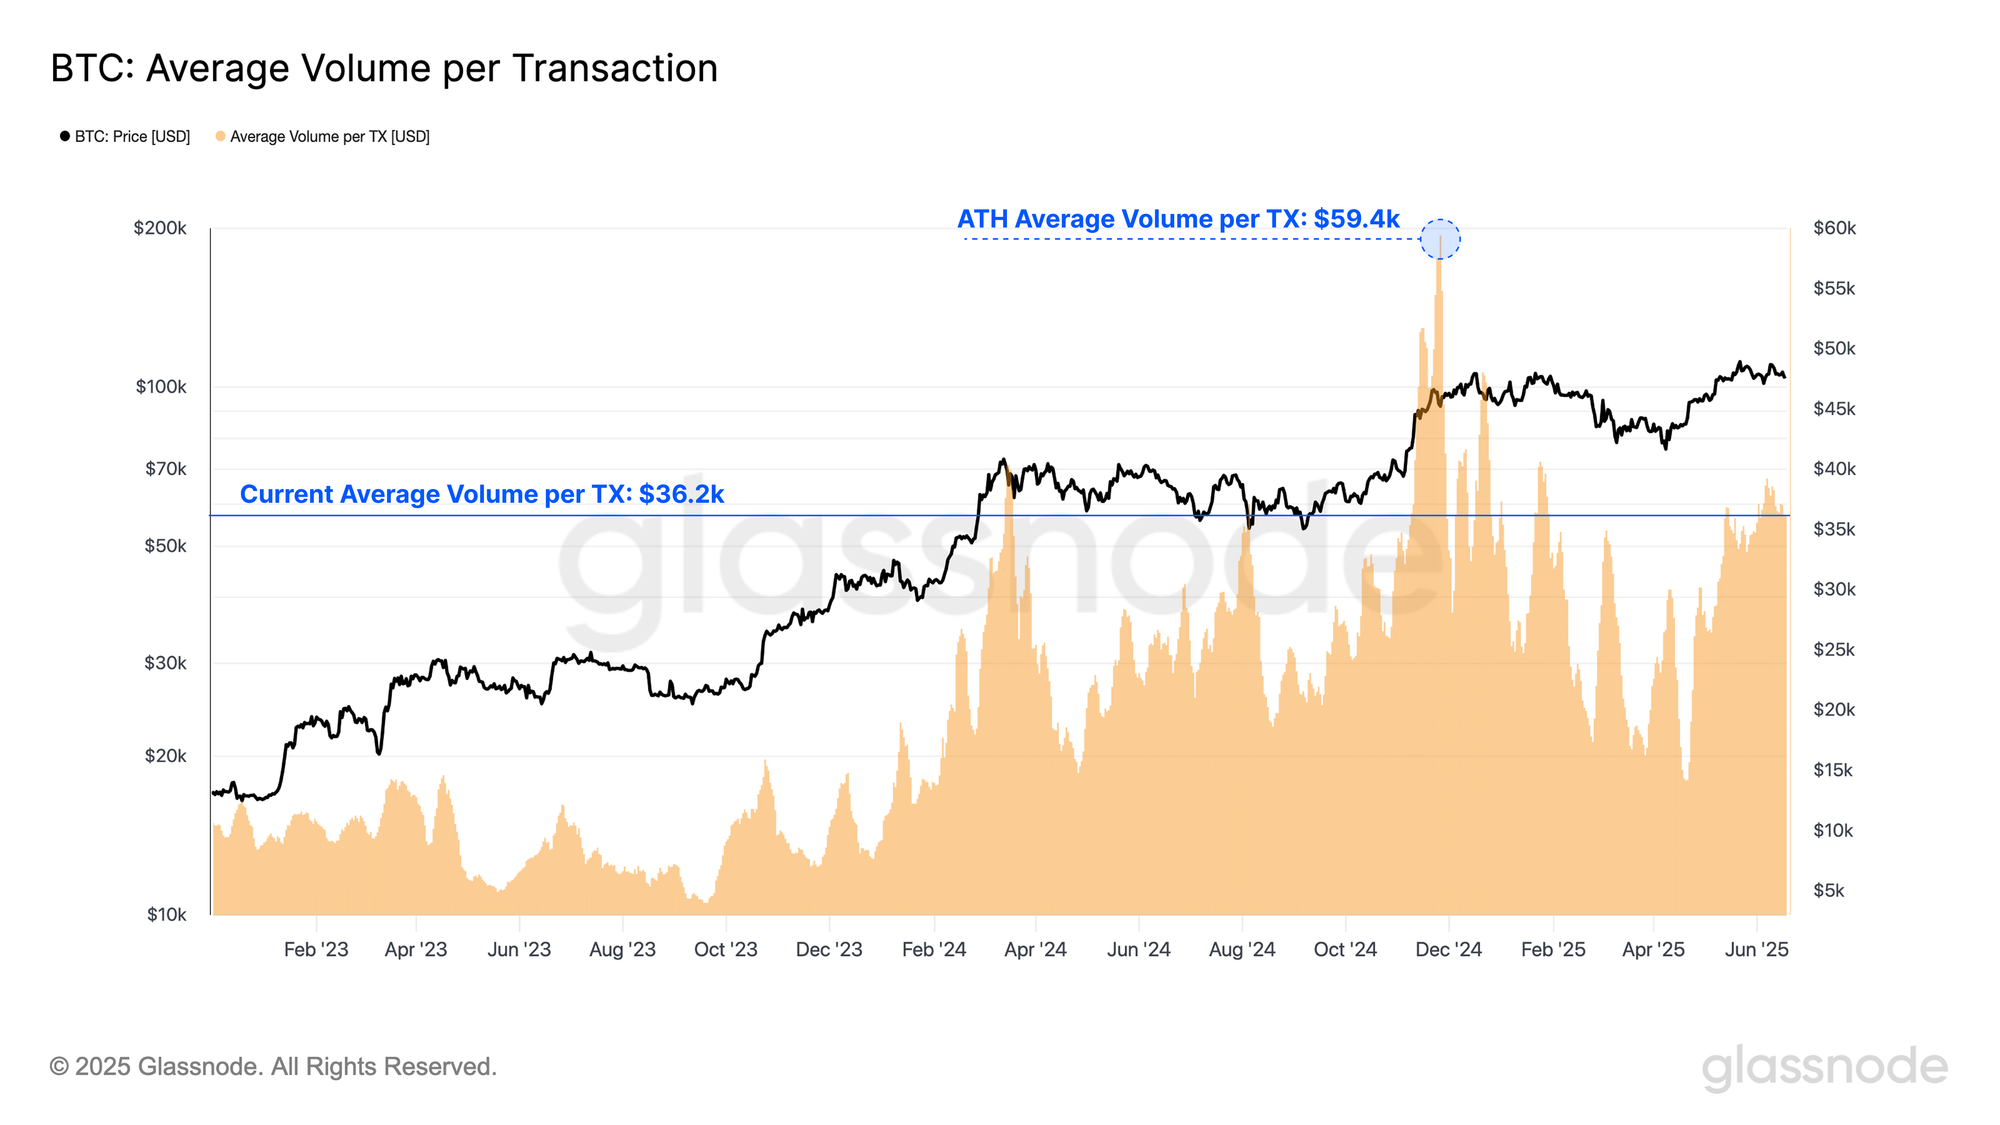
Despite this contraction in transaction counts, the economic volume settled on the Bitcoin network has remained historically elevated, with a yearly average of $7.5B settled per day, and hitting a peak of $16B during the $100k ATH price break in November last year.
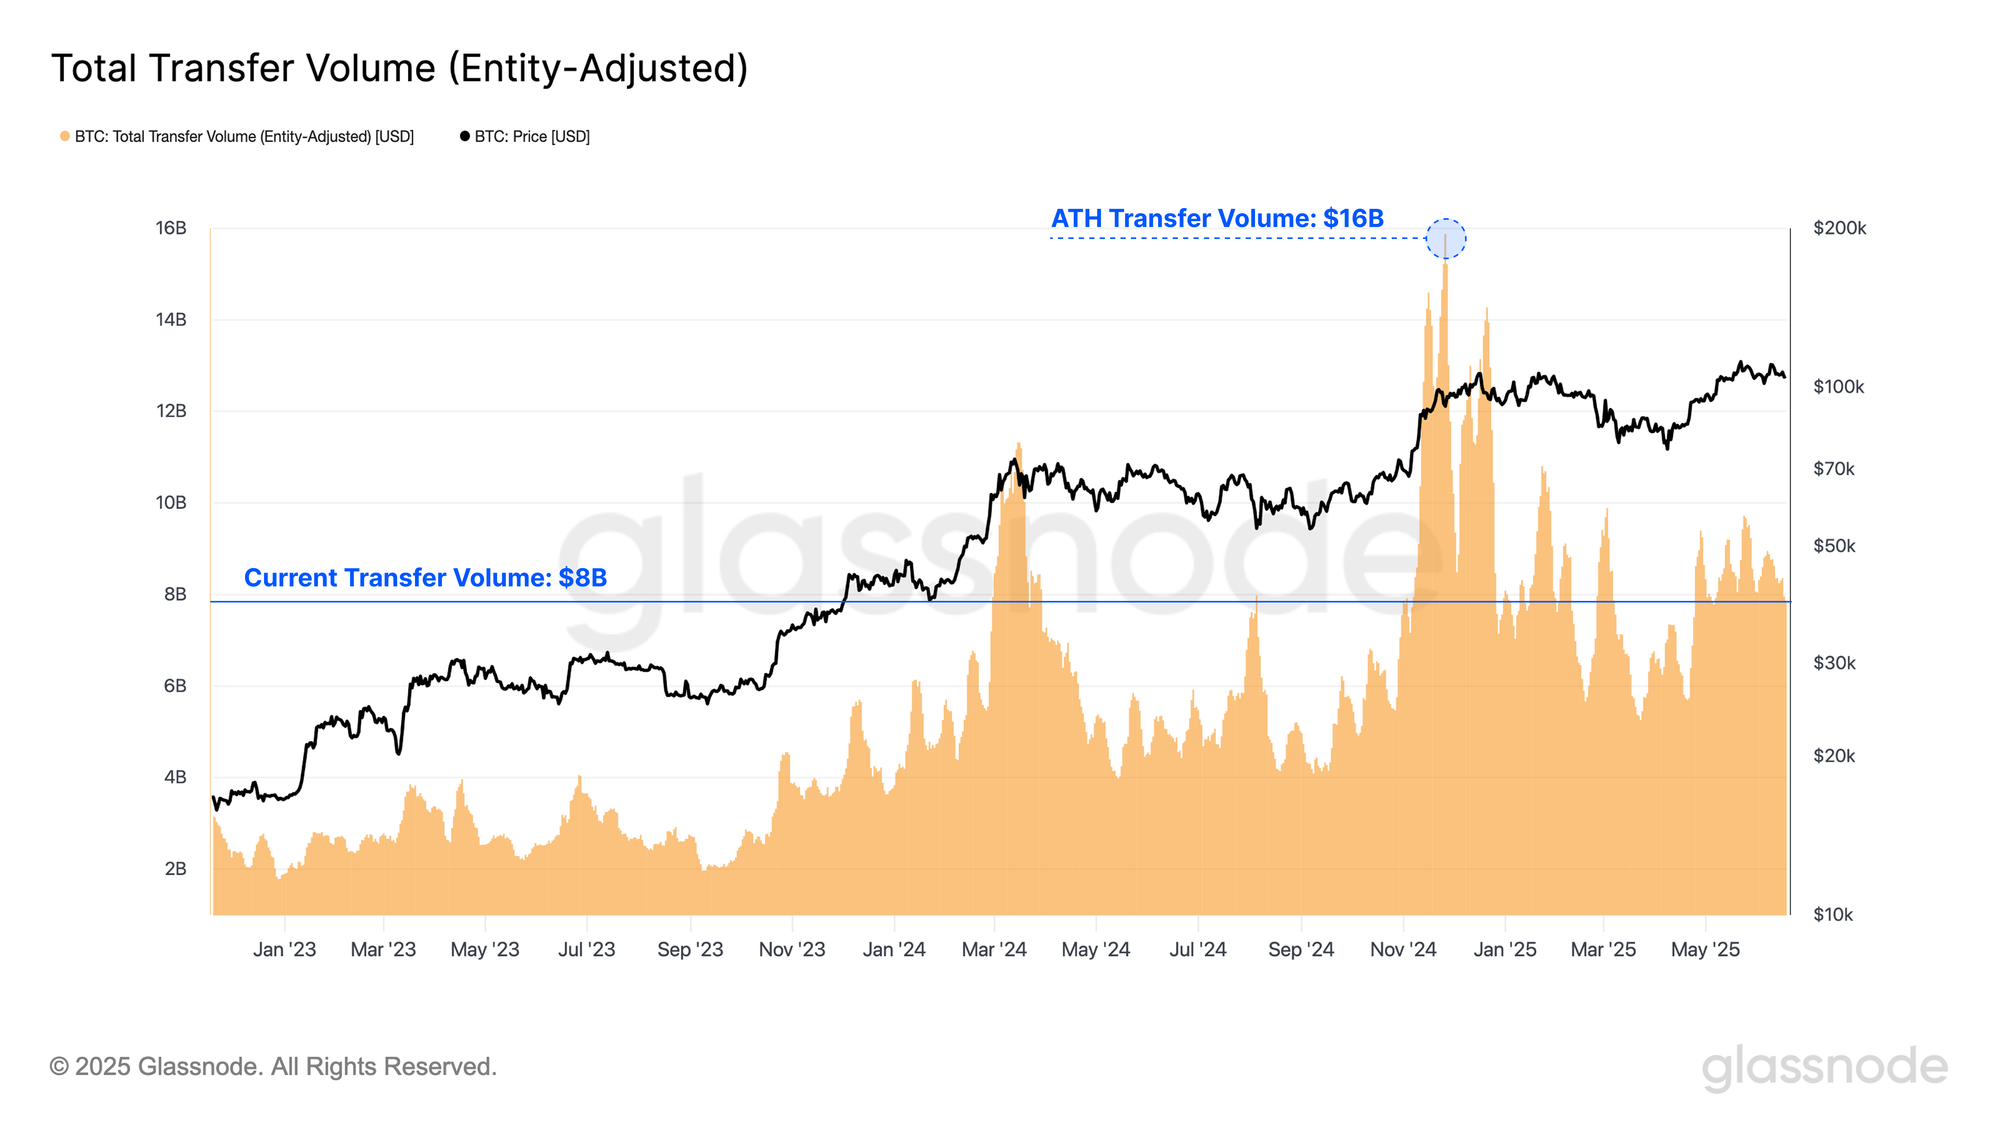
The average volume per transaction currently stands at $36.2k, suggesting that while fewer transactions are taking place, each transaction is carrying a significant value payload. This trend implies that larger entities continue to utilize the Bitcoin network, with the throughput per transaction rising even as overall activity by count declines.
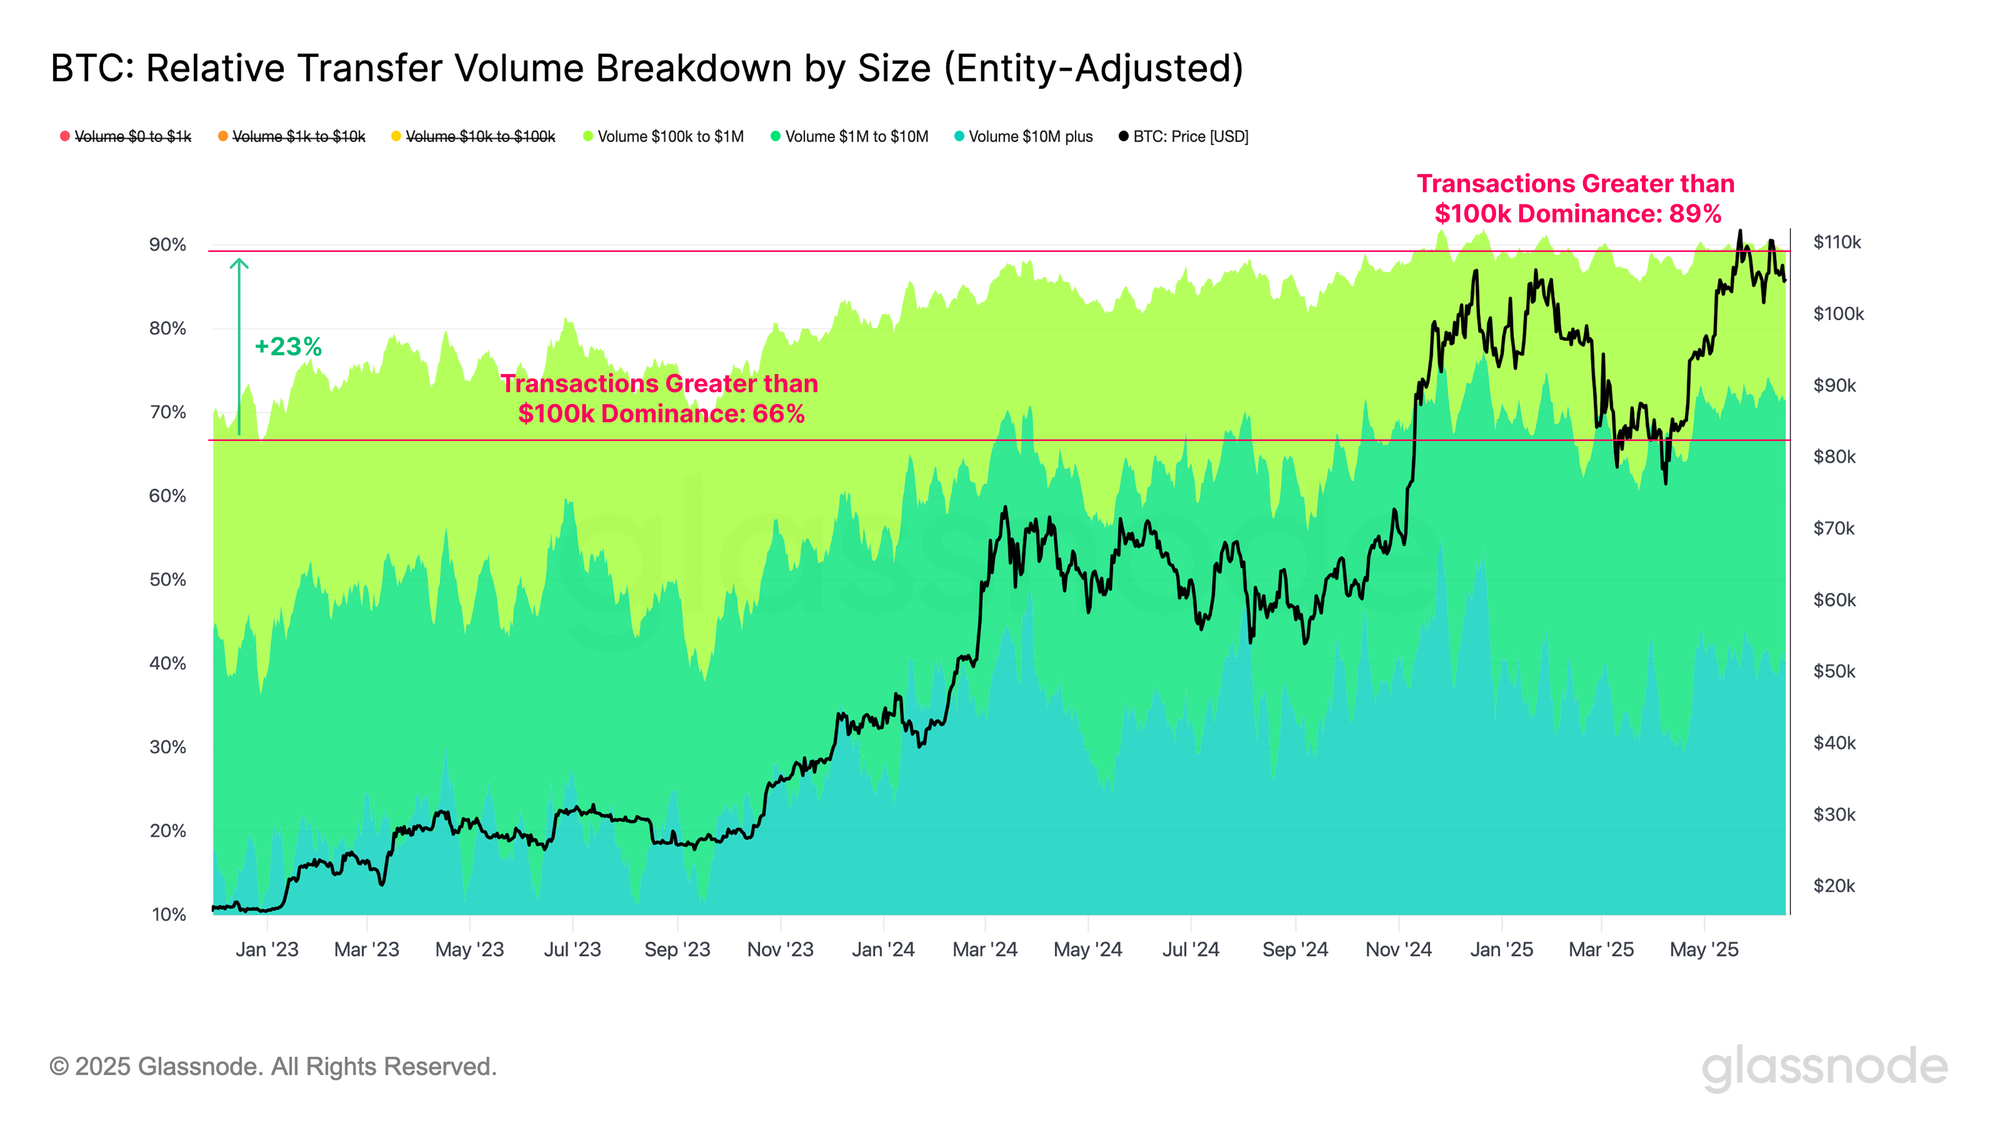
To evaluate the hypothesis that large entities are increasingly using the Bitcoin network for value transfer, we can analyze settlement volume by transaction size. Transactions exceeding $100k have shown a clear structural rise in dominance, accounting for 66% of network volume in November 2022, and increasing to 89% today. This trend reinforces the view that high-value participants are becoming increasingly dominant within on-chain activity.
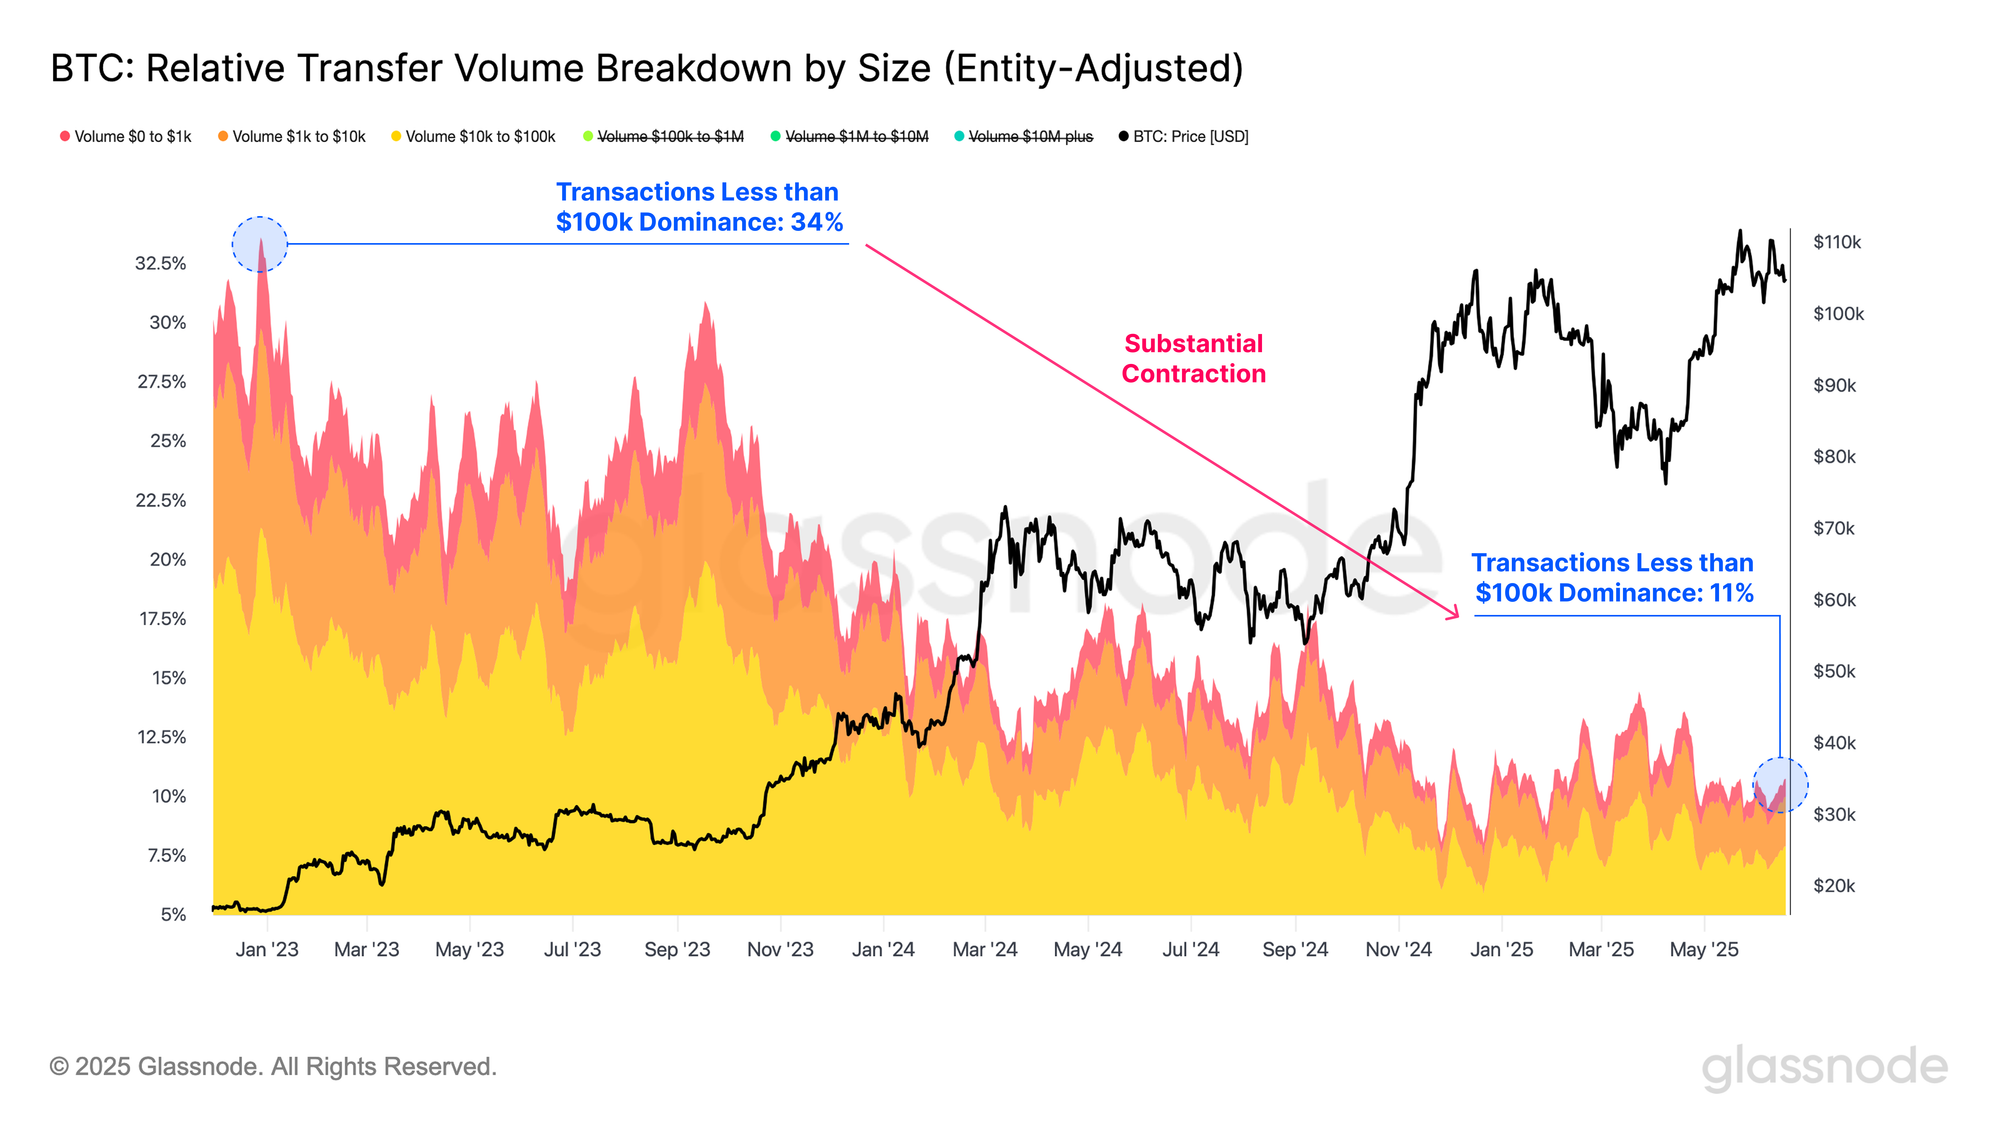
Conversely, volume in transactions spending $100k or less have undergone a meaningful contraction over the same period. After peaking at a relative dominance of 34% in December 2022, this cohort’s share of total transfer volume has declined structurally to just 11% today.
A more granular breakdown of the individual sub-cohorts reveals that this trend is consistent across the board, with each group experiencing a meaningful decline in their share of network volume.
- $0-$1k: 3.9% to 0.9%
- $1k-$10k: 8.4% to 2.1%
- $10k-$100k: 21.4% to 7.9%
Fee Pressure at Historical Lows
Over the years, Bitcoin transaction fees have been influenced by both technical upgrades, and shifting usage patterns. The introduction of SegWit reduced the effective size of transactions, offering fee discounts, while exchange batching has become an industry standard practice, which further improved efficiency by consolidating multiple withdrawals into single transactions. More recently, Inscriptions and Runes, which embed arbitrary data onto the blockchain, have led to periodic fee surges, often congesting the network.
Historically, fee pressure has served as a reliable proxy for network demand, rising sharply when block-space is small relative to overall transaction demand. Fees inherently function as a release valve in high-pressure environments, where limited block-space forces users to compete for transaction inclusion and ordering. Thus, elevated fees are often indicative of heightened demand for block space, signalling periods of intense user activity and often speculative interest.
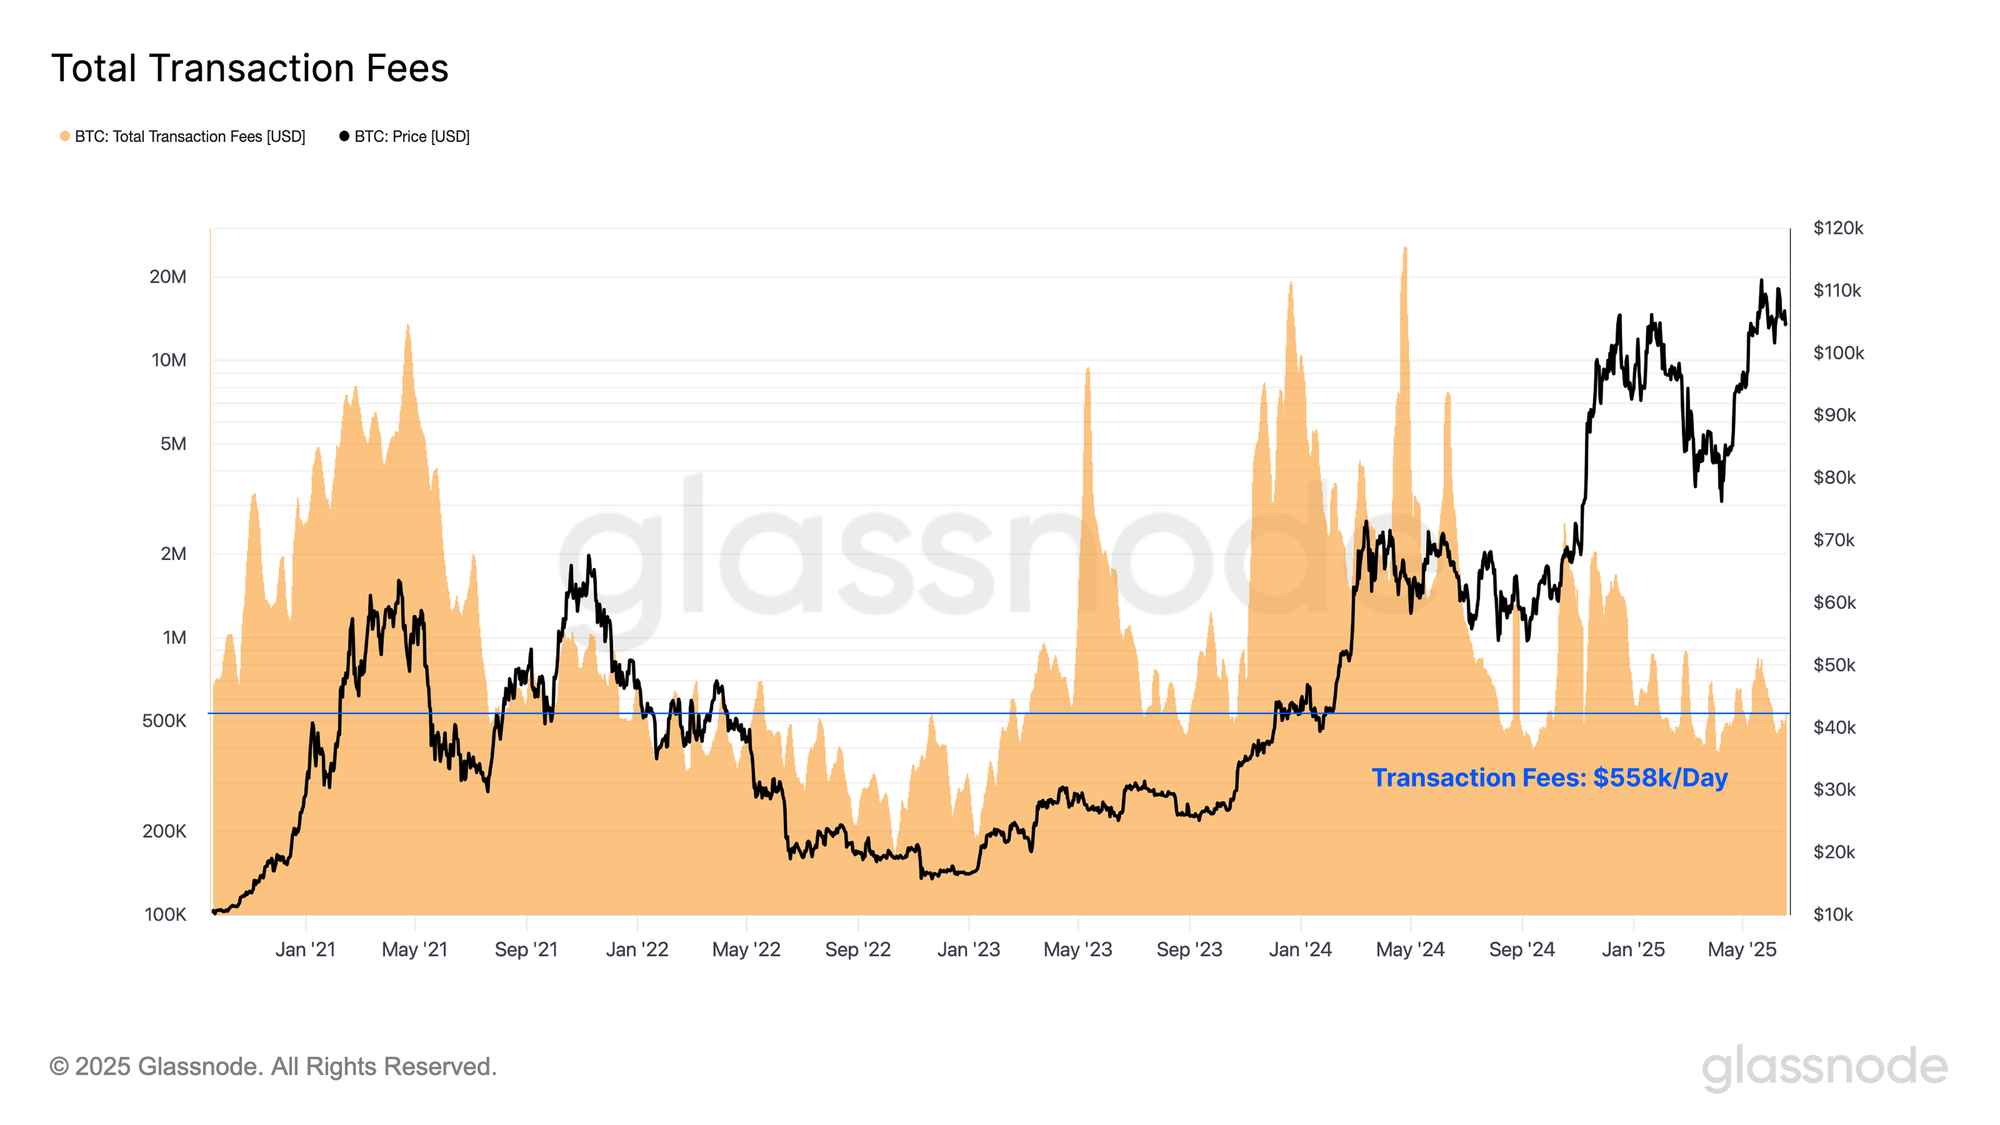
Over the past few months however, miner revenue from transaction fees has declined significantly, averaging just $558K per day over the last month. This subdued fee pressure indicates a notable drop in block-space demand, sending a similar signal to the overall reduction in transaction counts.
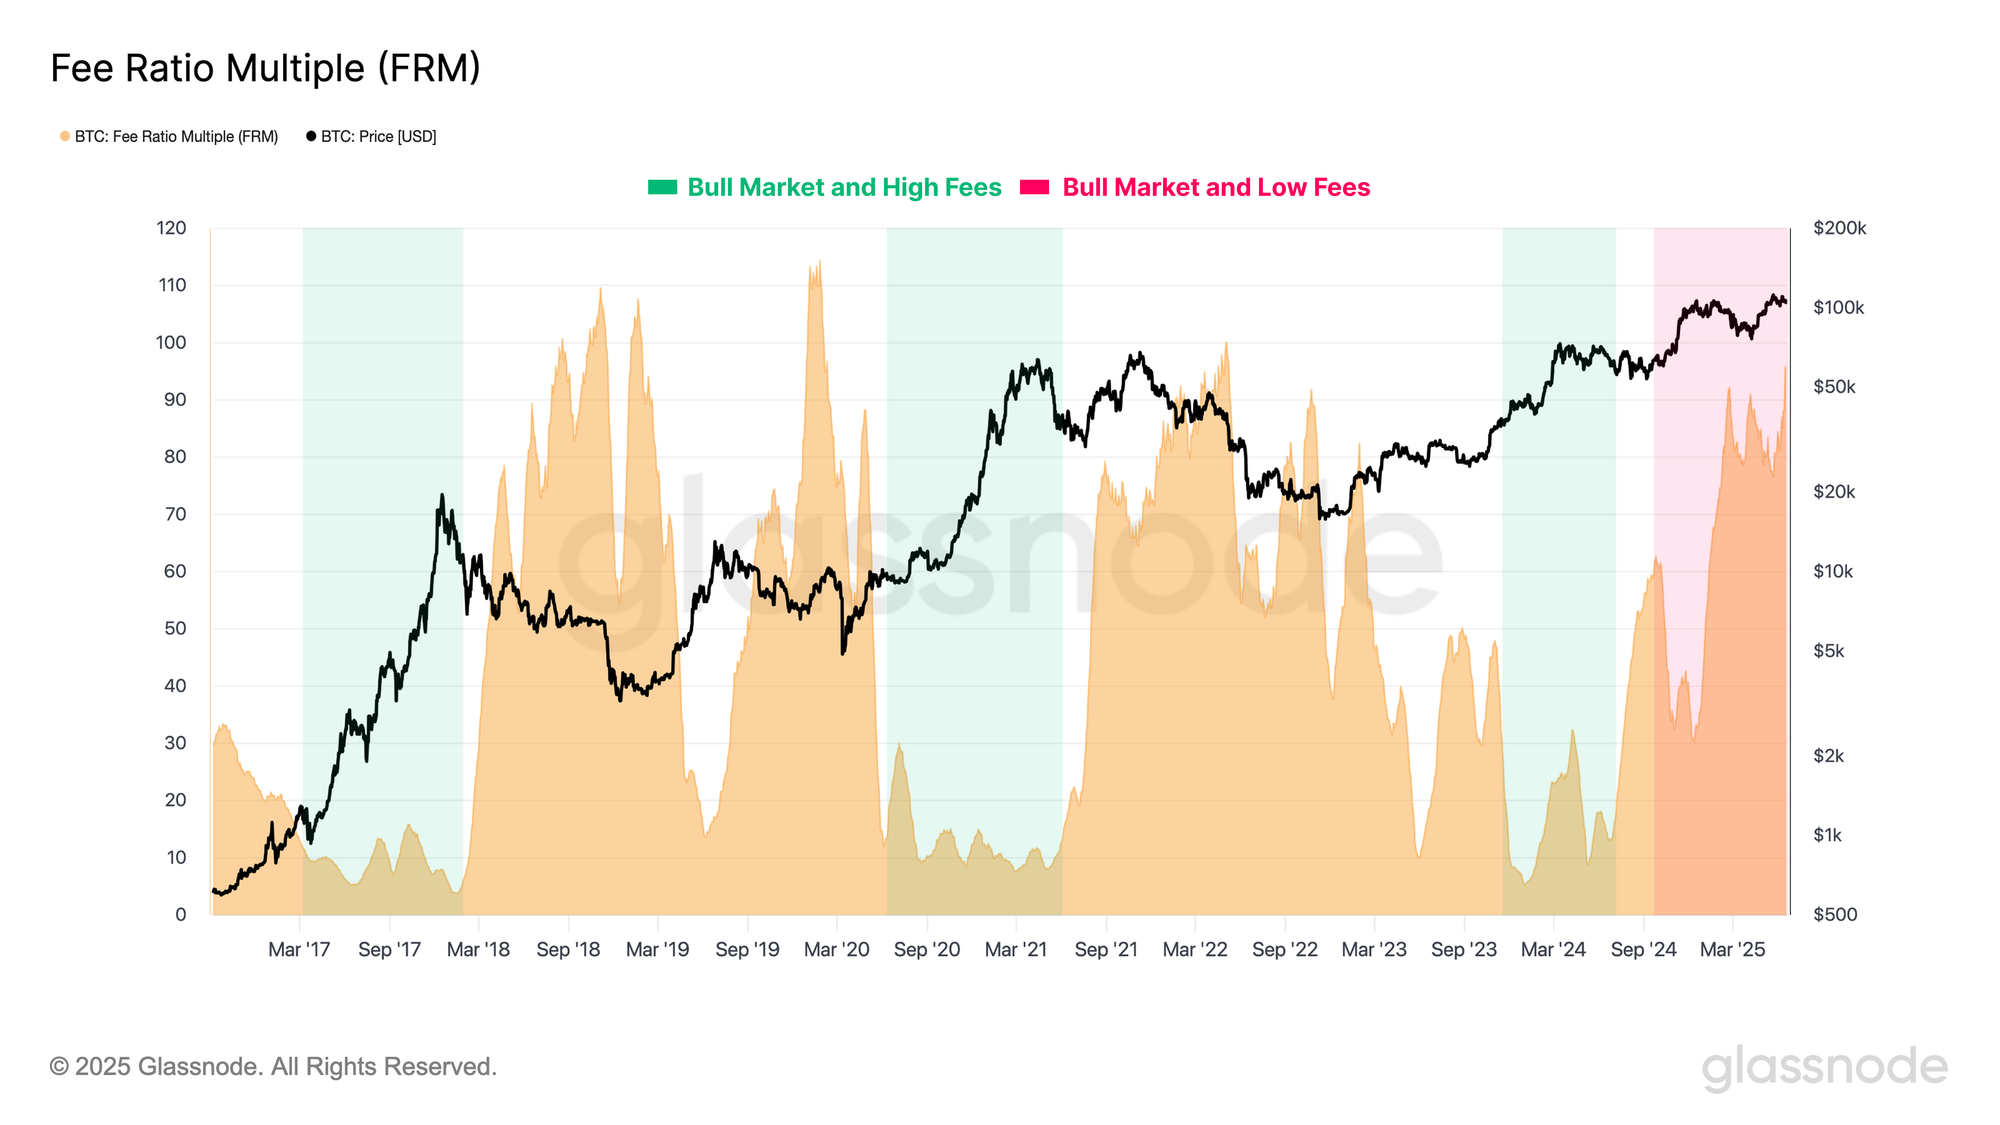
The Fee Revenue Multiple (FRM) compares the ratio between total miner rewards (block subsidy and transaction fees) to just fees alone. This ratio offers insight into the composition and dominance of miner income.
During previous bull markets, and commonly around all-time high formations, this ratio tends to compress, with fee pressure surging in response to heightened network activity, and increased demand for transaction inclusion.
However, our current cycle presents a somewhat unique market structure, with the FRM ratio remaining unusually elevated, despite Bitcoin trading just below its all-time high. This divergence underscores that there is currently a relative lack of fee-pressure, suggesting on-chain activity is surprisingly quiet, especially for a market trading to close to the all-time-high price.
Heightened Off-Chain Volume
The Bitcoin economy consists of both on-chain and off-chain components, each playing a critical role in the asset’s market dynamics. As Bitcoin matures and the range of available financial instruments expands, centralized exchanges have become increasingly influential. These platforms facilitate the majority of trading activity and serve as key venues for price discovery.
As a result, evaluating off-chain activity on exchanges is an essential input for constructing a holistic view of the activity encompassing the Bitcoin ecosystem.
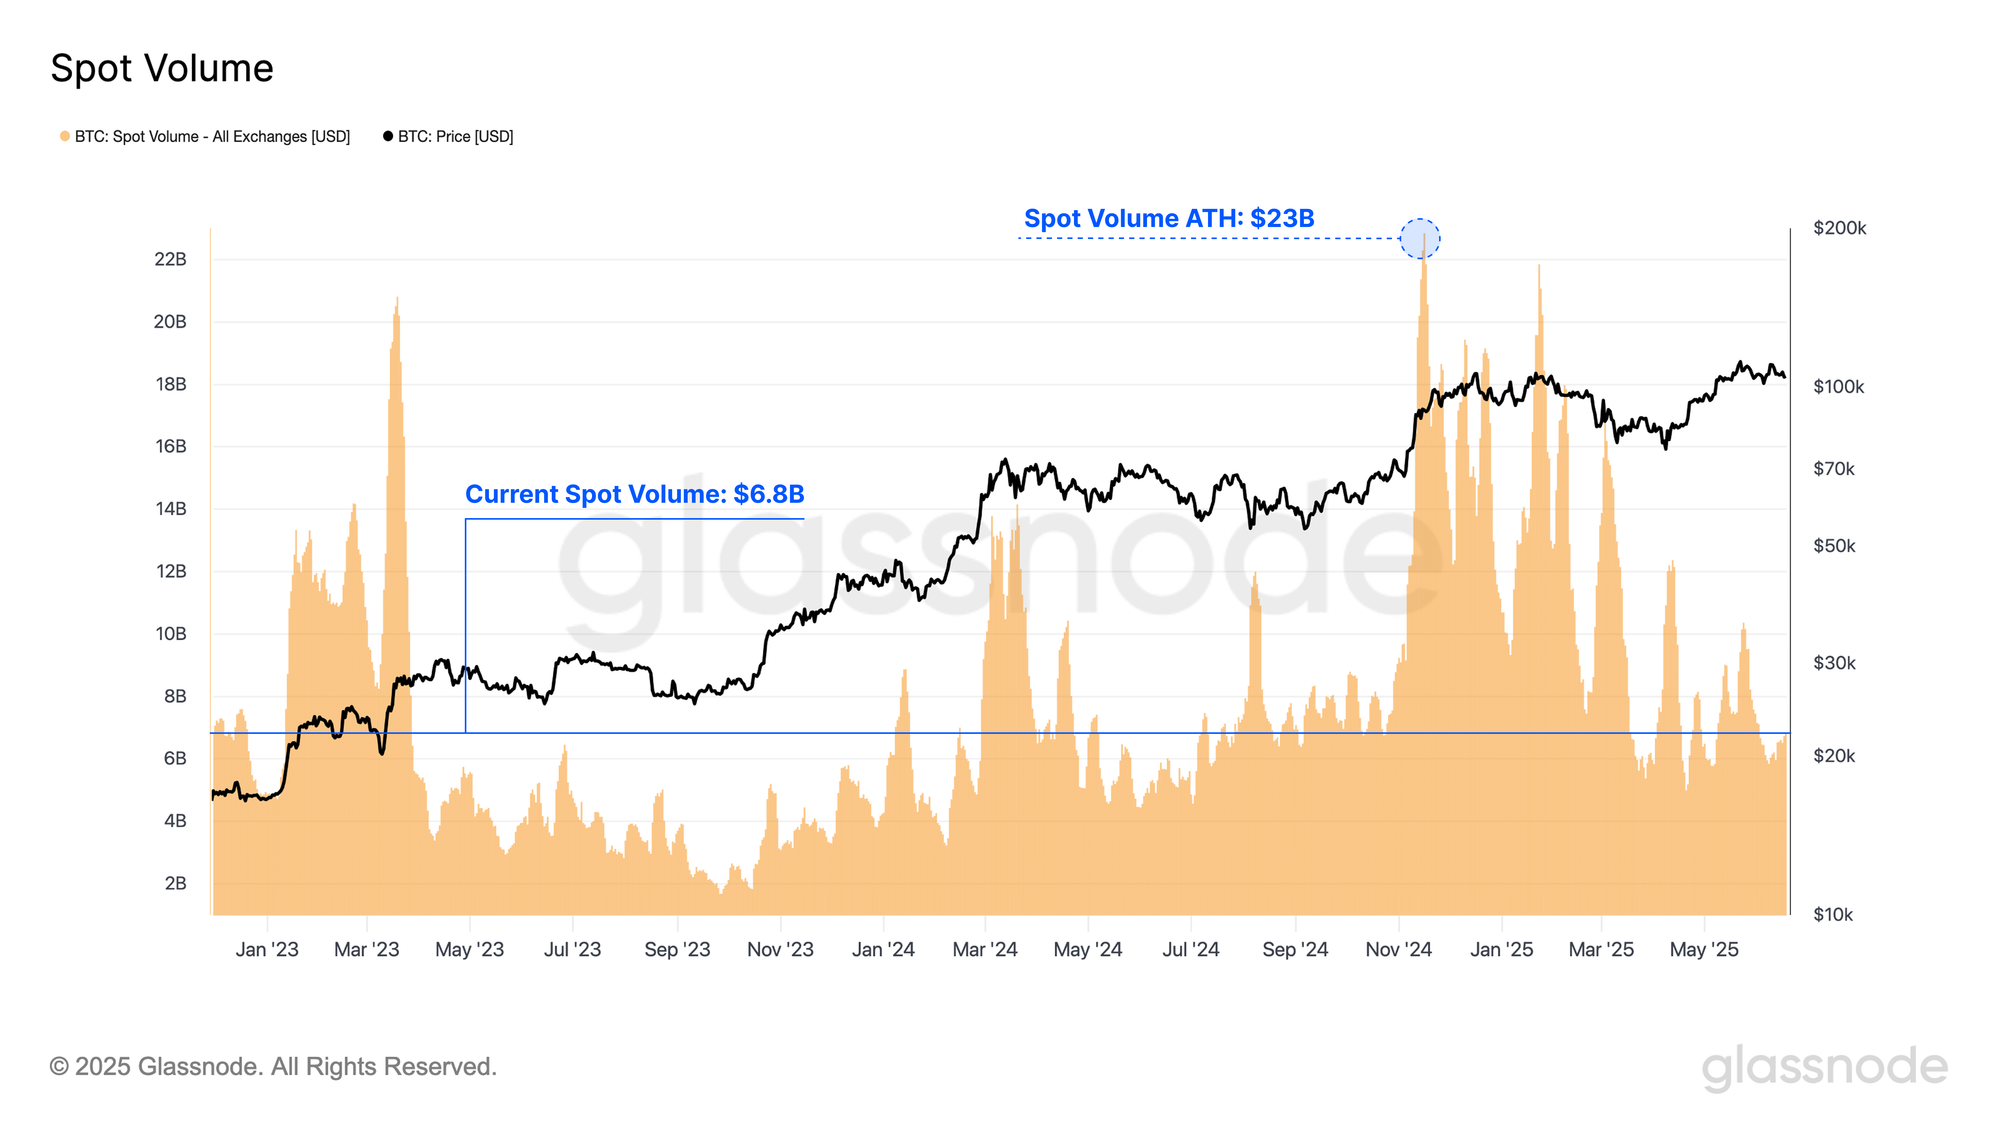
Starting with the spot market, trading activity across centralized exchanges has remained strong over the past year, averaging $10B in daily volume, and peaking at $23B in November 2024. Notably, this magnitude of spot volume is often comparable in size to the volume settled on-chain each day, highlighting the parallel scale of activity between the spot market and the base layer network.
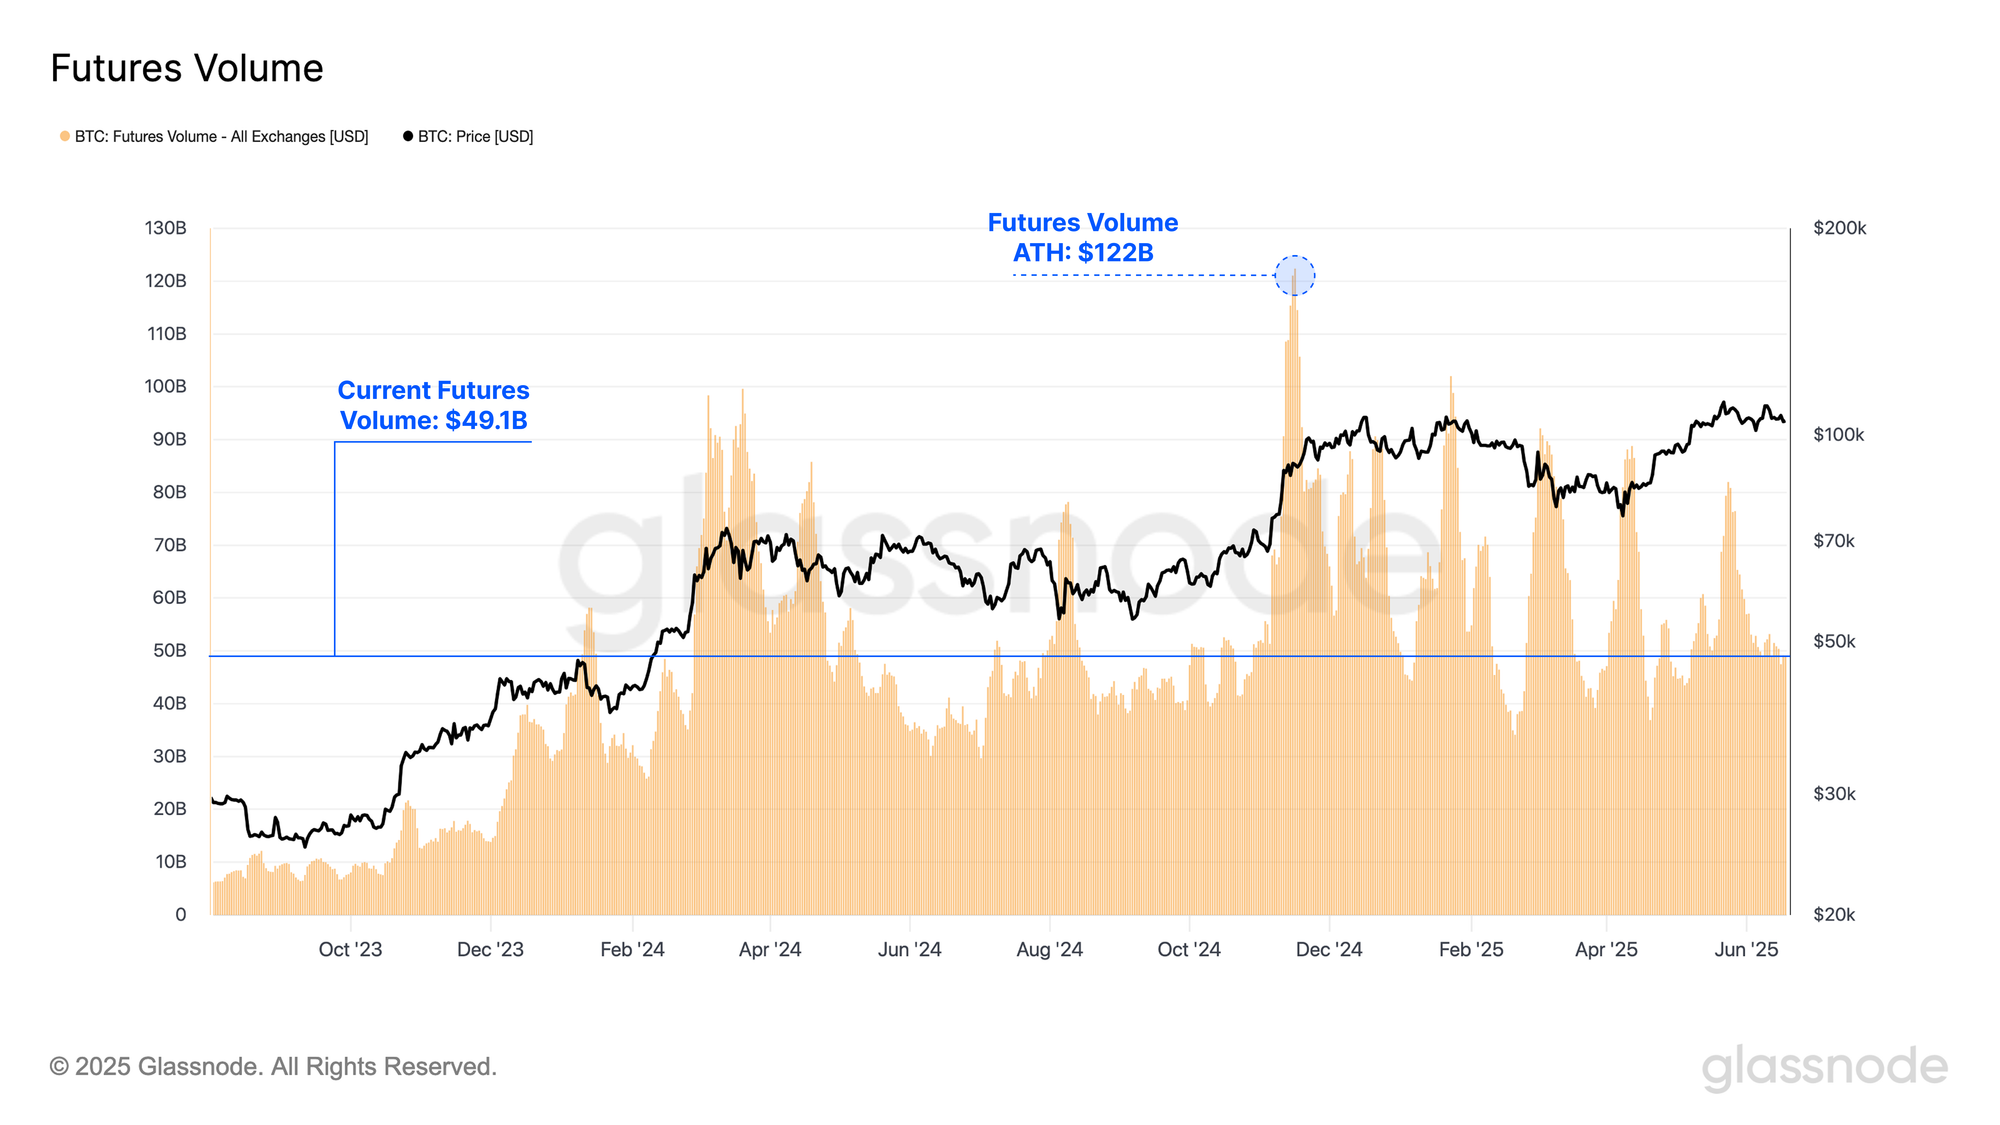
Moving towards the derivatives market, futures volume in both perpetual and calendar contracts experience the largest amount of volume traded by a wide margin, and are typically an order of magnitude larger than on-chain, spot, and options volume.
Trading activity across futures contracts has experienced substantial growth this cycle, averaging $57B/day traded over the past year. Furthermore, futures volume reached a staggering peak of $122B/day in November 2024. The magnitude of volume traded in futures markets highlights how dominant these preferred instruments are for both speculators, traders, and for hedging risk.
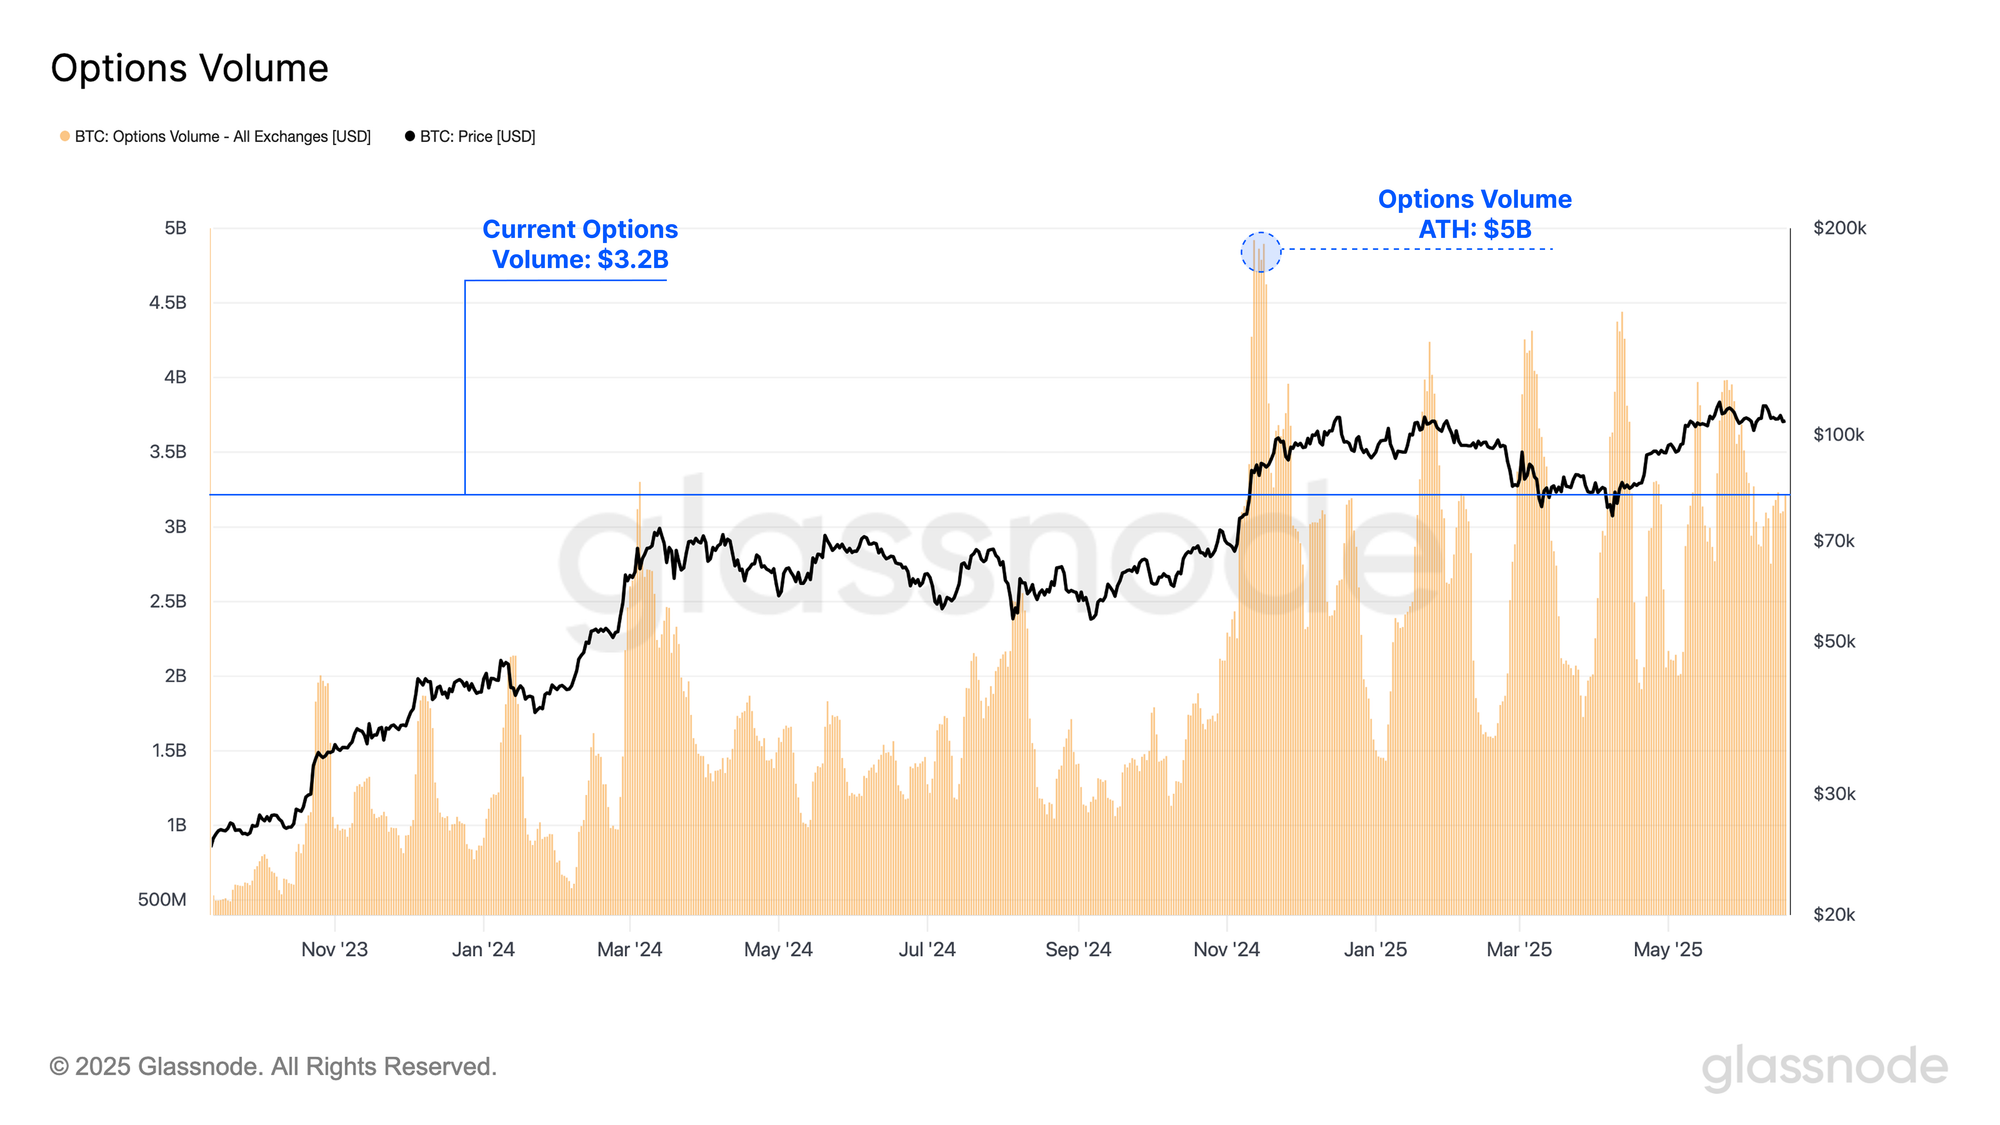
Additionally, options trade volume has experienced a significant uptick over the course of this cycle, now averaging $2.4B per day over the past year, and reaching a peak of $5B/day. This surge highlights the growing usage of options contracts by sophisticated market participants, with investors increasingly utilizing options to implement advanced risk management strategies and fine-tune their market exposure.
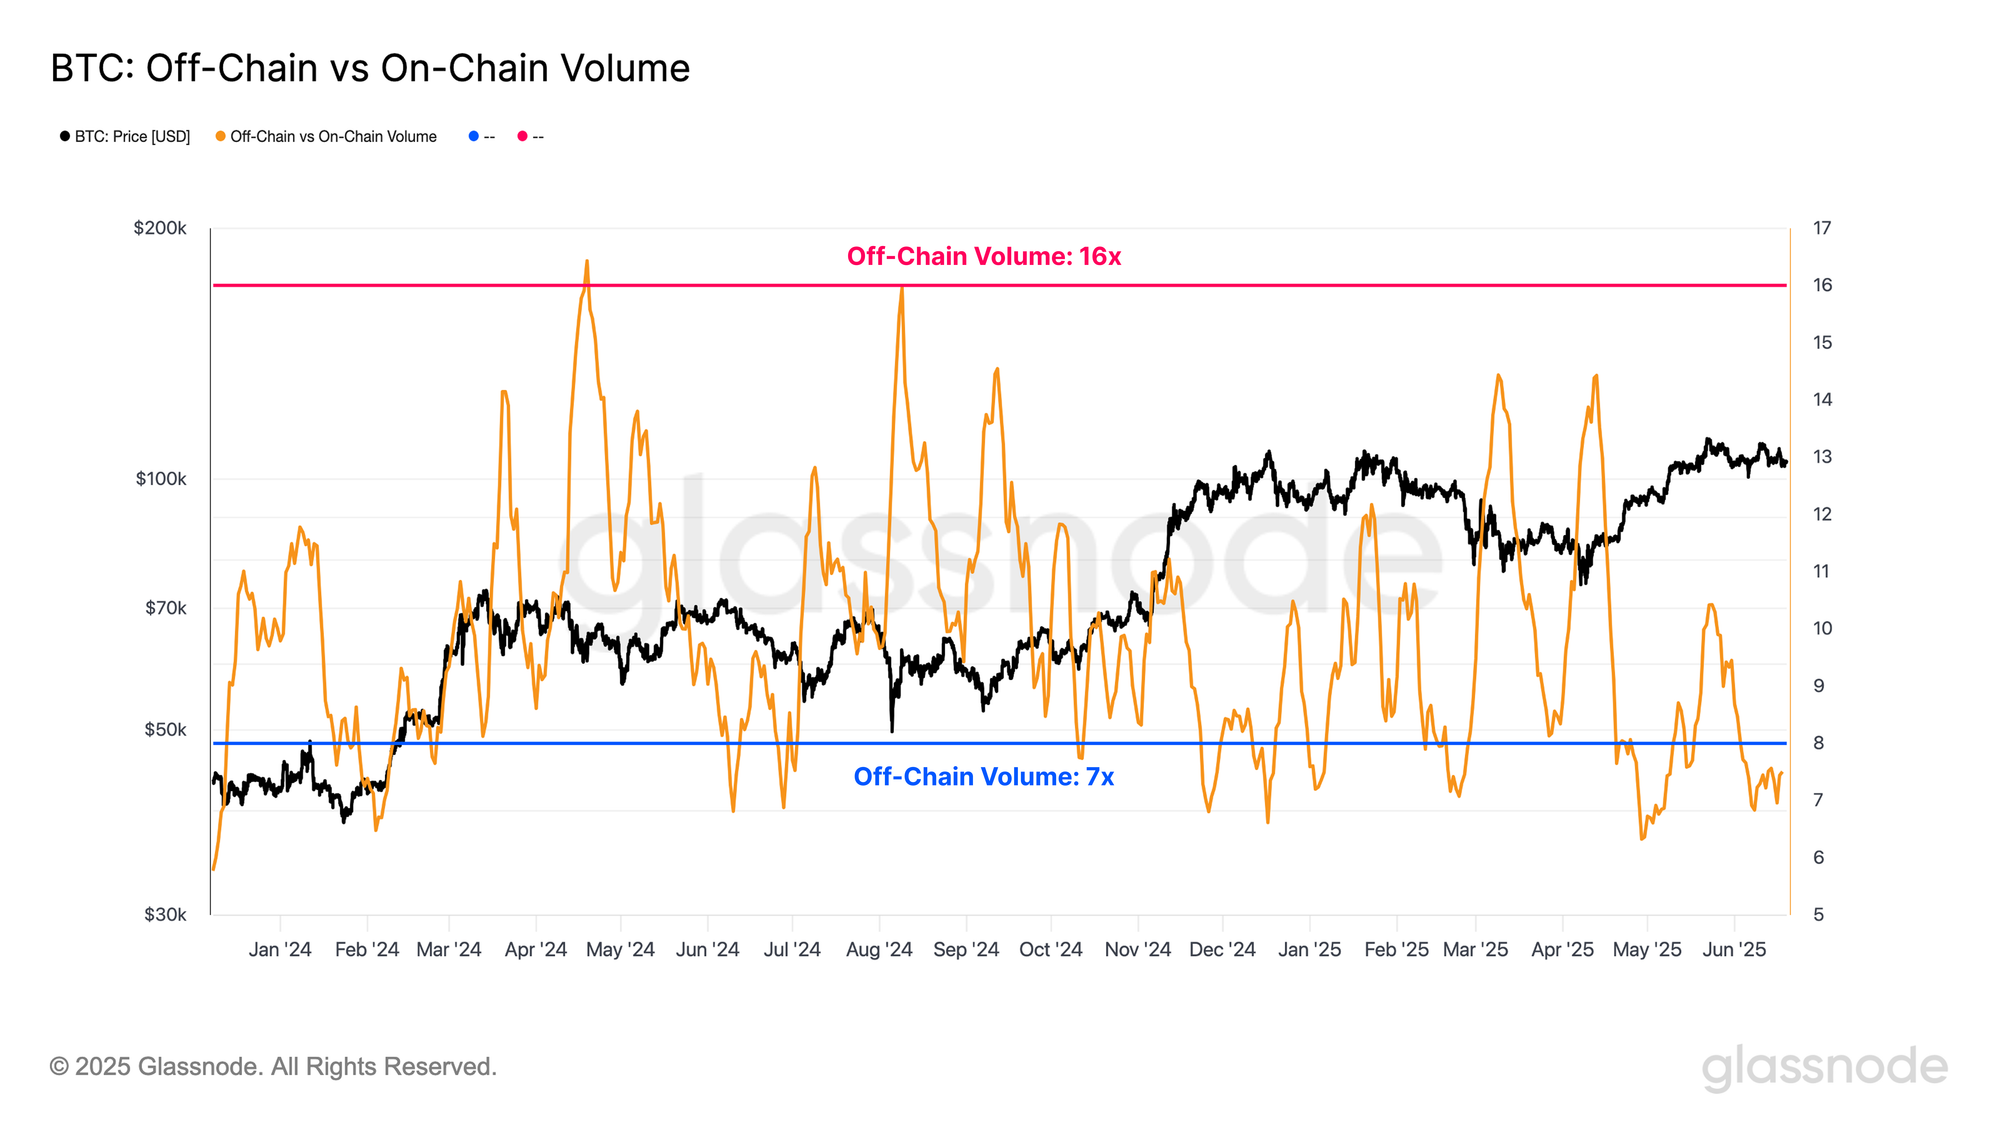
The growth of spot and derivative volumes highlights a shift in activity, with an ever growing share of volume migrating from the Bitcoin base layer towards off-chain venues. When comparing the volume traded off-chain (spot, futures and options), to value settled on the network, we note off-chain volume has regularly been 7-16x larger than the on-chain volume.
This transition can significantly impact how we interpret network metrics, as traditional indicators may no longer capture the full scope of market activity. Nevertheless, the on-chain market remains at the heart of the Bitcoin economy, forming the foundational layer upon which the wider ecosystem operates. Deposits and withdrawals serve as the primary link between off-chain platforms and the Bitcoin network, and it remains very likely that on-chain activity will continue to play a vital role in market structure and capital flows.
Leverage Build Up
Now that we have established the growing relevance of derivatives within the Bitcoin ecosystem, we now turn our attention to the open interest held across both futures and options contracts to evaluate the build-up of leverage in the market.
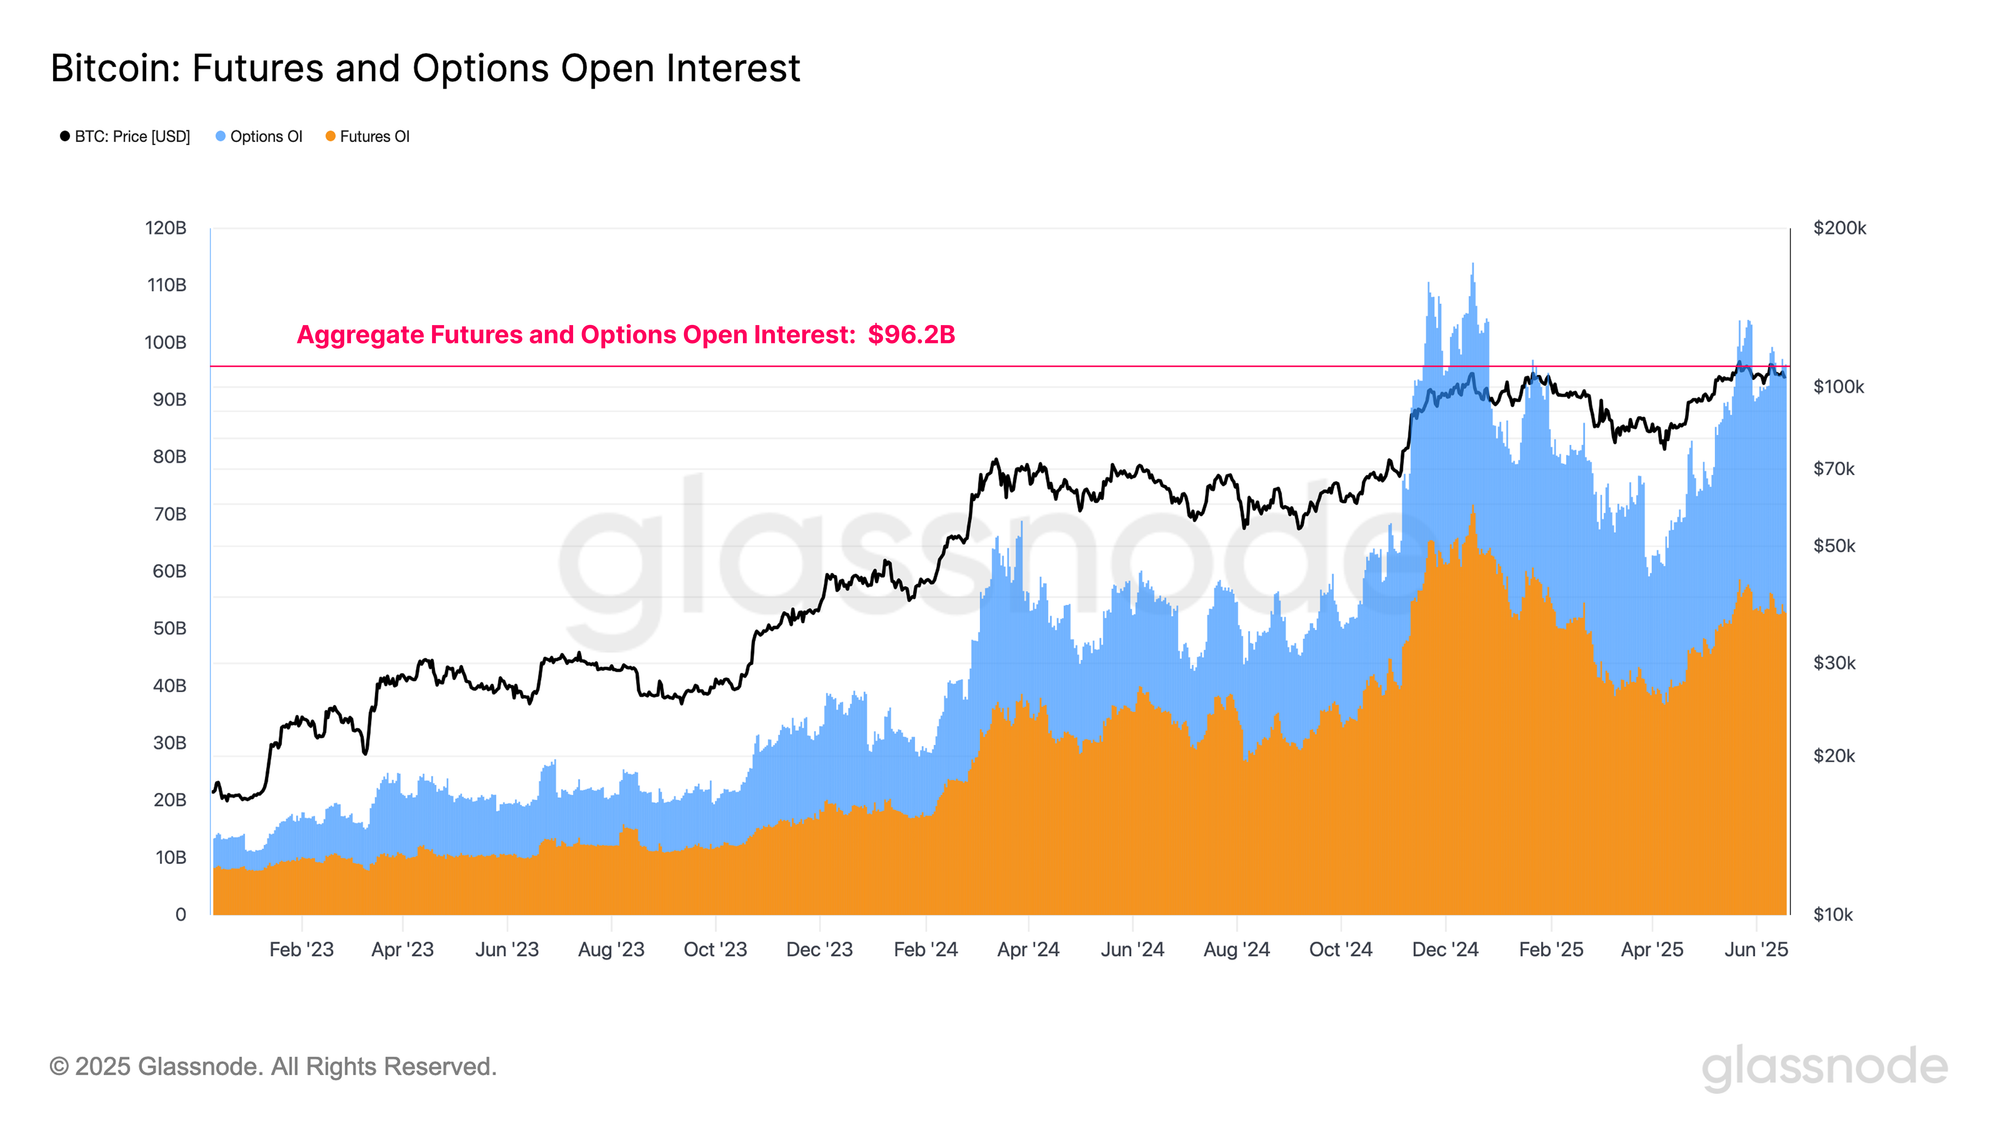
Both markets have experienced remarkable growth in OI over last few years, with futures open interest rising from $7.7B to $52.8B, and options expanding from $3.2B to $43.4B. Combined, total derivatives open interest peaked at $114B and remains elevated at approximately $96.2B. This sustained expansion reflects a significant build up of leverage within the Bitcoin economy, potentially heightening the risk of volatile price swings.
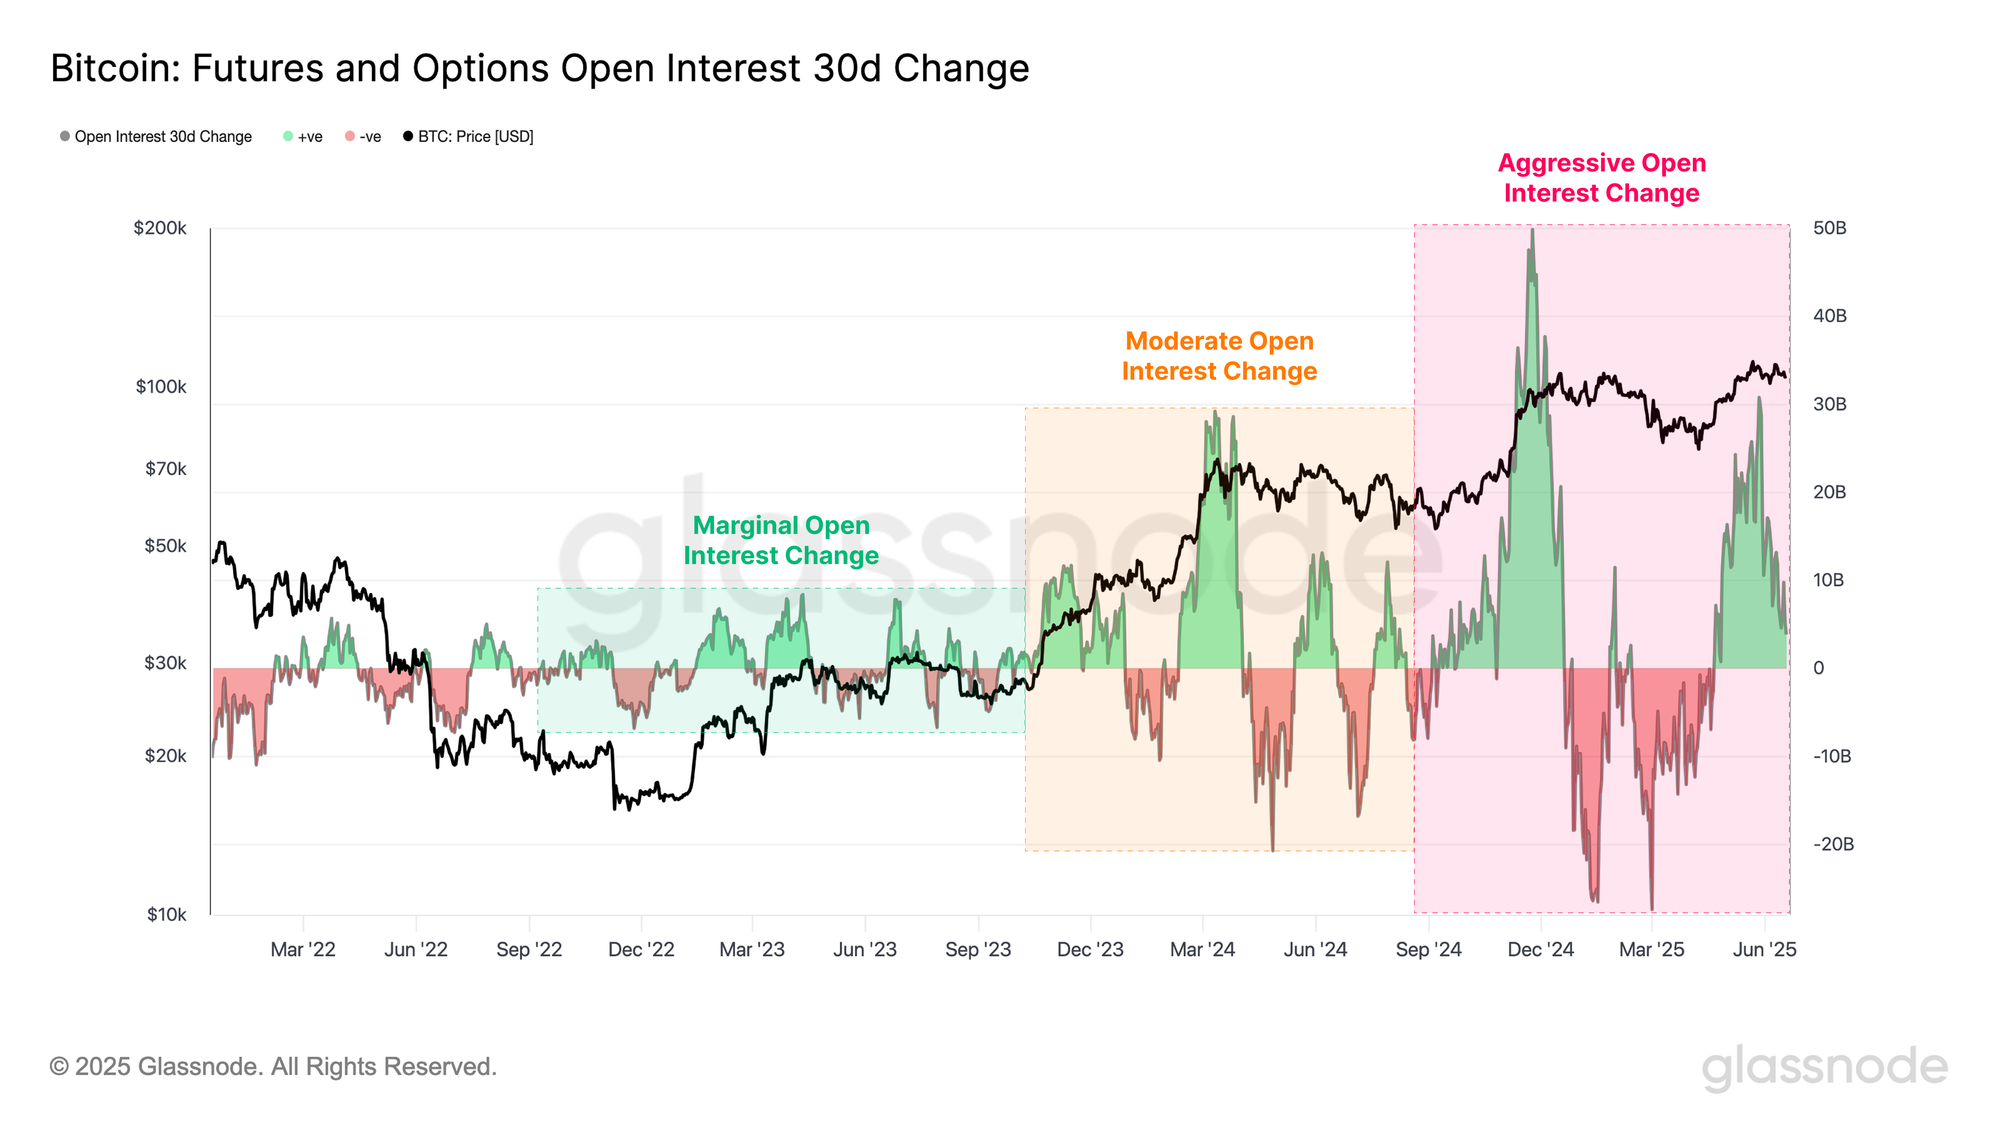
When assessing the 30-day change in aggregate open interest, we observe that the magnitude of fluctuations has been accelerating. Throughout the 2023 calendar year, changes in open interest remained relatively muted, however, following the introduction of US Spot ETFs in January 2024, these fluctuations began to intensify.
This growing volatility in open interest signals a broader market transition, from one primarily driven by spot activity, to a more derivatives-led structure. Such a shift increases the risk of cascading liquidations and contributes to a more unstable and reflexive market environment.
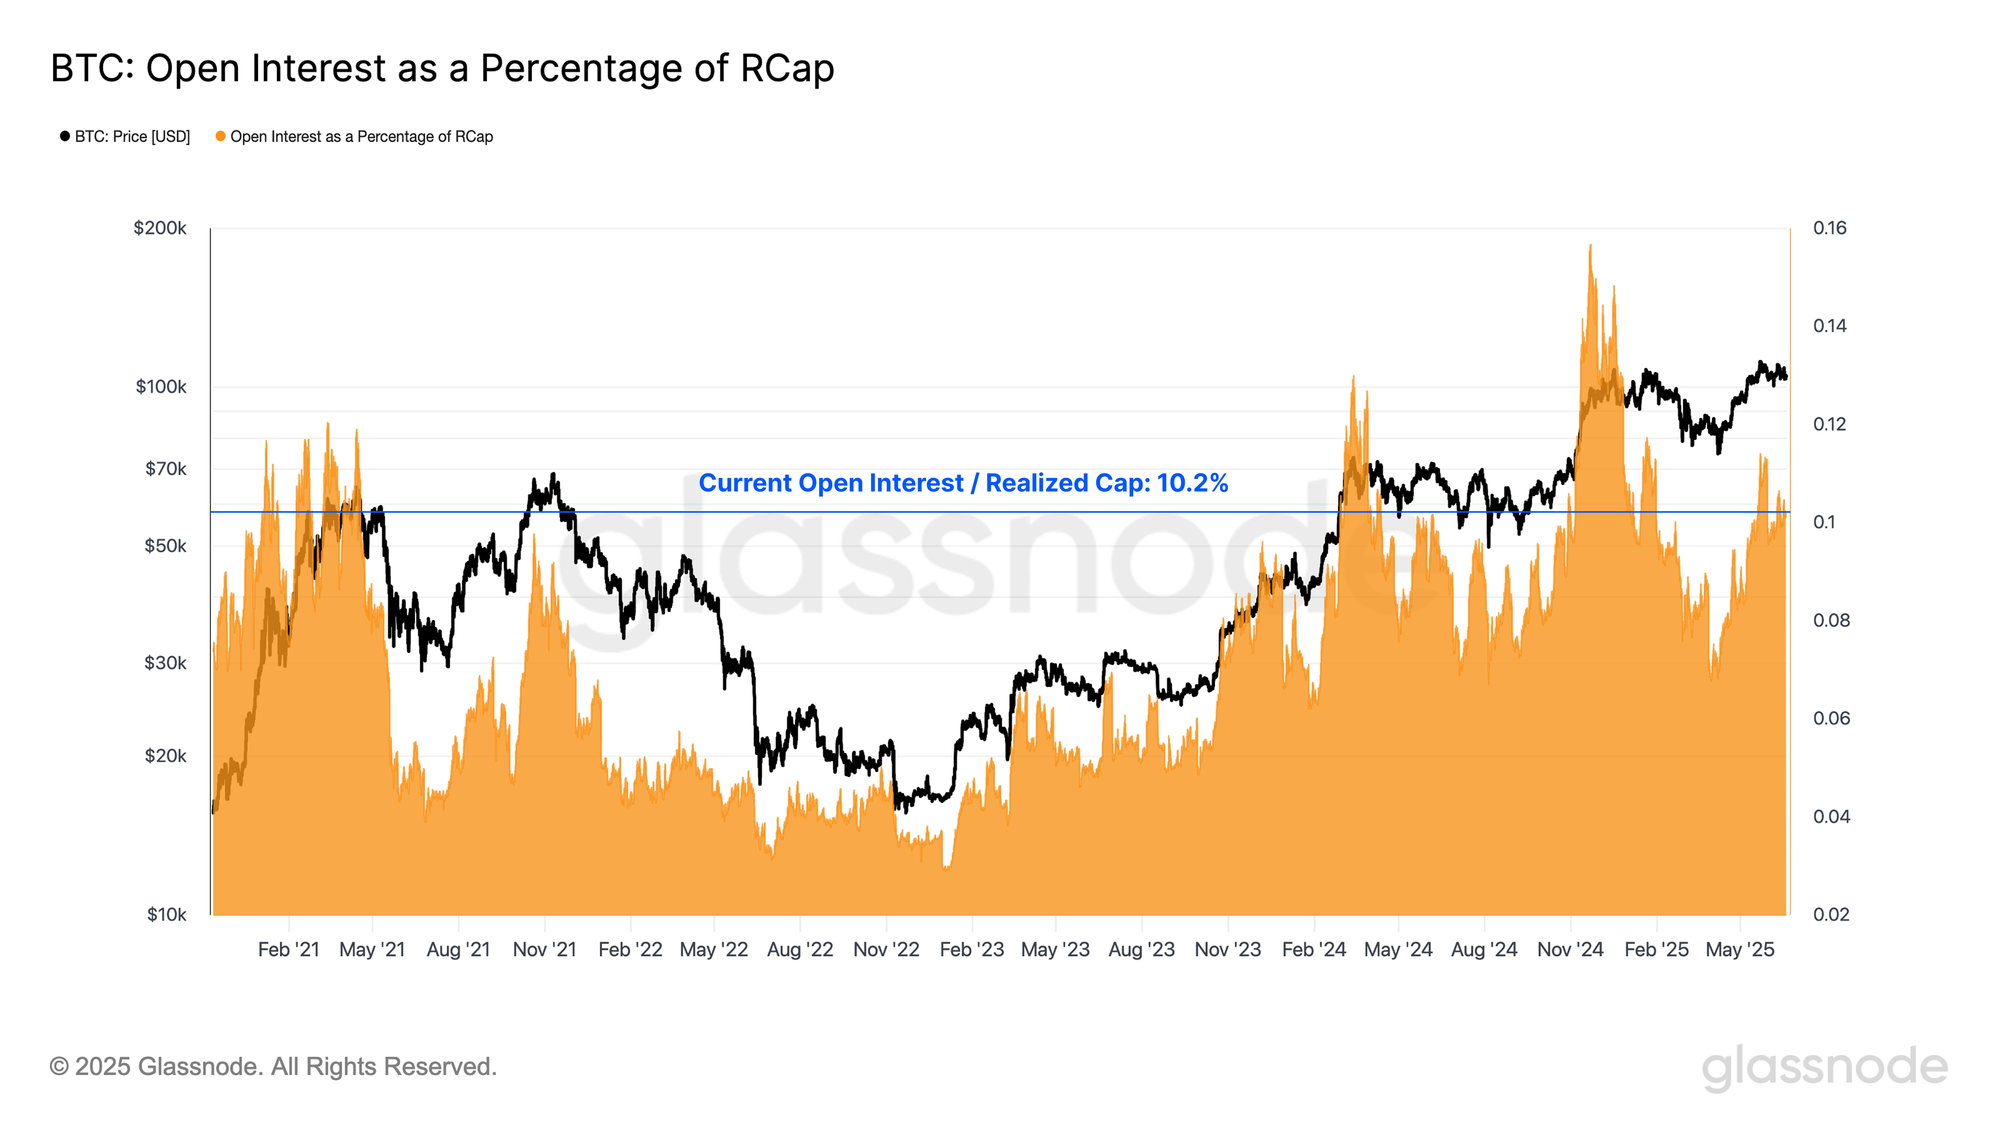
To quantify the buildup of leverage, we calculate the Realized Cap Leverage Ratio, which compares aggregate open interest to Bitcoin’s realized cap (the aggregate USD value stored on the network). Significant positive deviations in this ratio signal heightened speculative activity in derivatives markets relative to the asset’s underlying size, indicating increased leverage, and potential fragility in market structure. Conversely, contractions in the ratio suggest a period of de-leveraging is underway.
Currently, the leverage ratio remains elevated at 10.2%, with only 182 out of 1679 trading days (10.8%) recording a higher value. This highlights the substantial build-up of leverage in the market and further reinforces the growing dominance of derivatives in shaping the current market regime.
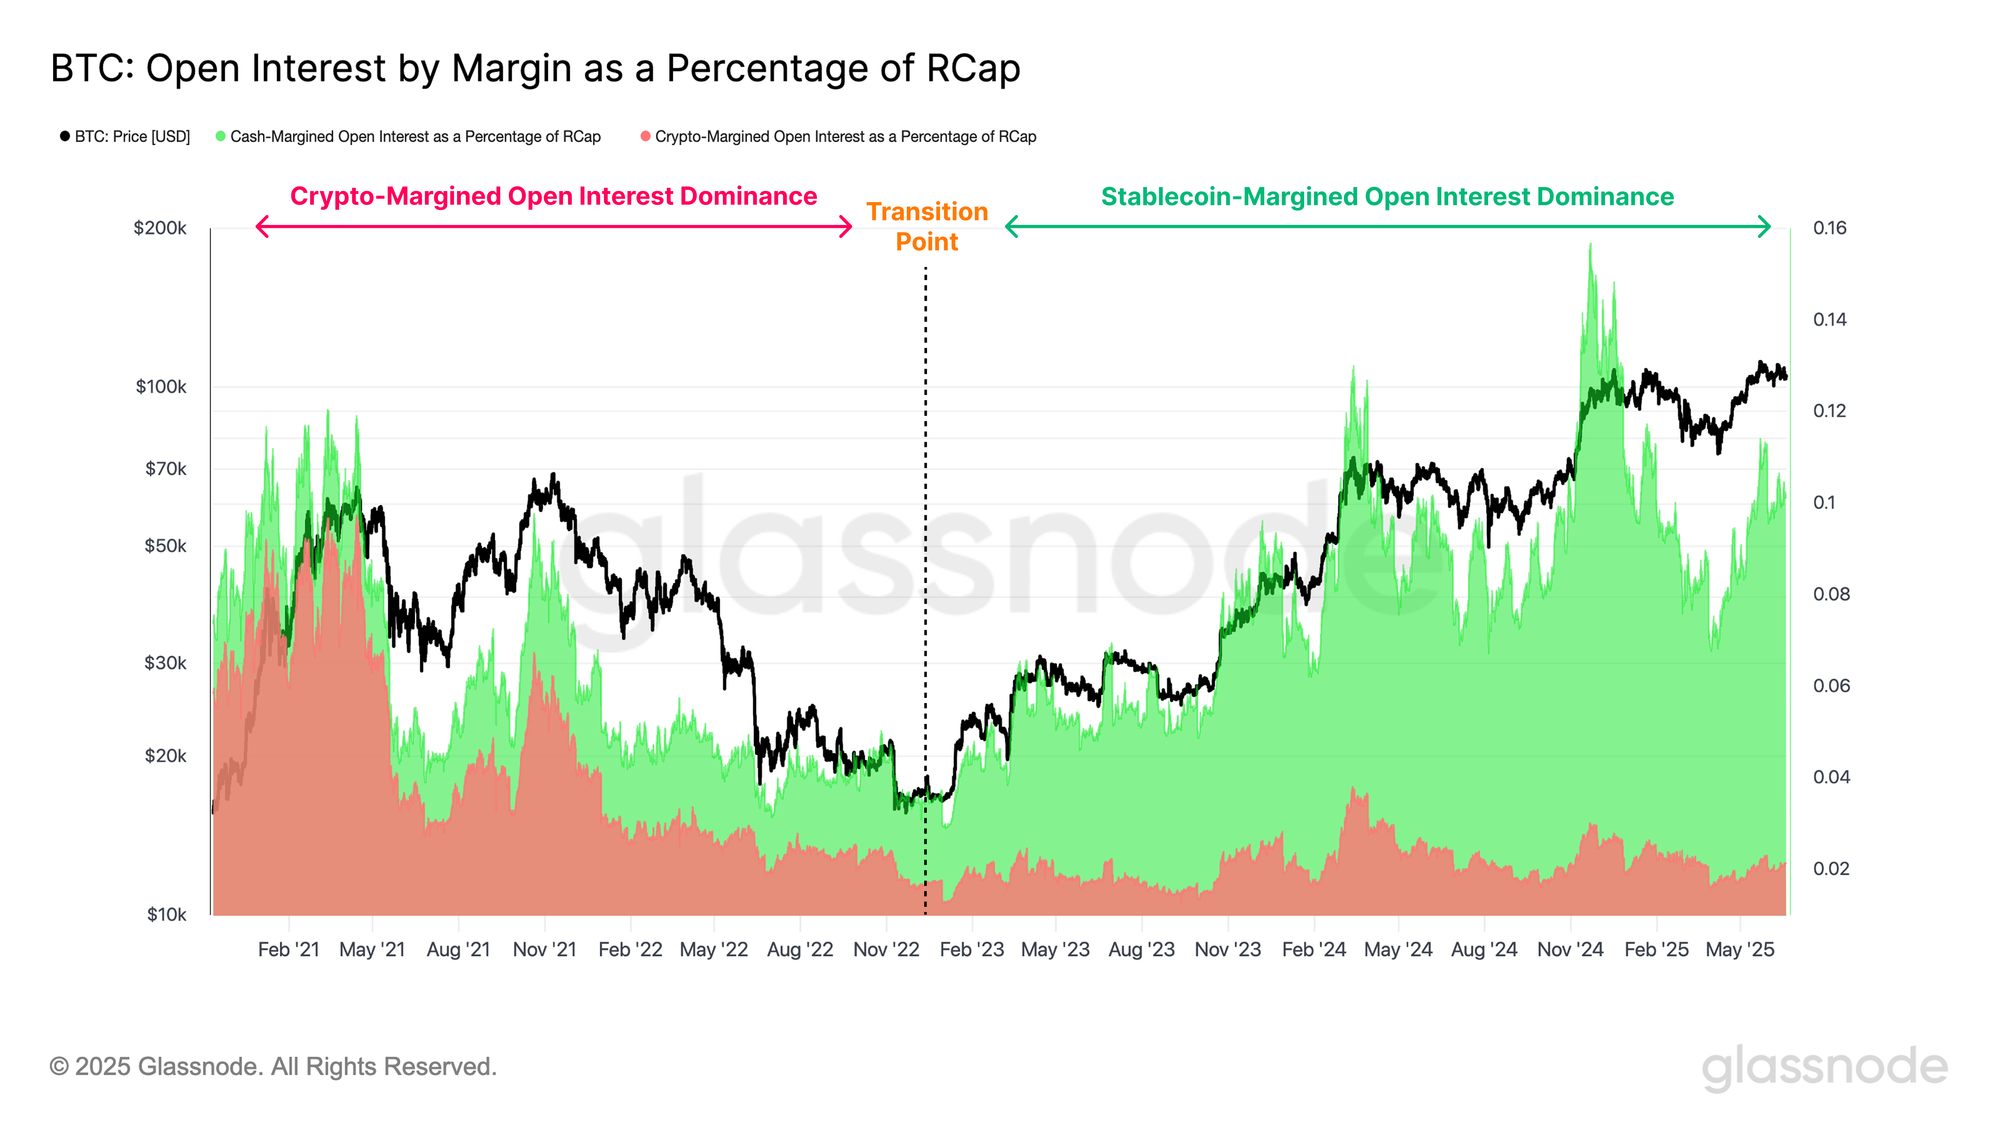
However, the collateral structure underpinning open interest is not uniform, as traders can choose between stablecoin- or crypto-margined collateral. Stablecoin-margined positions are more conservative, with collateral pegged to the US dollar, where as crypto-margined positions introduce an additional layer of volatility to the trade, with the value of the underlying collateral itself fluctuating with the wider market.
To assess the overall health of the collateral structure in derivatives markets, we calculate the Realized Cap Leverage Ratio separately for stablecoin- and crypto-margined open interest. Notably, during the 2018–2021 cycle, crypto-margined collateral was the preferred choice among investors. Coupled with the widespread availability of 100x leverage, this structurally weaker collateral base played a significant role in exacerbating the May 2021 market drawdown.
Encouragingly, since the high-profile collapse of FTX, stablecoin-margined collateral has become the dominant form of margin, now accounting for the super-majority of open interest collateral. This shift highlights the maturation of the derivative complex around digital assets, and a move toward more stable risk management practices.
Summary and Conclusions
Despite Bitcoin’s elevated price, a clear divergence has emerged between market valuation and network activity, with transaction counts remaining unusually low, largely due to a sharp decline in non-monetary transactions. This drop in throughput has led to a significant fall in fee-based miner revenue, contrasting sharply with previous bull cycles where price rallies typically brought network congestion and surging fees.
Nevertheless, the volume settled by the network remains substantial, settling an average $7.5B per day. The combination of low transaction count and a heightened volume throughput suggests large entities are becoming increasingly dominant within on-chain activity. Additionally, volume traded across off-chain venues has recorded strong growth, with combined spot, futures and options volume regularly exceeding on-chain settlement volume by a factor of 7–16x.
Leverage continues to build in the derivatives market with the aggregate futures and options open interest remaining historically elevated at $96.2B. However, the composition of the underlying collateral structure has markedly improved, with stablecoin-margined positions now comprising the majority of open interest. This shift highlights the maturation of the derivative complex around digital assets, and a move toward more stable risk management practices.
Disclaimer: This report does not provide any investment advice. All data is provided for informational, and educational purposes only. No investment decision shall be based on the information provided here and you are solely responsible for your own investment decisions.
Exchange balances presented are derived from Glassnode’s comprehensive database of address labels, which are amassed through both officially published exchange information and proprietary clustering algorithms. While we strive to ensure the utmost accuracy in representing exchange balances, it is important to note that these figures might not always encapsulate the entirety of an exchange’s reserves, particularly when exchanges refrain from disclosing their official addresses. We urge users to exercise caution and discretion when utilizing these metrics. Glassnode shall not be held responsible for any discrepancies or potential inaccuracies.
Please read our Transparency Notice when using exchange data.
- Join our Telegram channel.
- For on-chain metrics, dashboards, and alerts, visit Glassnode Studio.
