A Compressed Range
Bitcoin remains in a $100k–$110k range as profit-taking slows and activity metrics cool. While support at $99k holds, fading spot volume and cautious futures sentiment suggest limited upside momentum without a significant influx of demand.


Executive Summary
- Headline volatility defines recent moves: Bitcoin briefly dropped to $99k amid geopolitical tensions, then rebounded to $106k after headlines of de-escalation circulated. Price remains within the $100k–$110k range, where it has consolidated since early May.
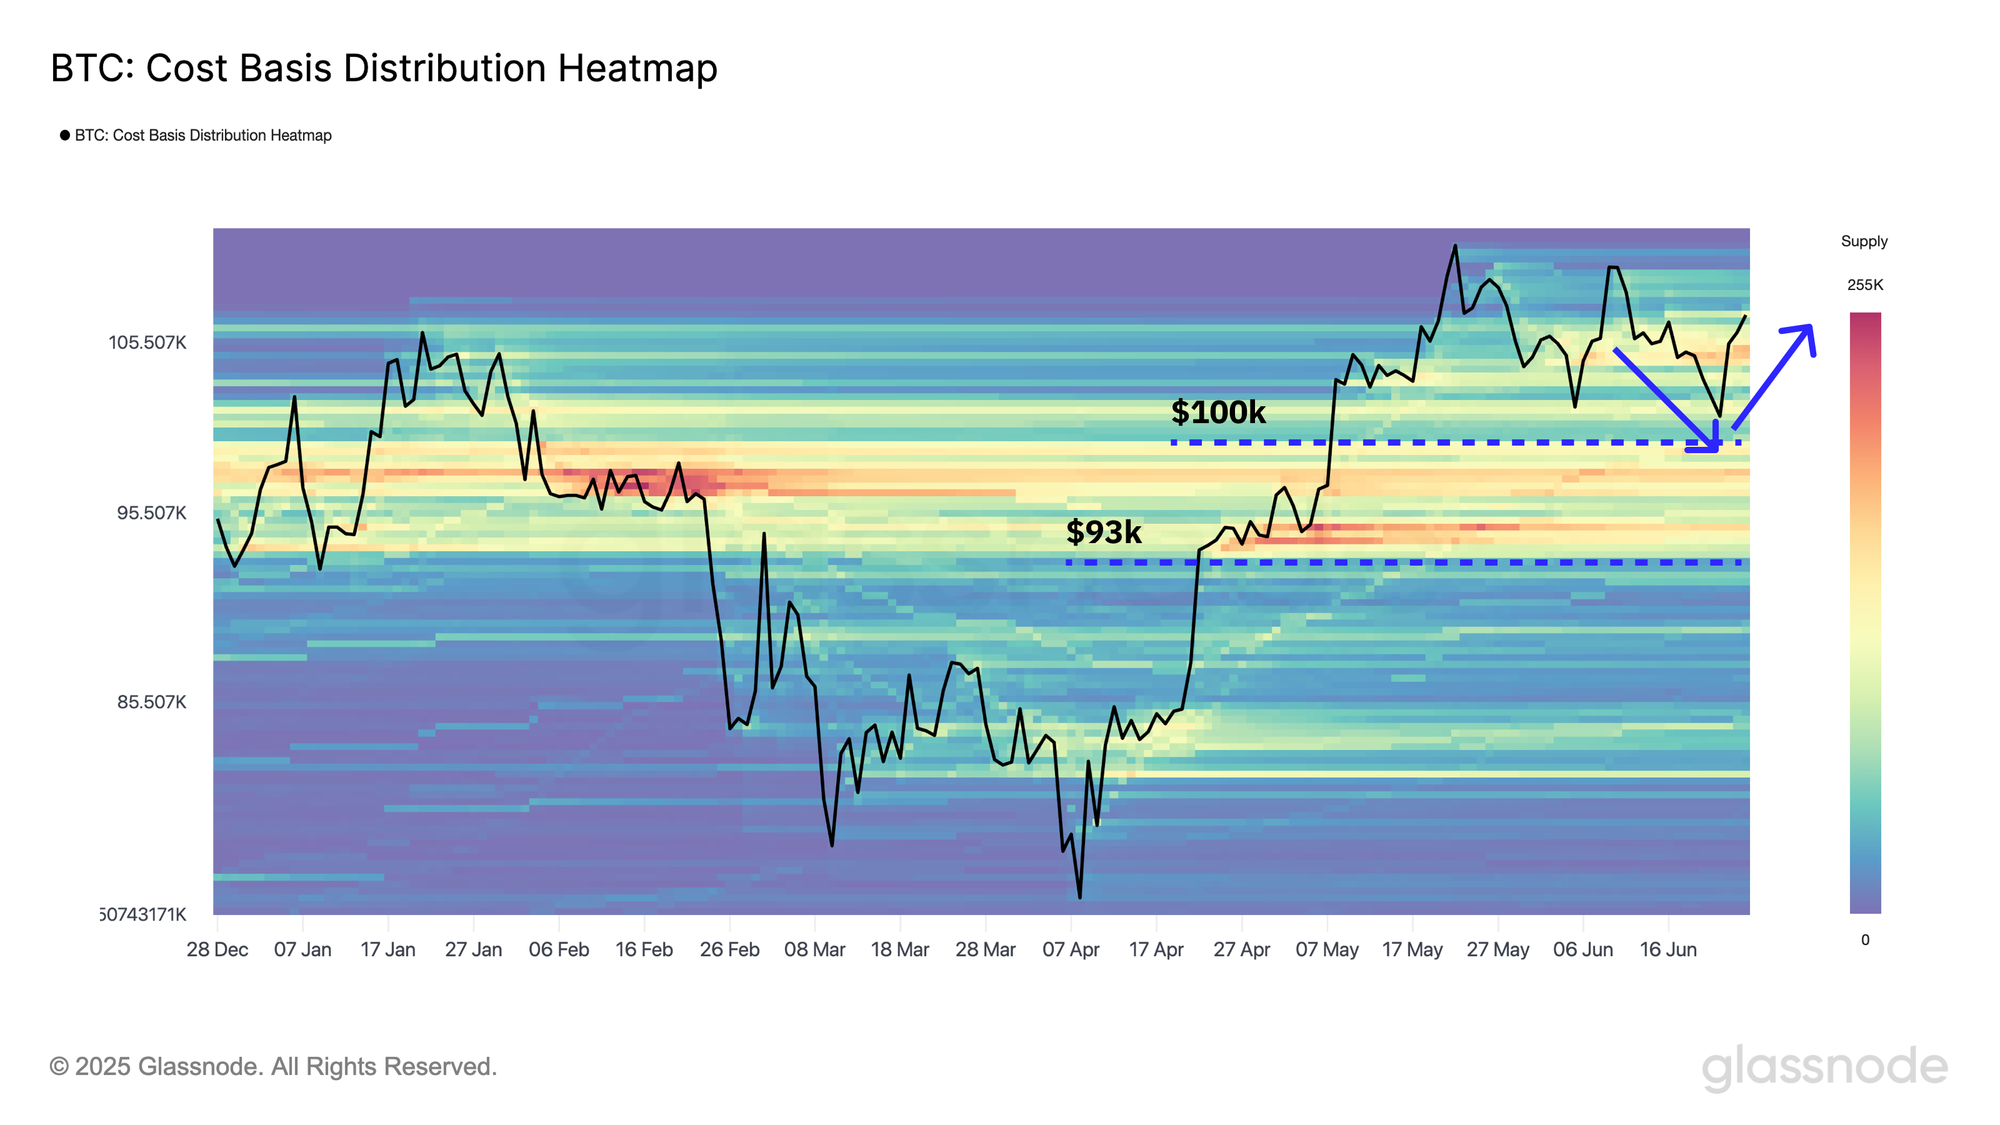
- Strong structural support at $93k–$100k: The CBD Heatmap shows concentrated accumulation in this zone, formed during Q1 2025. As long as the price holds above it, the bull trend remains structurally intact.
- Profitability and activity metrics cooling down: Realized profit is tapering off from the third major wave of this cycle. On-chain transfer volume dropped ~32%, and spot volume remains low at $7.7B, reflecting reduced investor engagement.
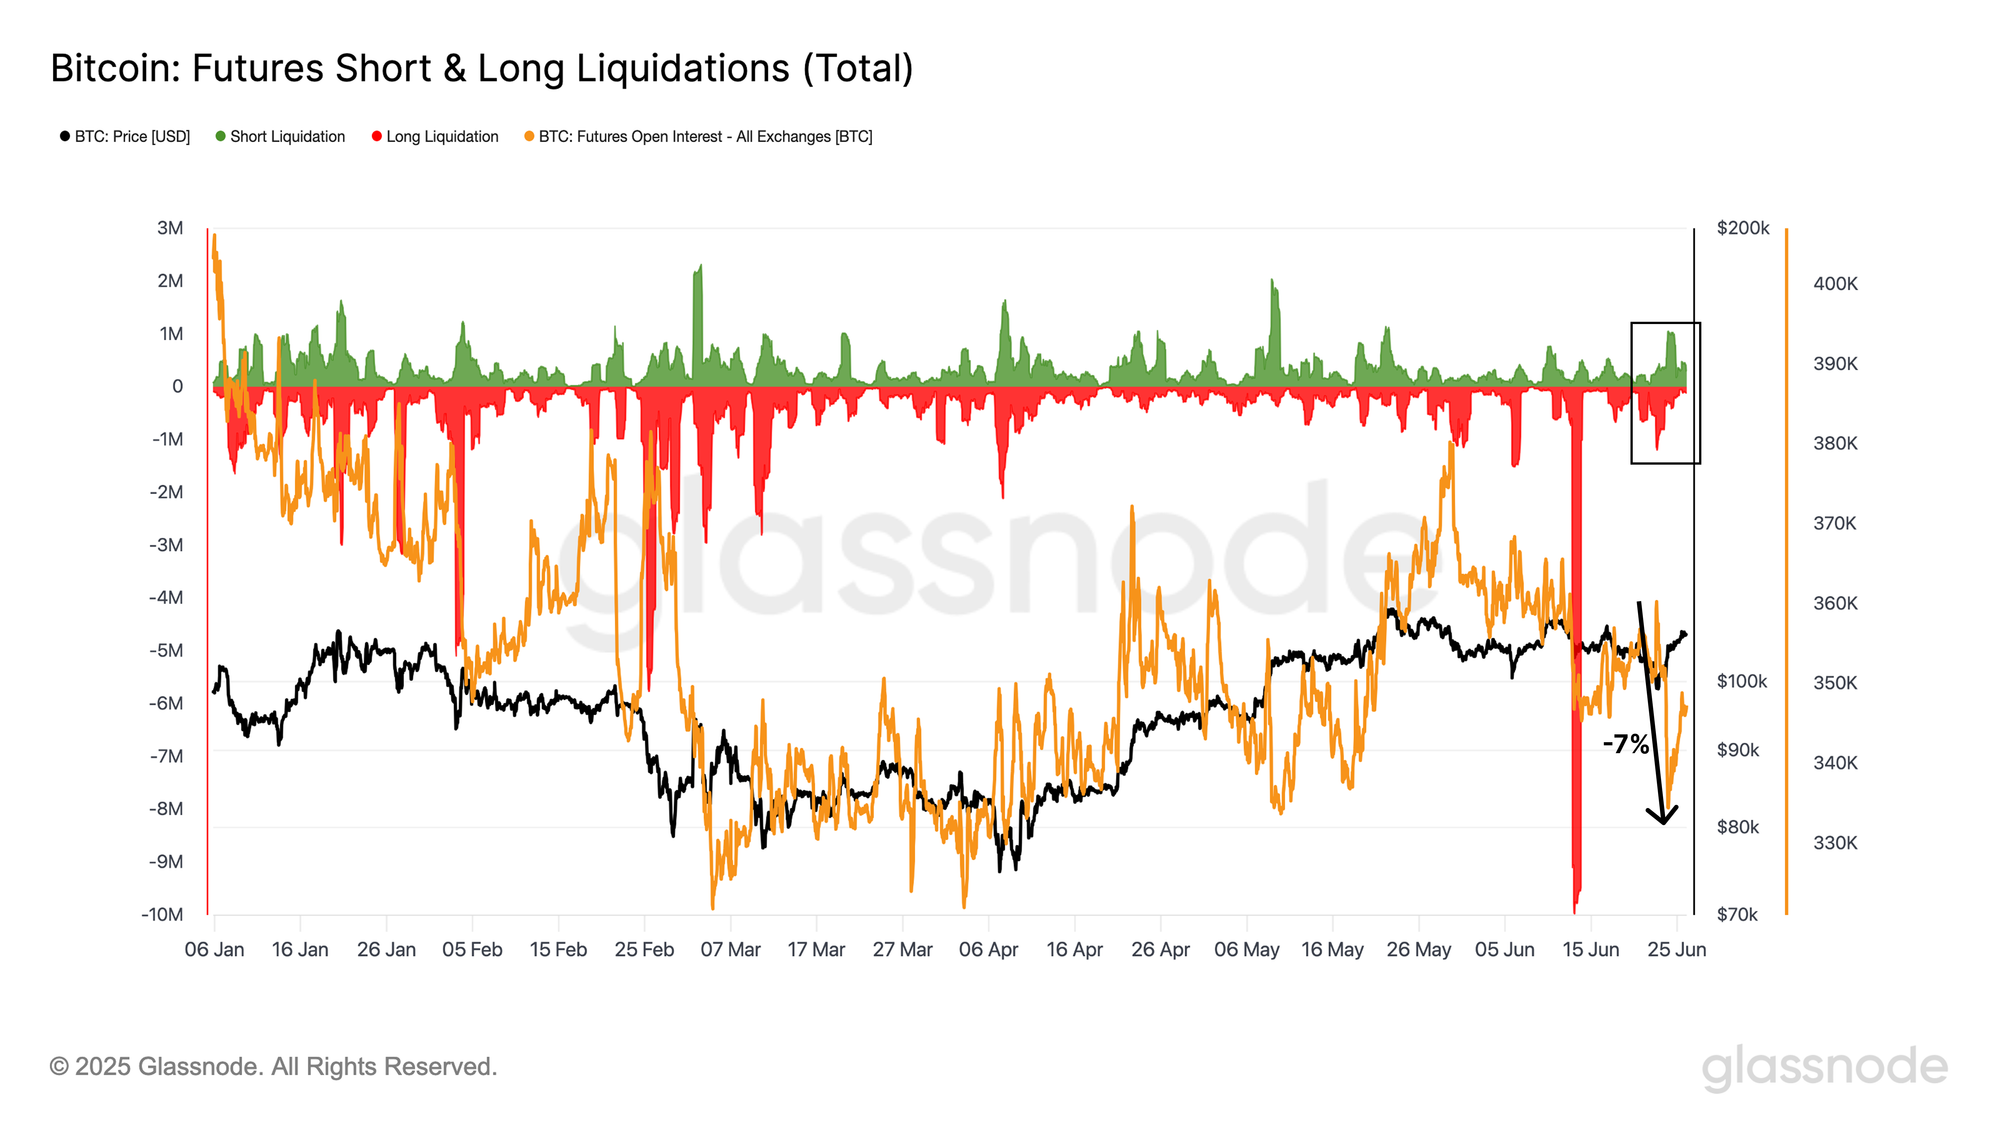
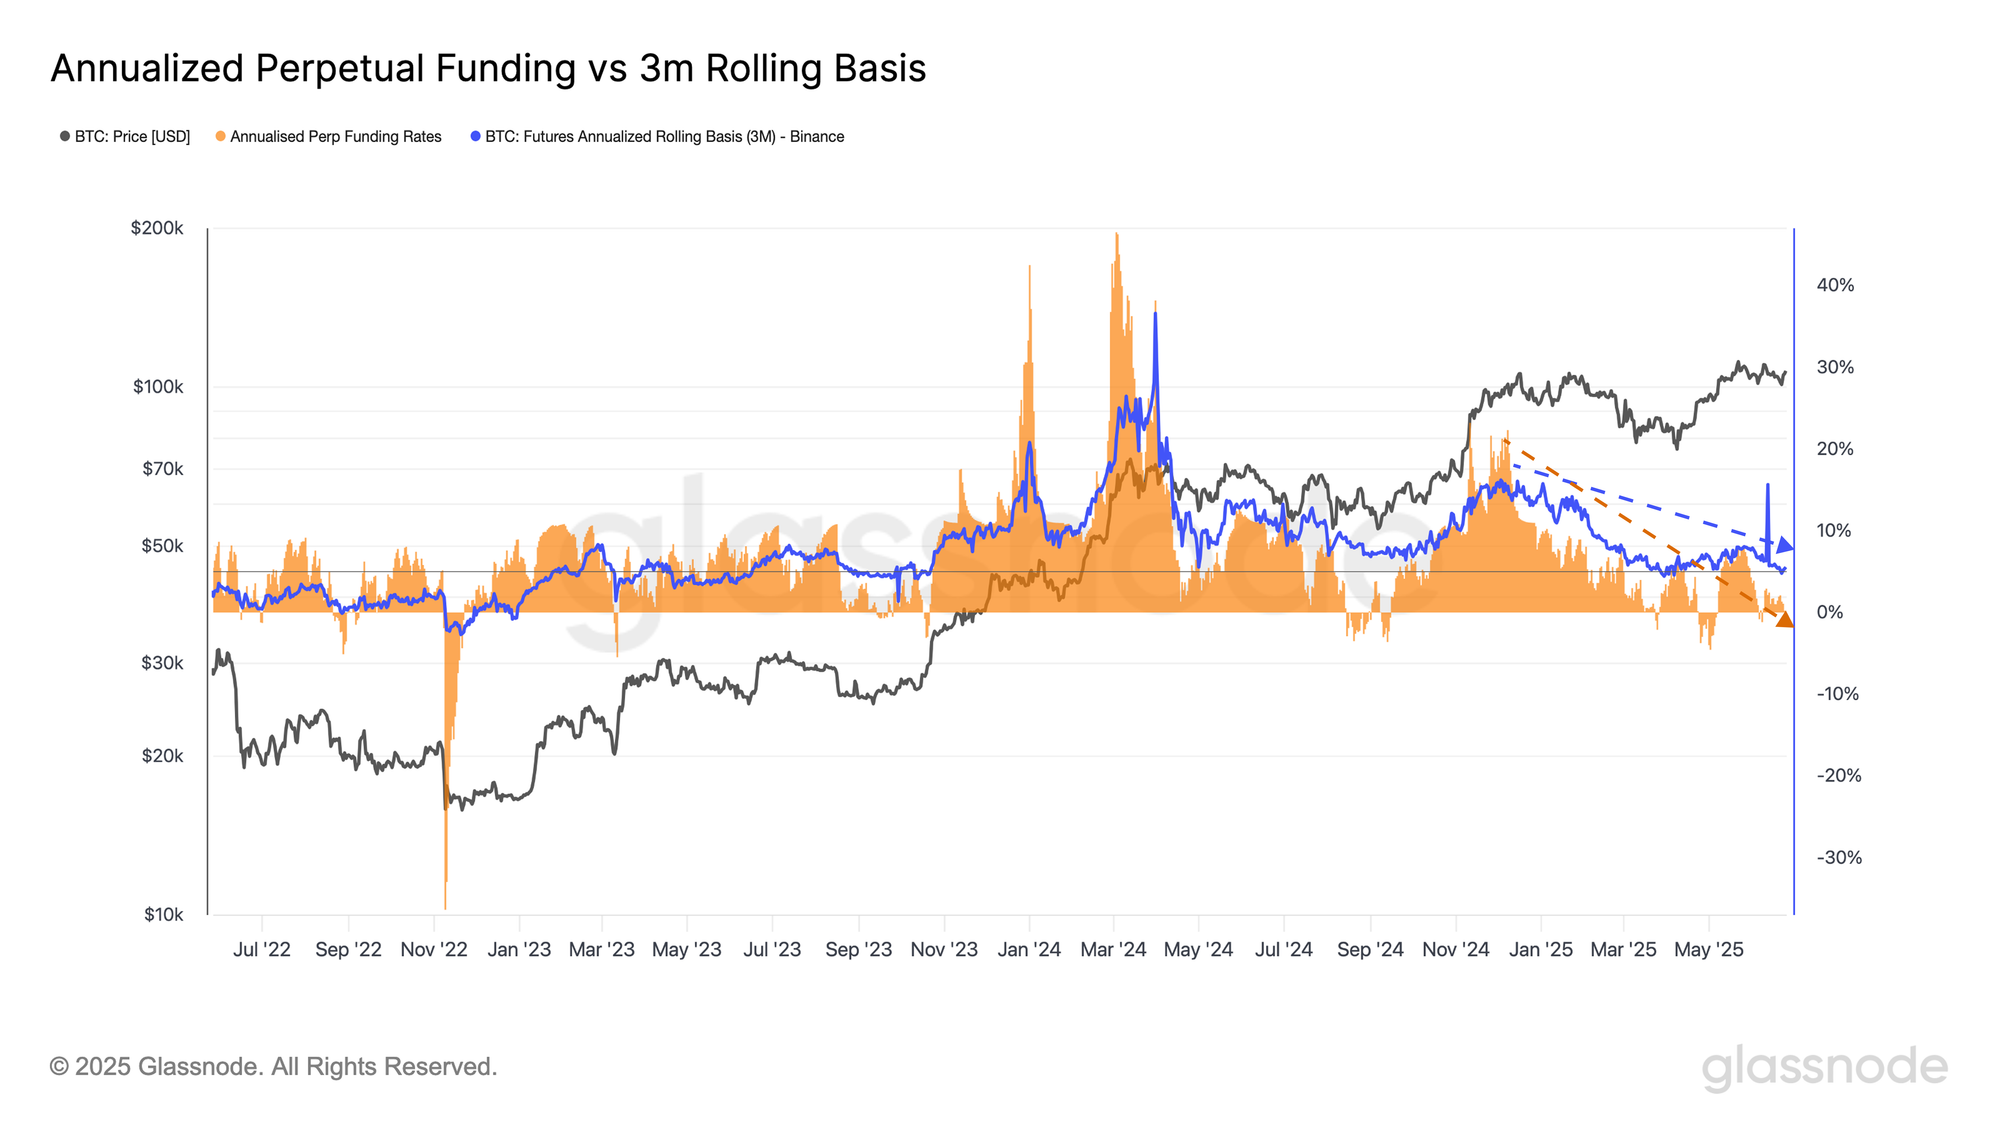
- Futures markets are still active, but with lower conviction: Despite high trading volume, open interest dropped 7% and liquidations have surged on both sides. Falling funding rates and 3M basis show declining appetite for long-biased exposure.
- Momentum fades, but risks are balanced: The market is in a holding pattern. While structure remains supportive, a breakout to new highs will likely require a clear pickup in demand, activity, and conviction.
Headline Whiplash
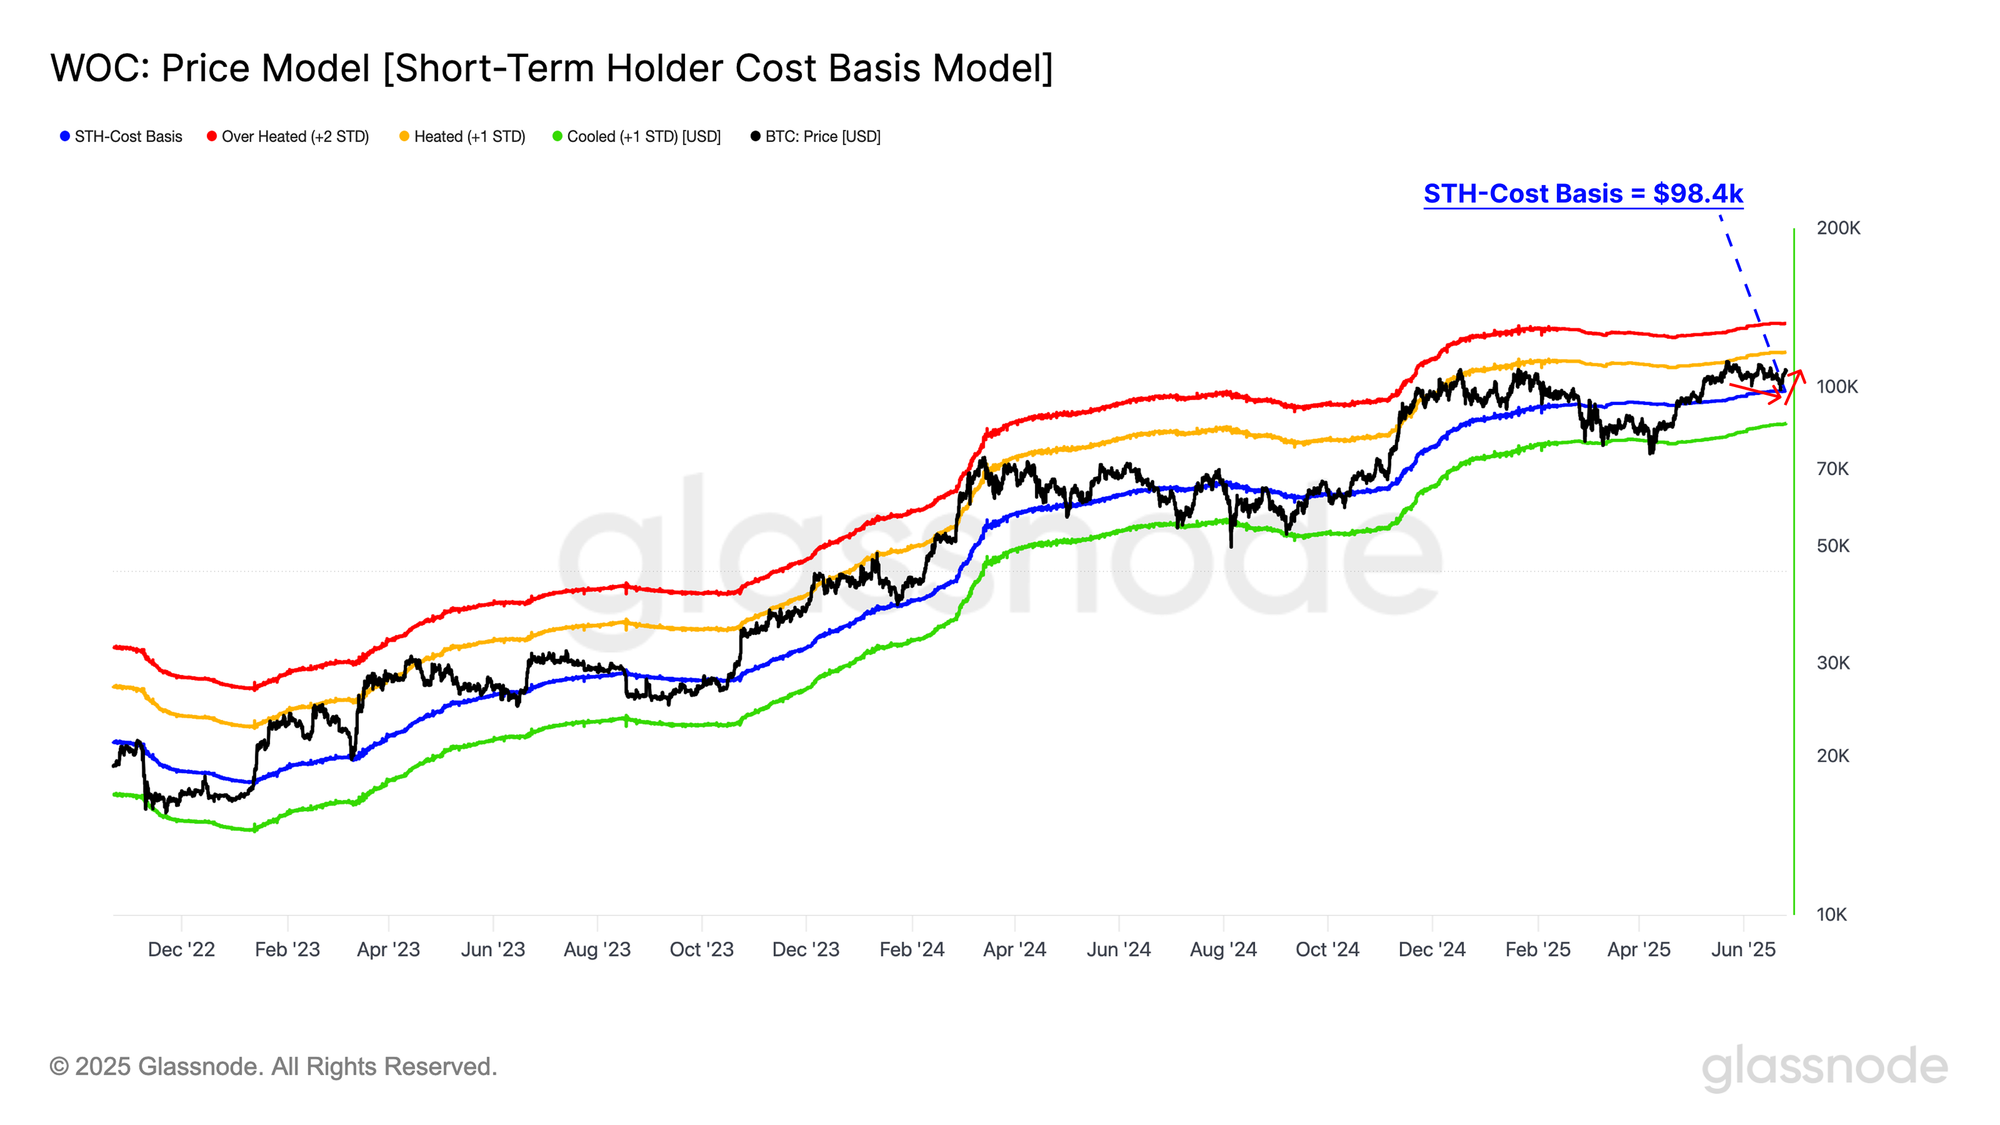
Bitcoin dropped to ~$99k over the weekend as geopolitical tensions flared, briefly testing support just above the Short-Term Holder Cost Basis at $98.2k. The move was quickly reversed, with the price rebounding to $106k after de-escalation headlines on Tuesday.
The market has now returned to its familiar $100k–$110k range, where it has been consolidating since May 8, reflecting continued uncertainty amid headline-driven volatility.
Holding the Line
A closer look at the CBD Heatmap reveals that over the weekend, Bitcoin’s drop to $99k found support near the upper edge of a dense supply zone between $93k and $100k. This zone has been a key area of activity since the top formation in Q1 2025, marking it as a structurally important level.
As long as the price holds above this range, the bull market structure remains intact. However, a breakdown below could trigger a deeper correction, especially if holders with a cost basis in this zone begin to capitulate and add to the sell pressure.
Leverage Flushed on Both Sides
The sharp price swings over the weekend triggered heightened volatility in the futures market, with liquidations spiking to $28.6M for longs and $25.2M for shorts within 24 hours. This dual-sided flush reflects how quickly sentiment flipped as the market reacted to headlines.
At the same time, BTC-denominated open interest dropped from 360k BTC to 334k BTC, a decline of ~7%, highlighting that leveraged traders were caught off guard in both directions. The sharp reduction in open interest suggests a temporary clearing of speculative excess, resetting positioning in the derivatives market.
Despite the market reclaiming the $100k–$110k range, signs of diminishing profitability and sluggish on-chain activity are becoming more apparent. These trends are typical in choppy consolidation phases, where volatility fades and investor engagement cools.
Until we see a pickup in profitability and activity metrics, the likelihood of a breakout to new all-time highs remains limited. For now, the market appears to be digesting prior gains, awaiting fresh momentum and an influx of new demand.
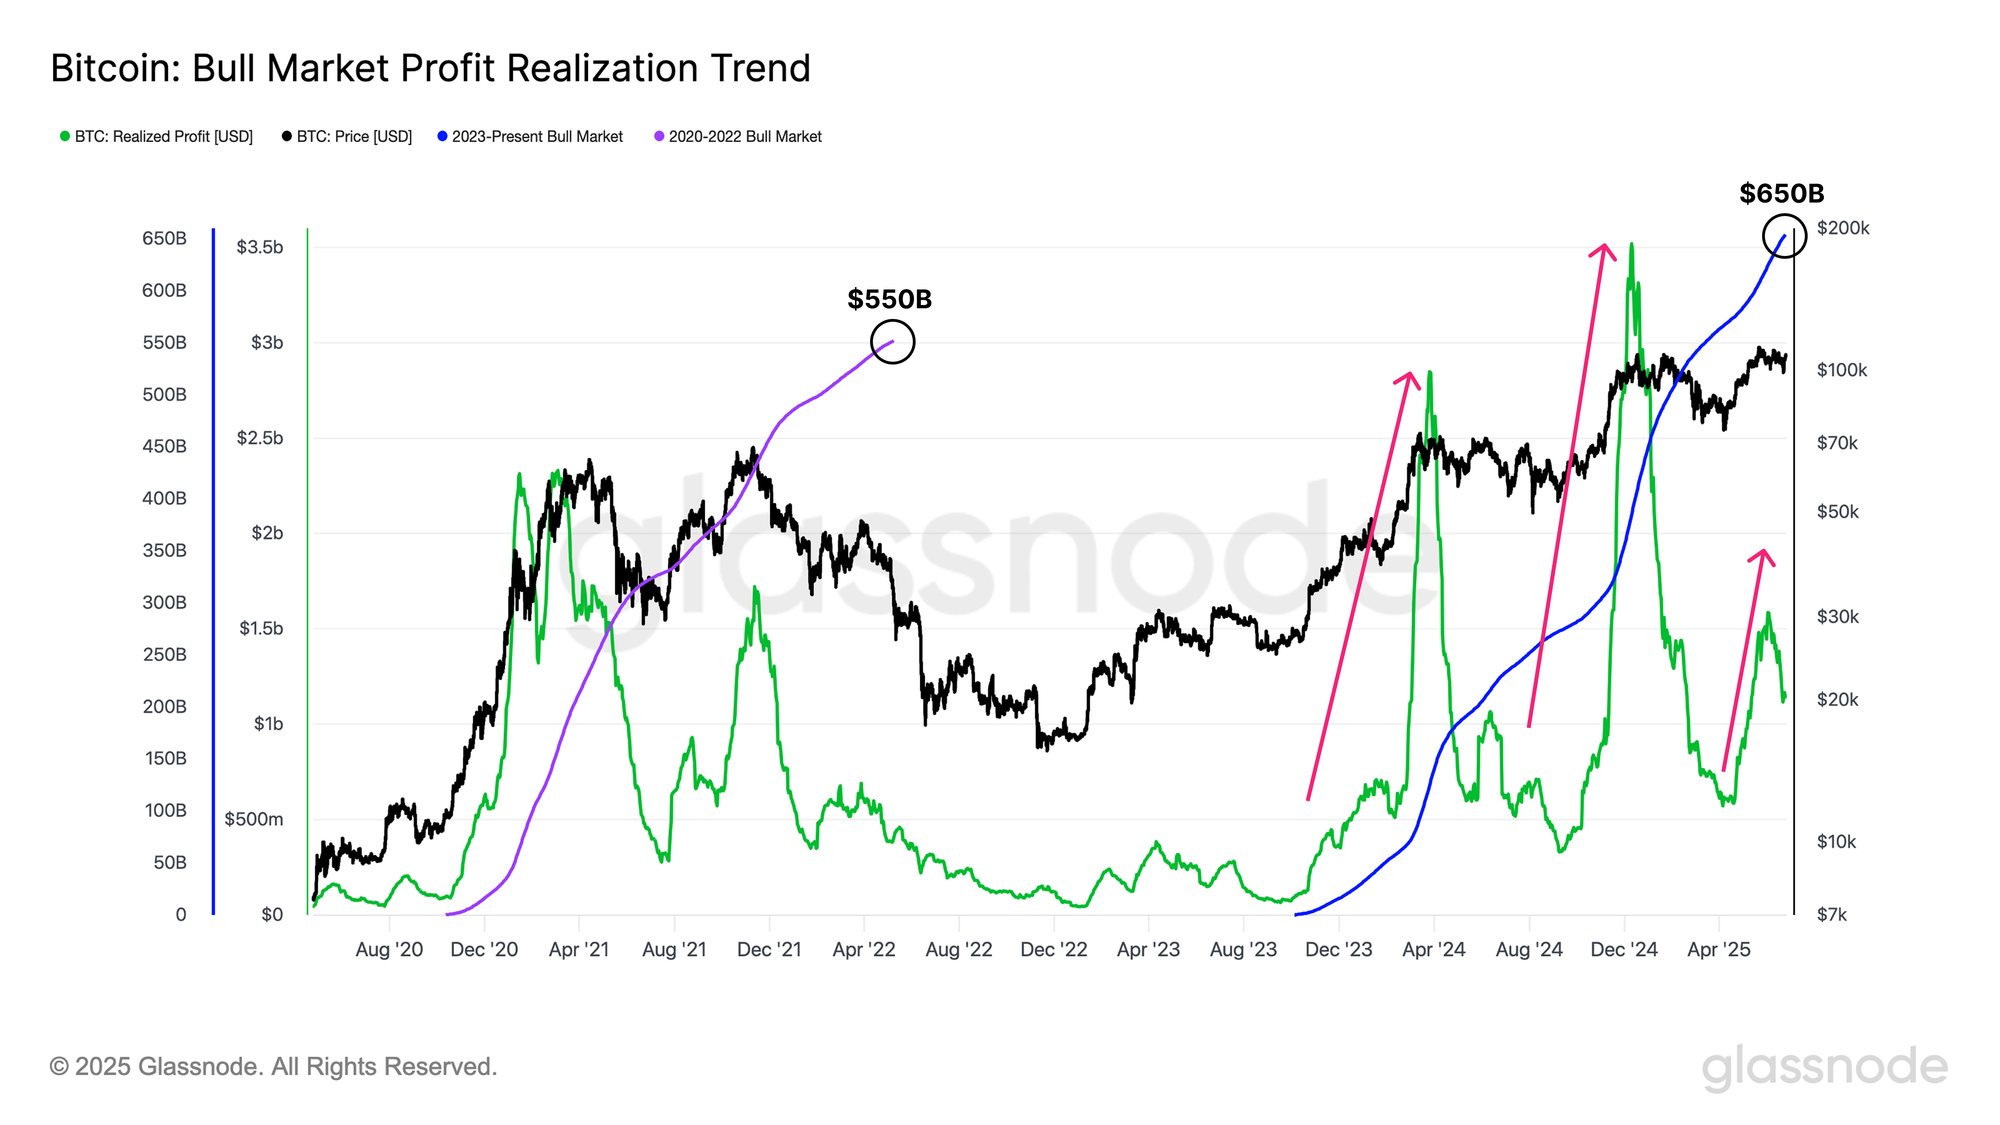
Profits Taper and Volume Fades
To assess the profitability of investors, we examine the 30-day moving average of realized profit alongside the cumulative realized profit in both the 2020–2022 and current bull markets. This comparison highlights how capital rotation has evolved across cycles.
During the 2020–2022 market, Bitcoin investors realized around $550B in profit across multiple rallies, including two major waves. In the current cycle, realized profit has already reached $650B, surpassing the previous cycle’s sum total.
Currently, the market appears to be in a cool-down phase after the third significant wave of profit-taking, indicating that while large gains have been secured, momentum is now easing as realized profitability tapers off.
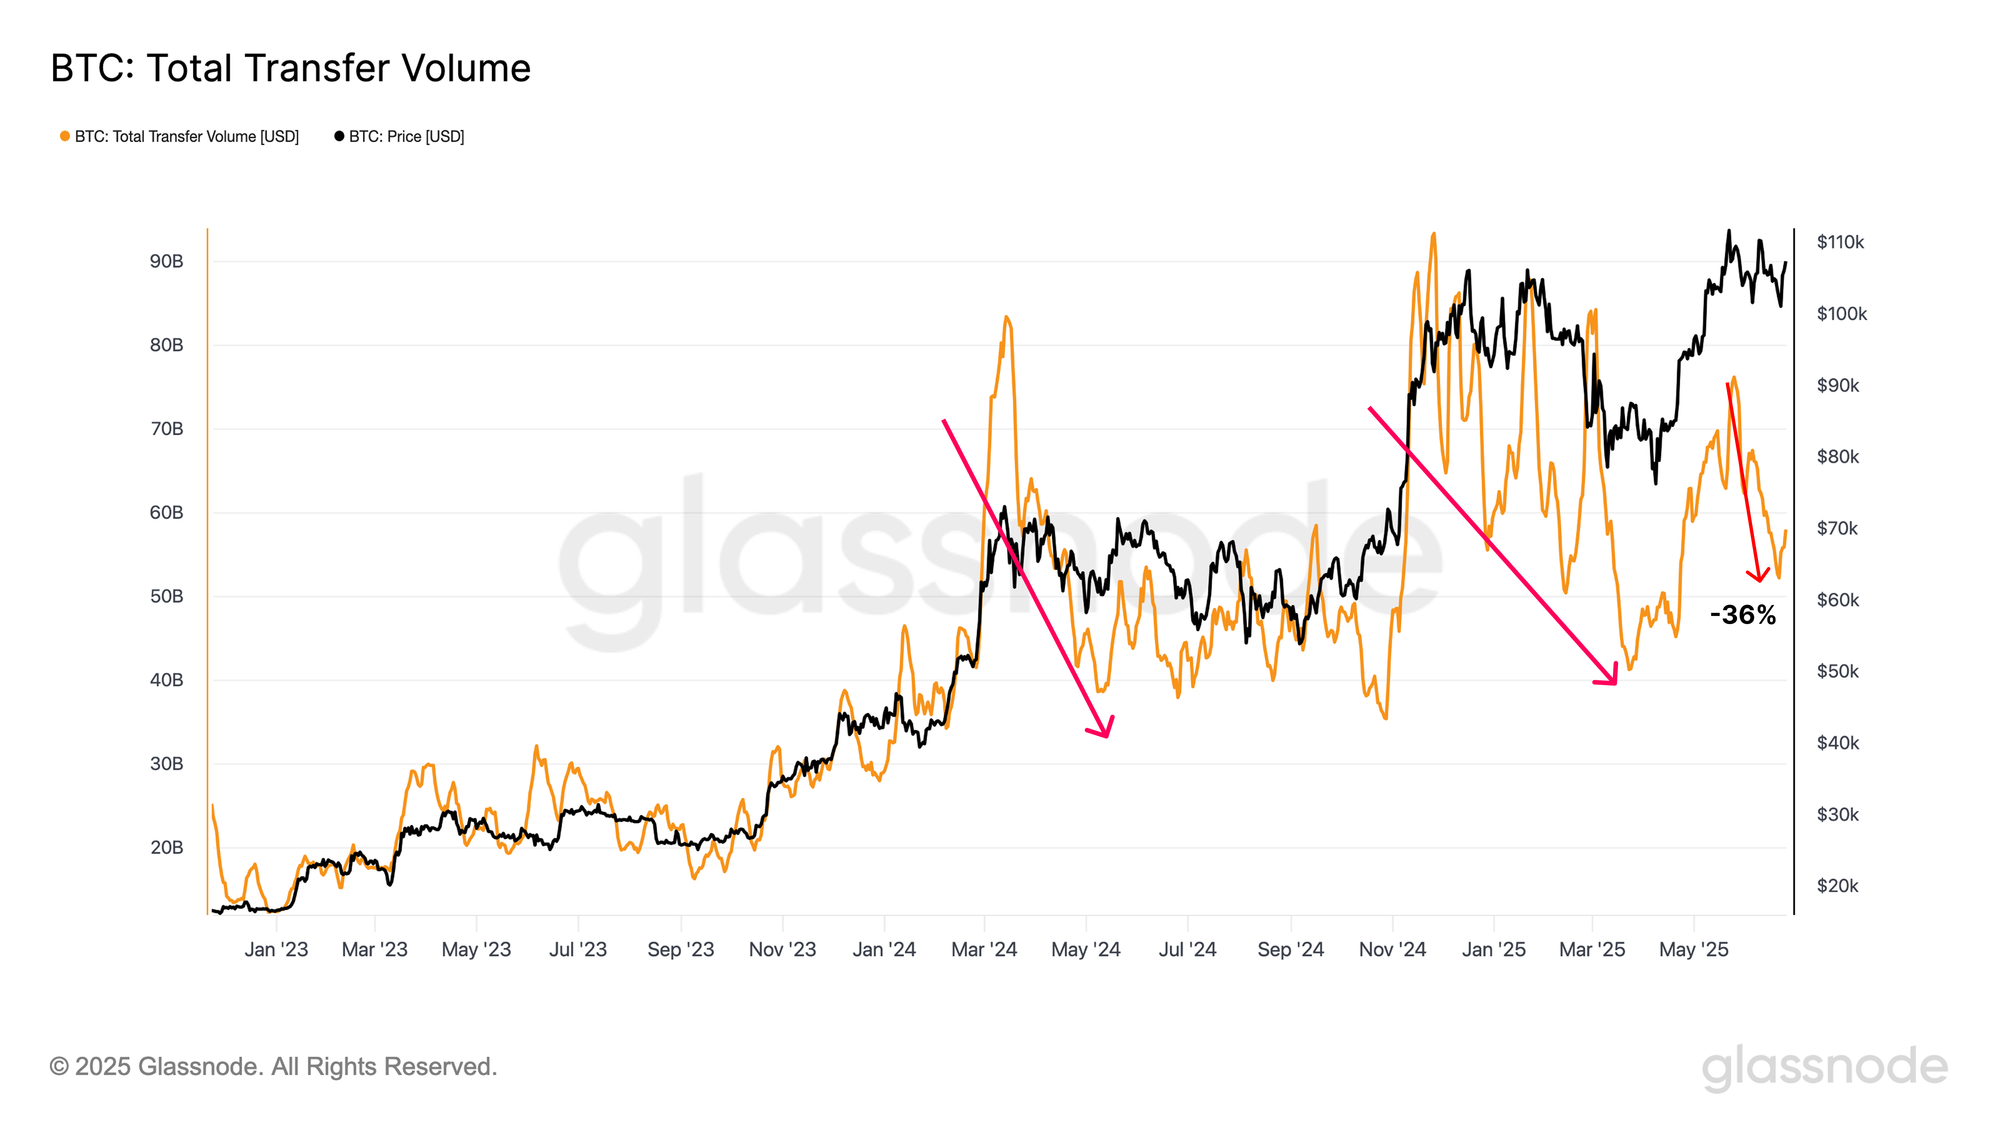
A similar cooling pattern is evident across key activity metrics. The 7-day moving average of on-chain transfer volume has dropped ~32%, from a peak of $76B in late May to $52B over the recent weekend.
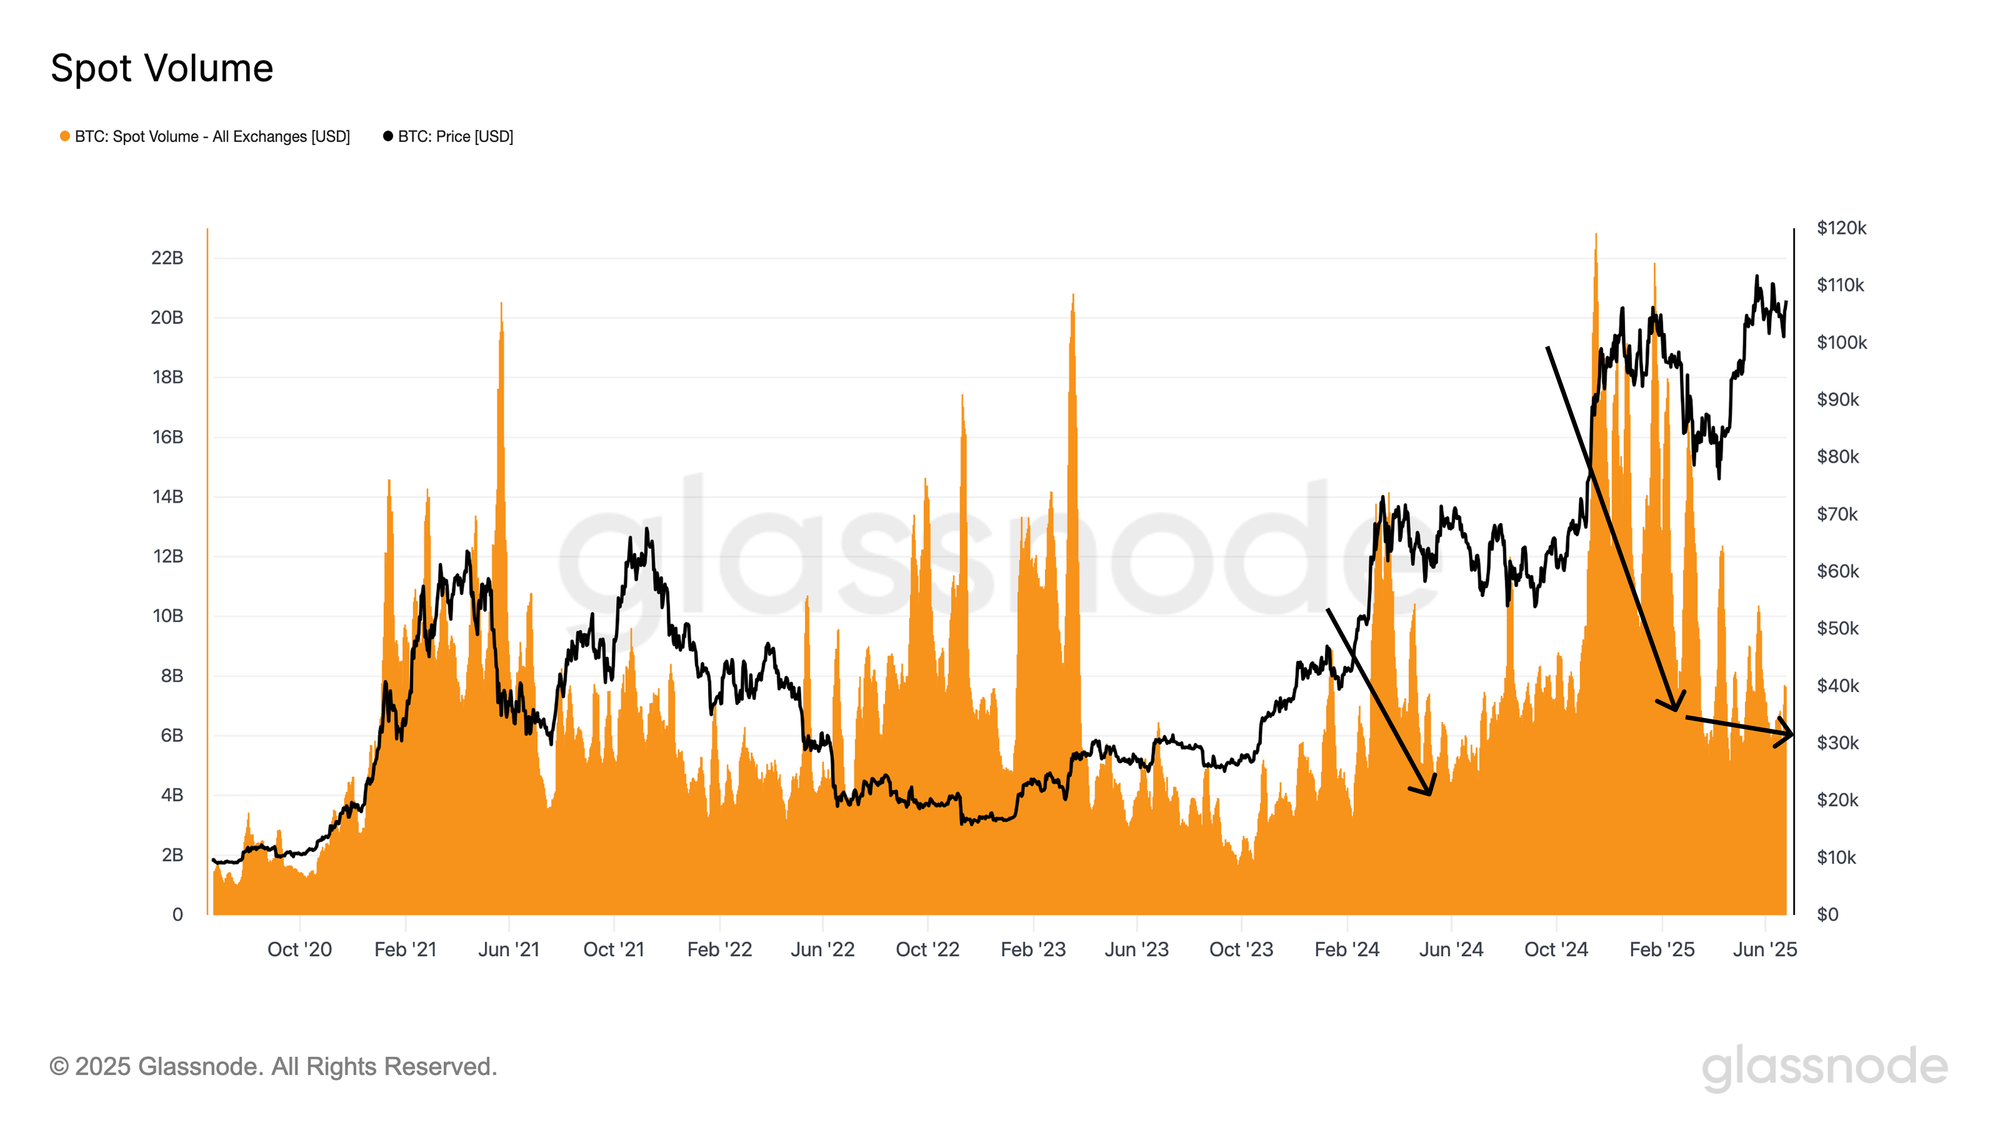
Unlike the ATH rallies in Q2 and Q4 2024, the recent push to $111k was not accompanied by a surge in spot volume. Current spot volume sits at $7.7B, significantly lower than the cyclical peaks observed earlier in this bull market. This divergence further underscores the lack of speculative intensity, highlighting the market’s hesitancy and reinforcing the consolidation narrative.
Meanwhile, the futures market volume has also been undergoing a multi-week cooldown, consistent with broader market fatigue. However, unlike the spot market, futures participants remained actively engaged during the rally to $111k. This sustained speculative interest suggests that leverage-driven positioning was more influential in recent price dynamics.
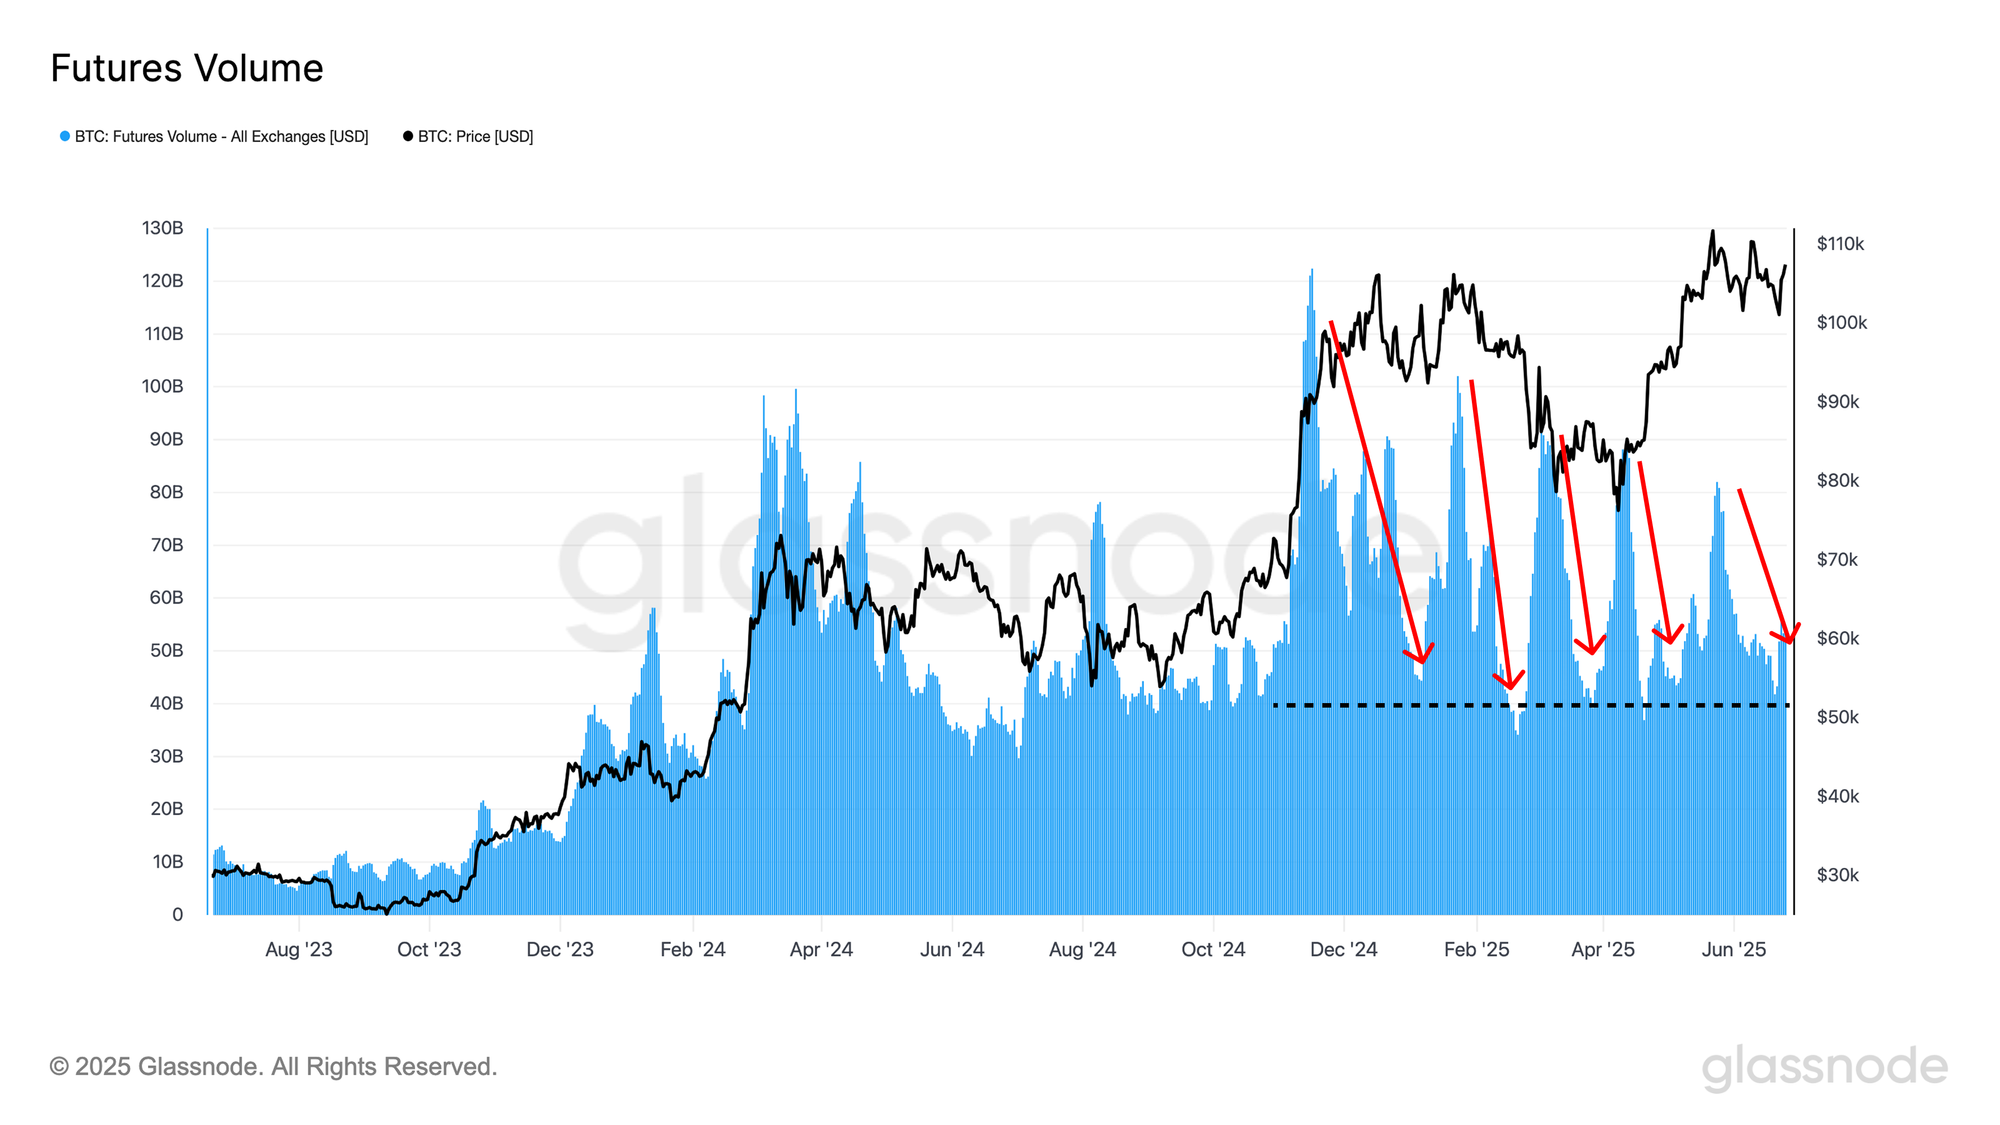
That being said, this sustained futures market participation has been losing its aggressiveness since the Q1 2025 all-time high. Both the annualized funding rate and the 3-month futures rolling basis have shown a continuous downtrend, reflecting a declining appetite to take long positions, even as trading volume remains elevated. This points to a more cautious and less conviction-driven speculative environment. It may also indicate a larger volume of cash & carry arbitrage positions, and even heightened short-side interest.
Conclusion & Discussion
Bitcoin remains range-bound between $100k and $110k, with recent price action driven by macro headlines and sharp reversals. The CBD Heatmap shows strong support at $93k–$100k, a key zone from the Q1 2025 top formation.
However, signs of market fatigue are building. Profit realization is cooling, on-chain activity is declining, and spot volume failed to rise meaningfully during the recent ATH push. While futures participation remains active, falling funding rates and futures rolling basis signal a cautious stance among speculators.
As long as the price holds above key support, the bull trend remains intact. But without a revival in demand and conviction, the odds of a breakout to new highs appear limited in the near term.
Disclaimer: This report does not provide any investment advice. All data is provided for informational and educational purposes only. No investment decision shall be based on the information provided here, and you are solely responsible for your own investment decisions.
Exchange balances presented are derived from Glassnode’s comprehensive database of address labels, which are amassed through both officially published exchange information and proprietary clustering algorithms. While we strive to ensure the utmost accuracy in representing exchange balances, it is important to note that these figures might not always encapsulate the entirety of an exchange’s reserves, particularly when exchanges refrain from disclosing their official addresses. We urge users to exercise caution and discretion when utilizing these metrics. Glassnode shall not be held responsible for any discrepancies or potential inaccuracies.
Please read our Transparency Notice when using exchange data.
- Join our Telegram channel.
- For on-chain metrics, dashboards, and alerts, visit Glassnode Studio.