Grounding Through Confluence
The Bitcoin market is in an interesting spot, with the average coin still up 2x, whilst most Short-Term Holders are underwater. A multitude of volatility measures are also heavily compressed, suggesting a larger move is on the horizon.


Executive Summary
- Despite Bitcoin prices trading sideways to down, a significant proportion of the market remains in profit, with Short-Term Holders carrying the majority of losses.
- Using a combination of on-chain pricing models and technical indicators, we define and explore the a set of potential scenarios for the market moving forwards.
- Volatility continues to be historically compressed, which suggests a degree of both investor apathy, but also suggests an under-indexing for heightened volatility ahead.
Market Profitability Remains Robust
As BTC prices sold off down into the $60k region, a degree of fear and bearish sentiment could be discerned amongst many digital asset investors. This is not uncommon when market volatility stagnates and goes to sleep, as apathy creeps in.
Nevertheless, from the lens of MVRV Ratio, aggregate investor profitability remains remarkably robust, with the average coin still holding a 2x profit multiple. This is a level that often delineates the 'Enthusiastic' and the 'Euphoric' bull market phases.

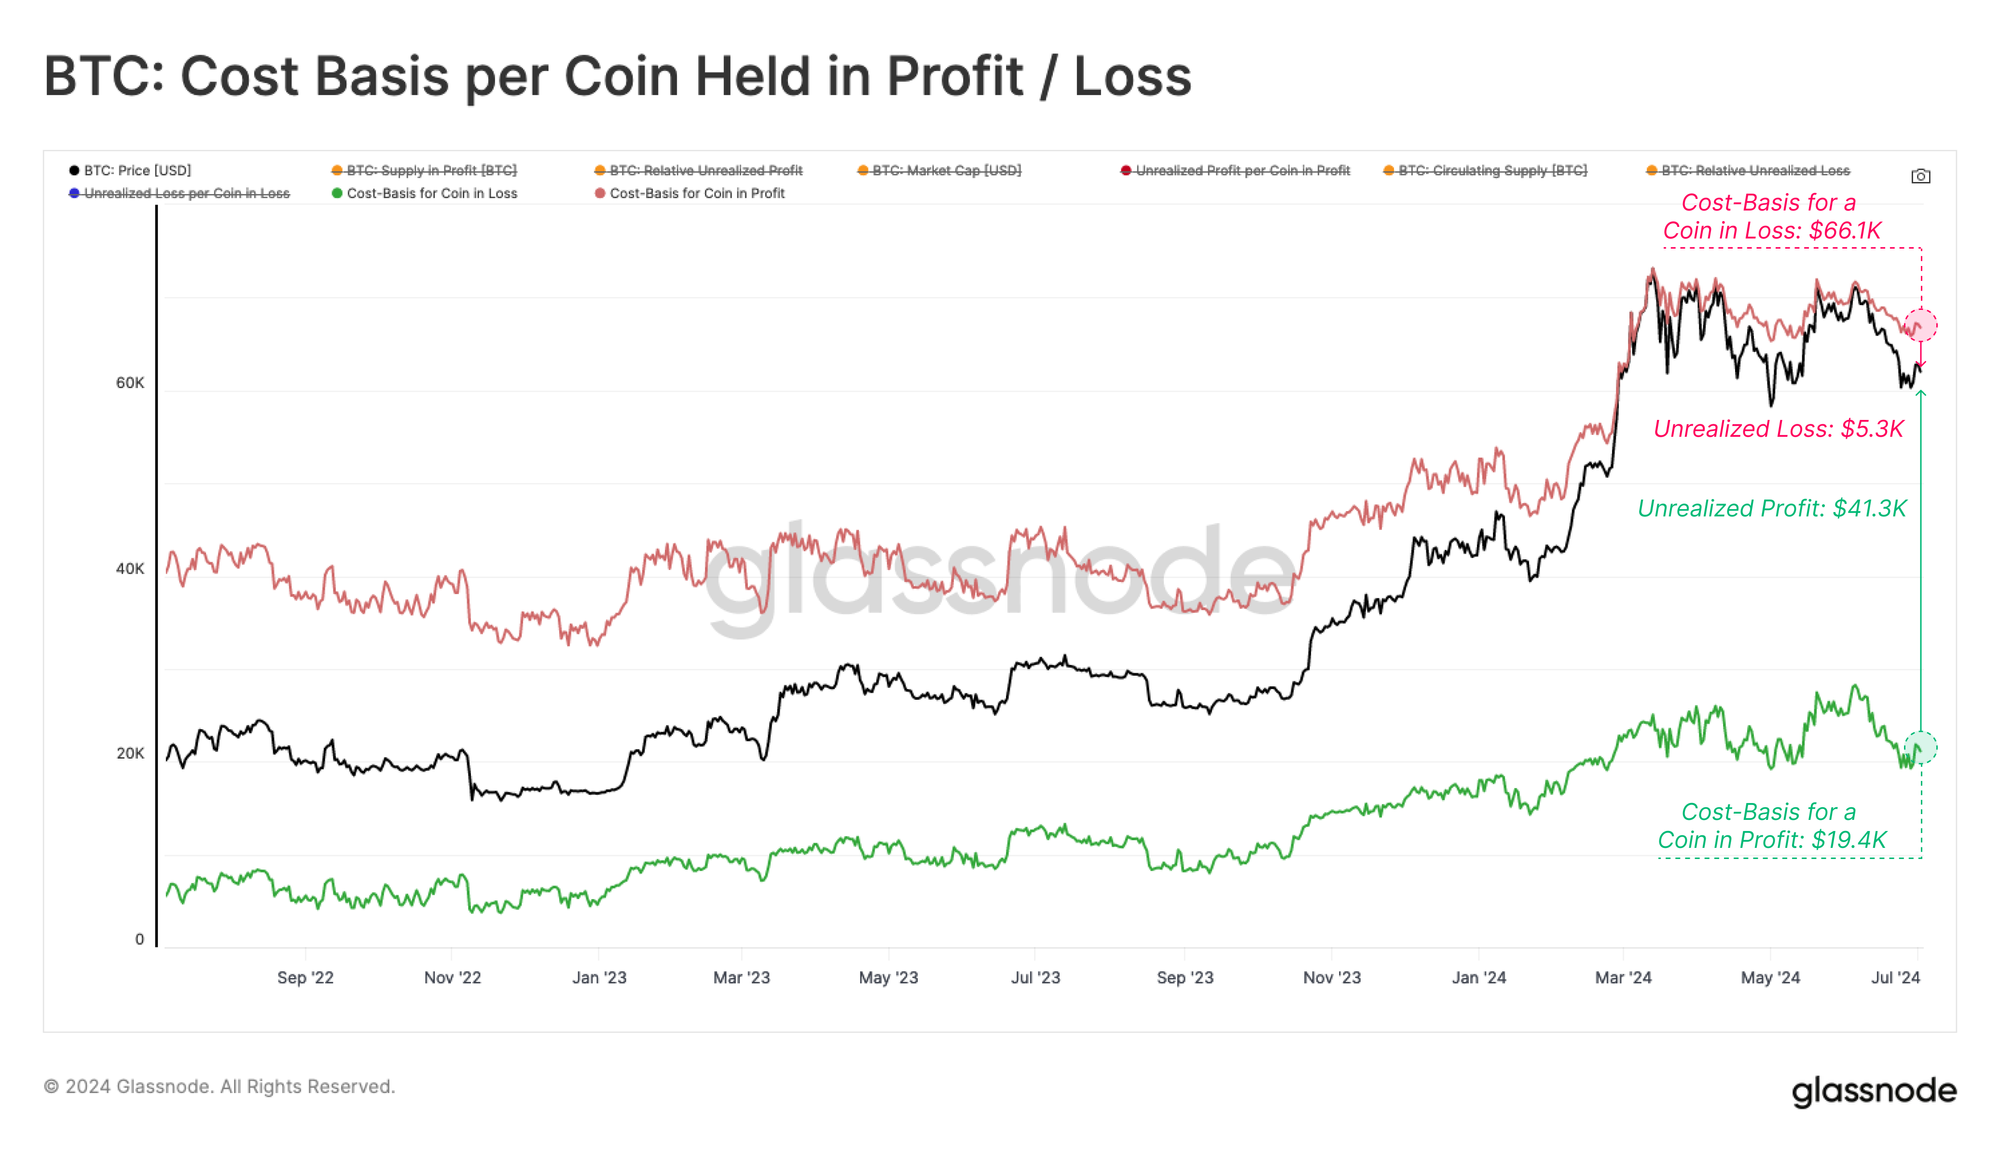
Moving one layer deeper, we can segregate all coins held either in a position of unrealized profit or loss. This allows us to evaluate the average cost basis of each group, as well as the average magnitude of unrealized profit and loss held per coin.
- 🔴 The average coin in profit is holding an unrealized gain of +$41.3k, with a cost basis of approximately $19.4k. Of note, this figure will be partially skewed by coins last moved in earlier cycles, including the Patoshi entity, early miners, and lost coins.
- 🔵 The average coin in loss is holding an unrealized loss of -$5.3k, and has a cost basis of approximately $66.1k. These coins are primarily held by Short-Term Holders, since very few 'top buyers' from the 2021 cycle still hold on today.
Both of these metrics can help identify points of potential sell-pressure, as investors seek to hold onto their gains, and/or avoid holding onto even heavier unrealized losses.
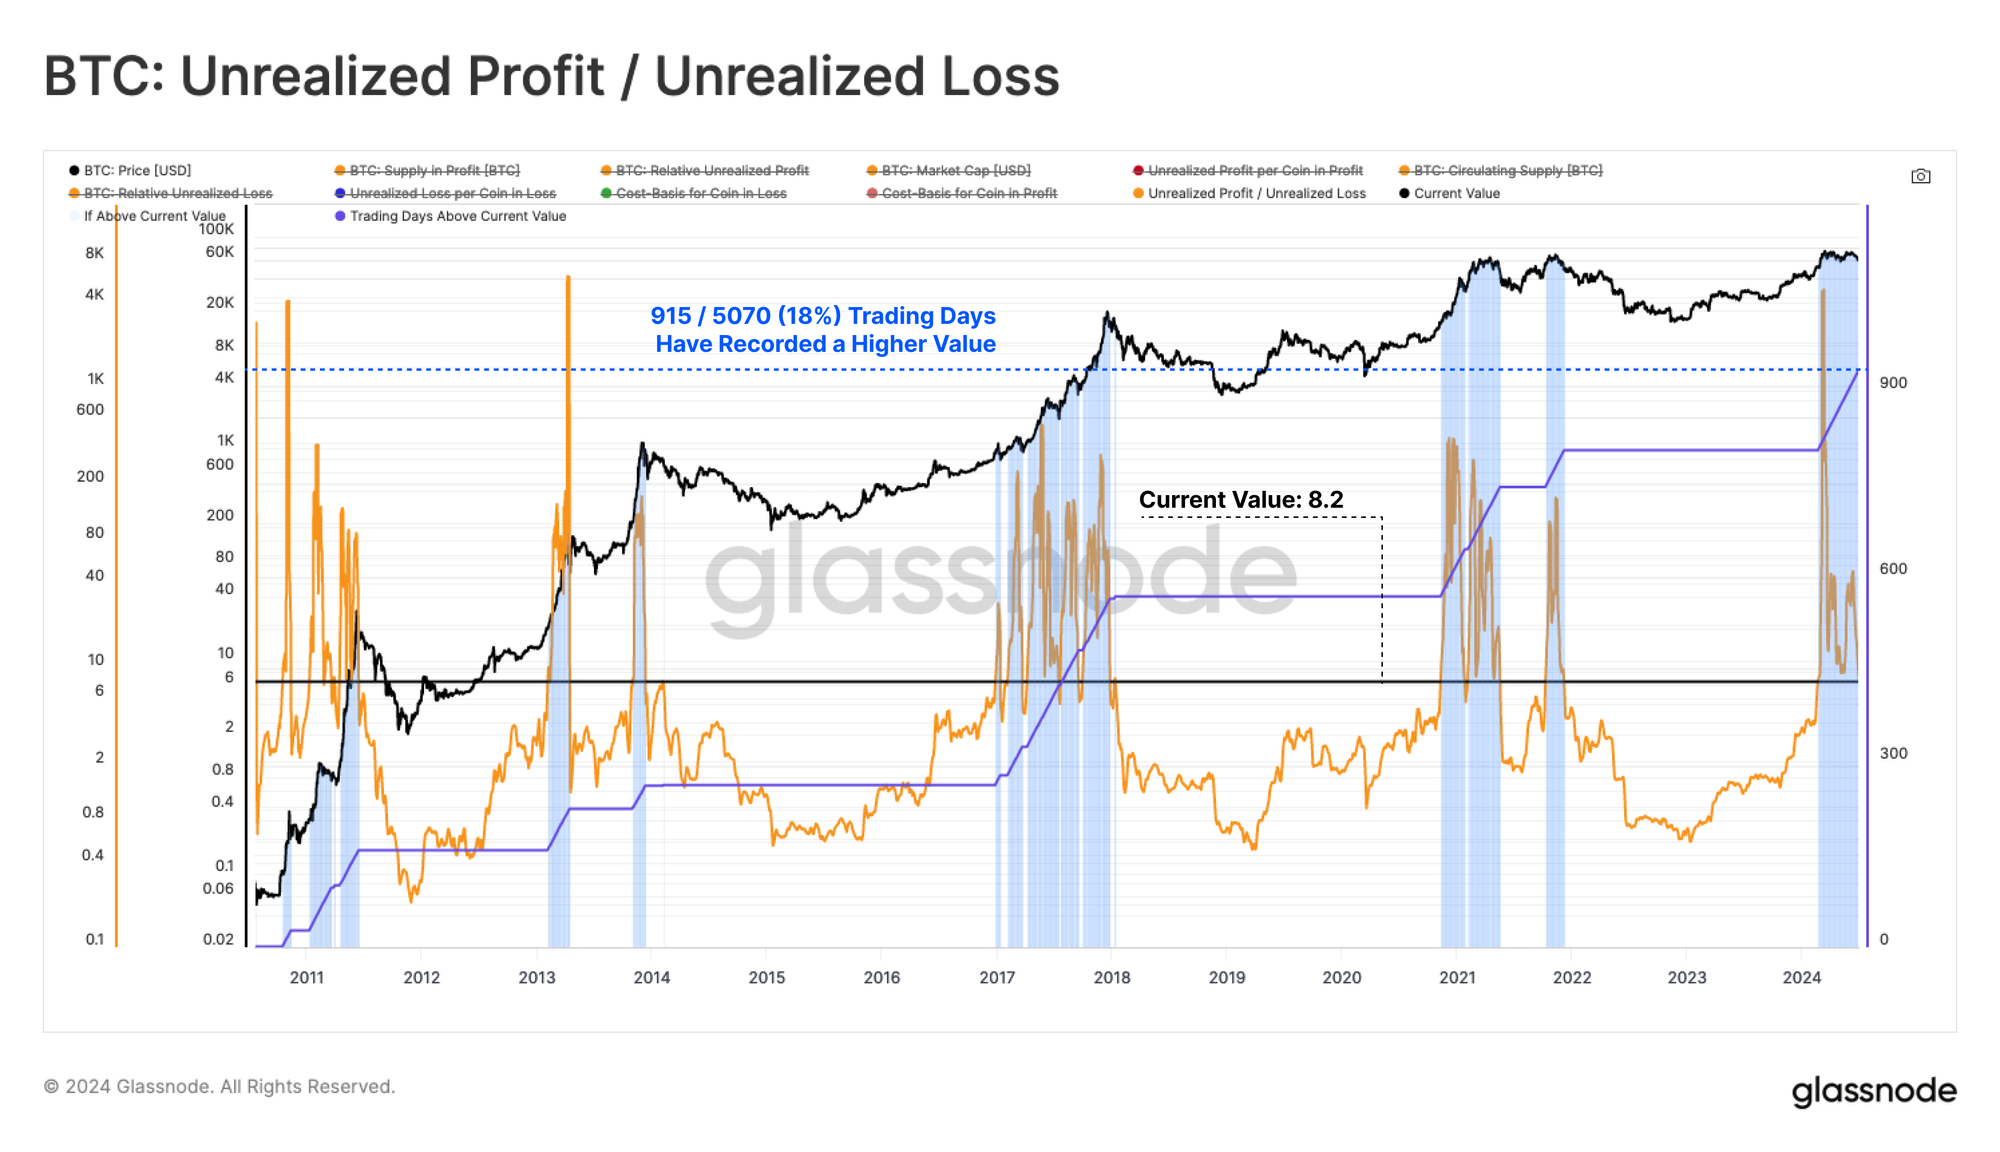
If we look at the ratio between the unrealized profit/loss per coin, we can see that the magnitude of paper gains held is 8.2x larger than paper losses. Only 18% of trading days have recorded a larger relative value, all of which are within Euphoric bull market regimes.
It could be argued that the March ATH set following the approval of the ETFs had several characteristics which are coincident with historical bull market peaks.
Grounding Expectations Using Confluence
Bitcoin prices have been consolidating within a well defined $60k to $70k range since the March ATH, and a degree of investor apathy and boredom has taken hold. This has led to widespread indecision, and a market which has failed to establish a robust trend in either direction.
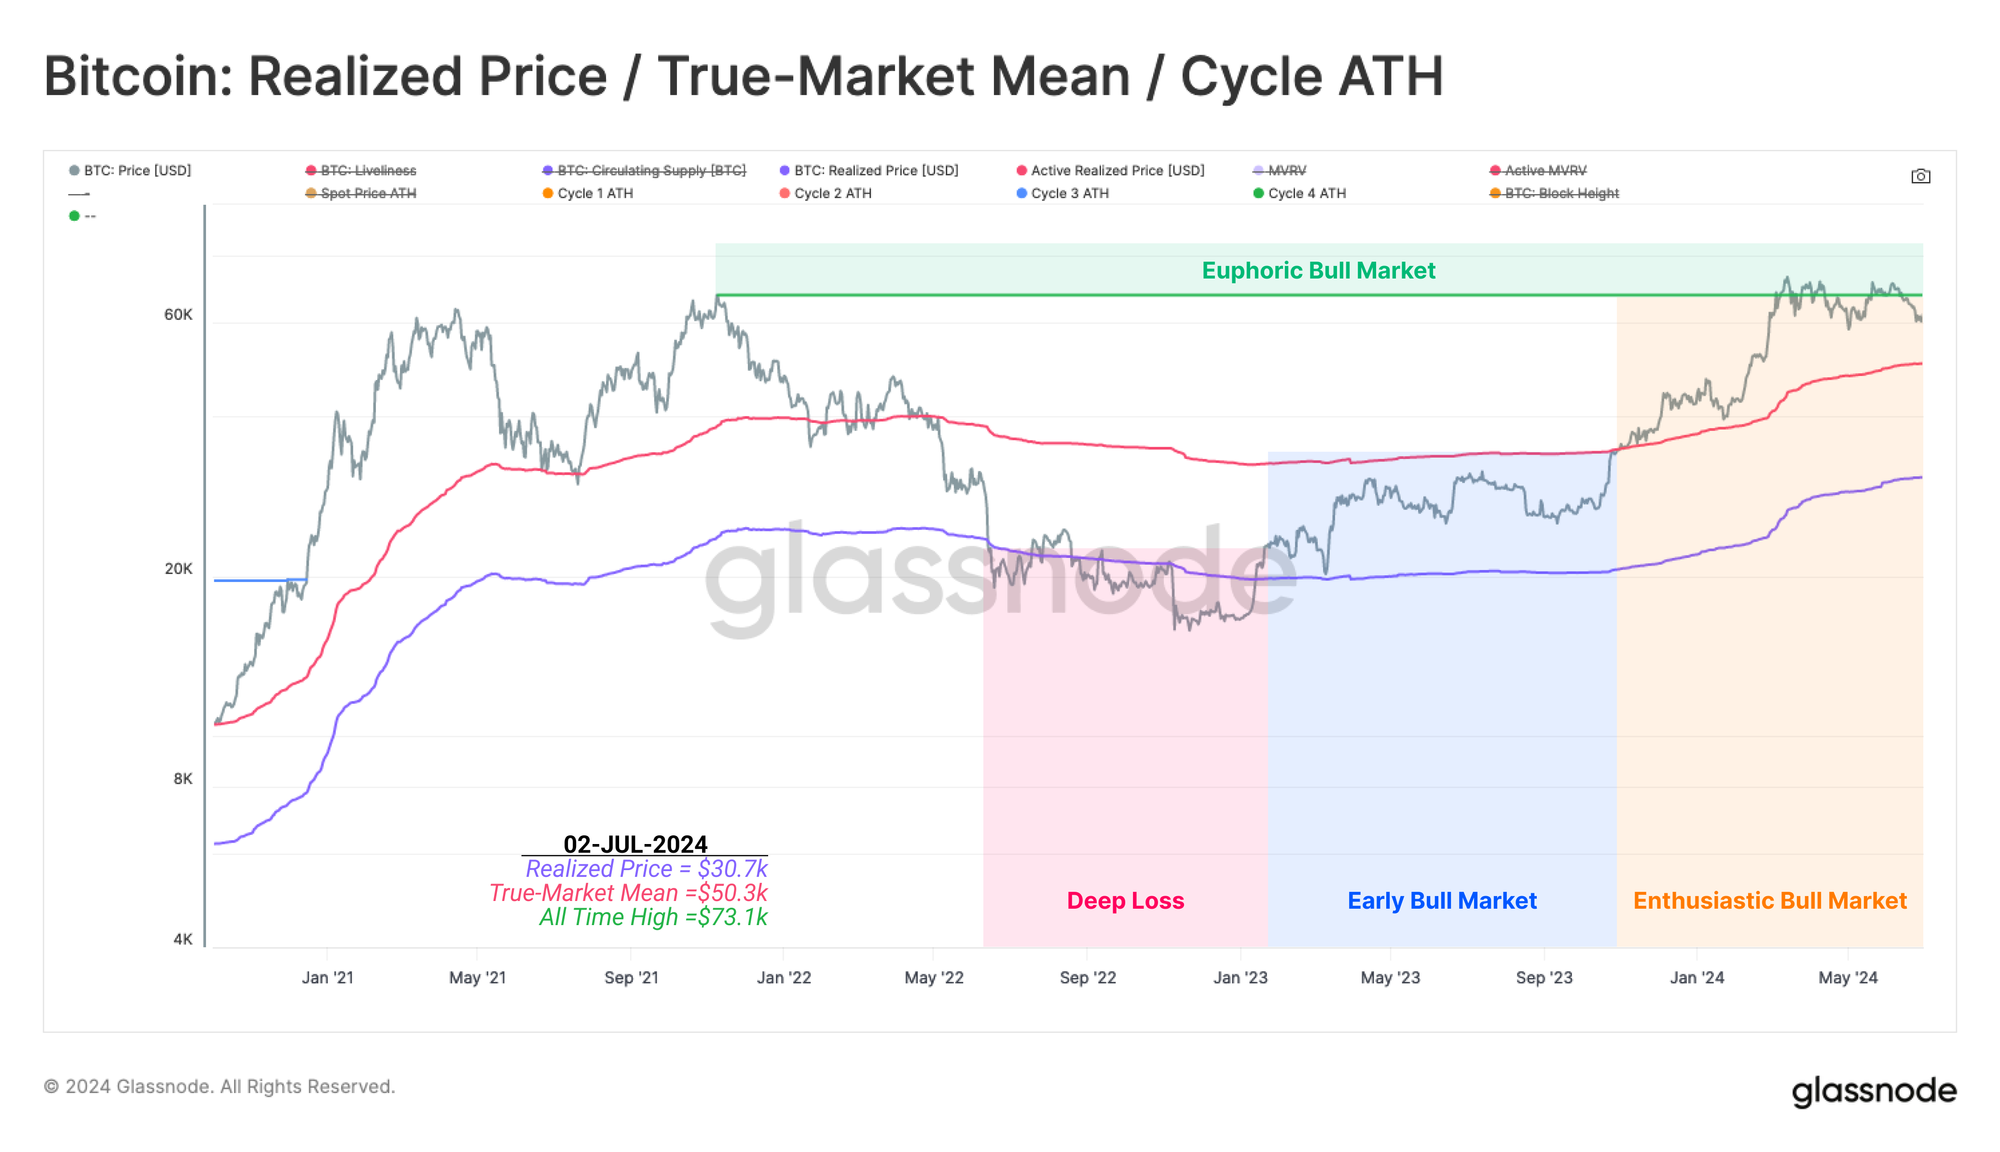
To ground our position in the cycle, we shall consult a simplified framework for thinking about historical Bitcoin market cycles:
- 🔴 Deep Bear Market: Prices trades below the Realized Price.
- 🔵 Early Bull Market: Prices trade between Realized Price and True Market Mean.
- 🟠 Enthusiastic Bull Market: Prices trade between the ATH and True Market Mean.
- 🟢 Euphoric Bull Market: Prices trade above the previous cycles ATH.
At the moment, prices remains within the Enthusiastic bull regime, after a few very brief excursions into the Euphoric zone. The True Market Mean resides at a value of $50k, which represents the average cost basis per active investor.
This level remains a key pricing levels for the market to remain above if the macro bull market is expected to continue.
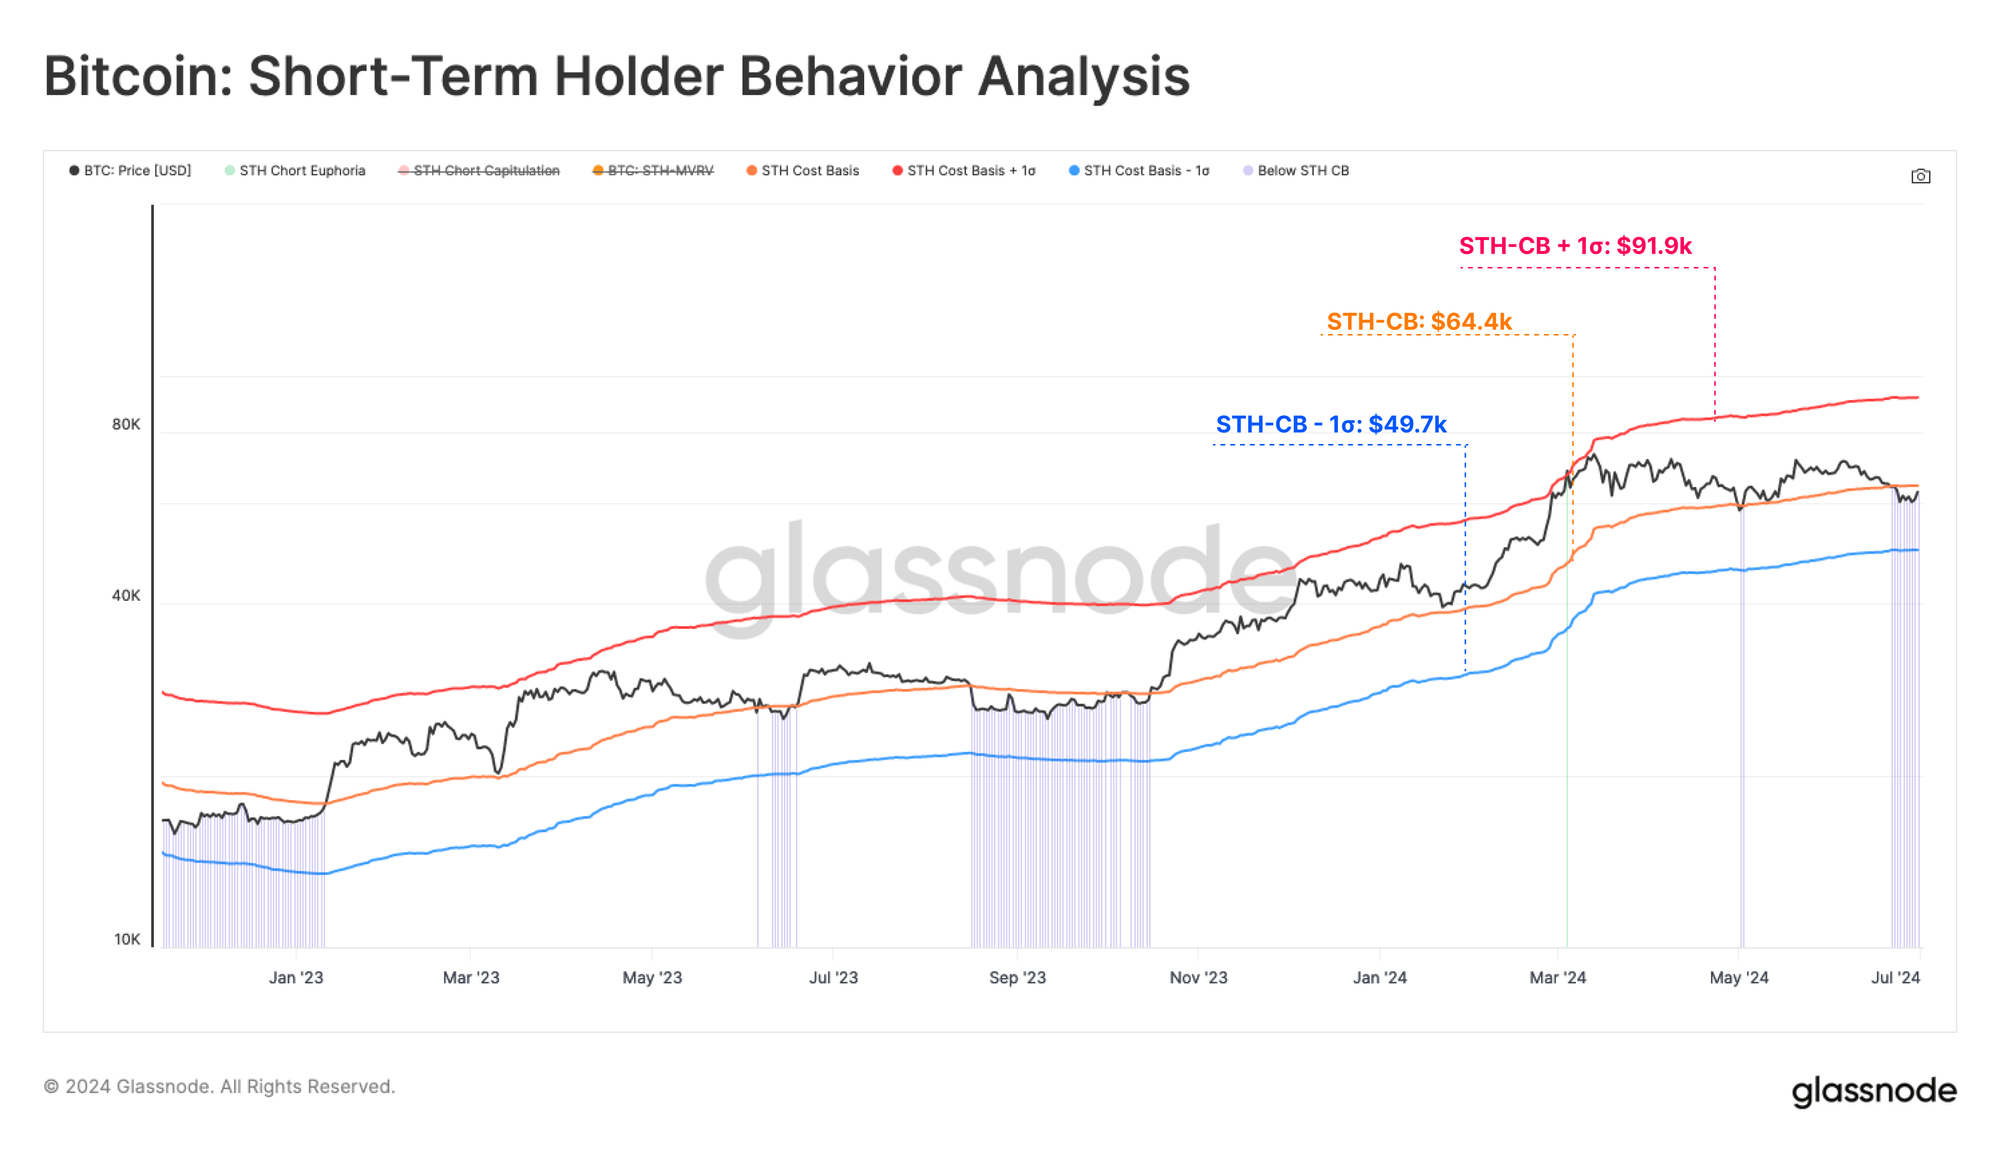
Next we will look towards the Short-Term Holder cohort, and overlay their cost basis with levels denoting +-1 standard deviations from it. This provides insight into areas where these price sensitive holders may start to react:
- 🔴 Significant unrealized profit signals a potentially overheated market, which is currently at a value of $92k.
- 🟠 The break-even level of the STH cohort is at $64k, which the spot price is currently below, but making an attempt to reclaim.
- 🔵 Significant unrealized loss signals a potentially oversold market, which is currently at at a value of $50k. This aligns with True Market Mean as a bull market break-point.
Of note, only 7% of trading days have recorded spot prices trading below the -1SD band, making it a relatively uncommon occurrence.
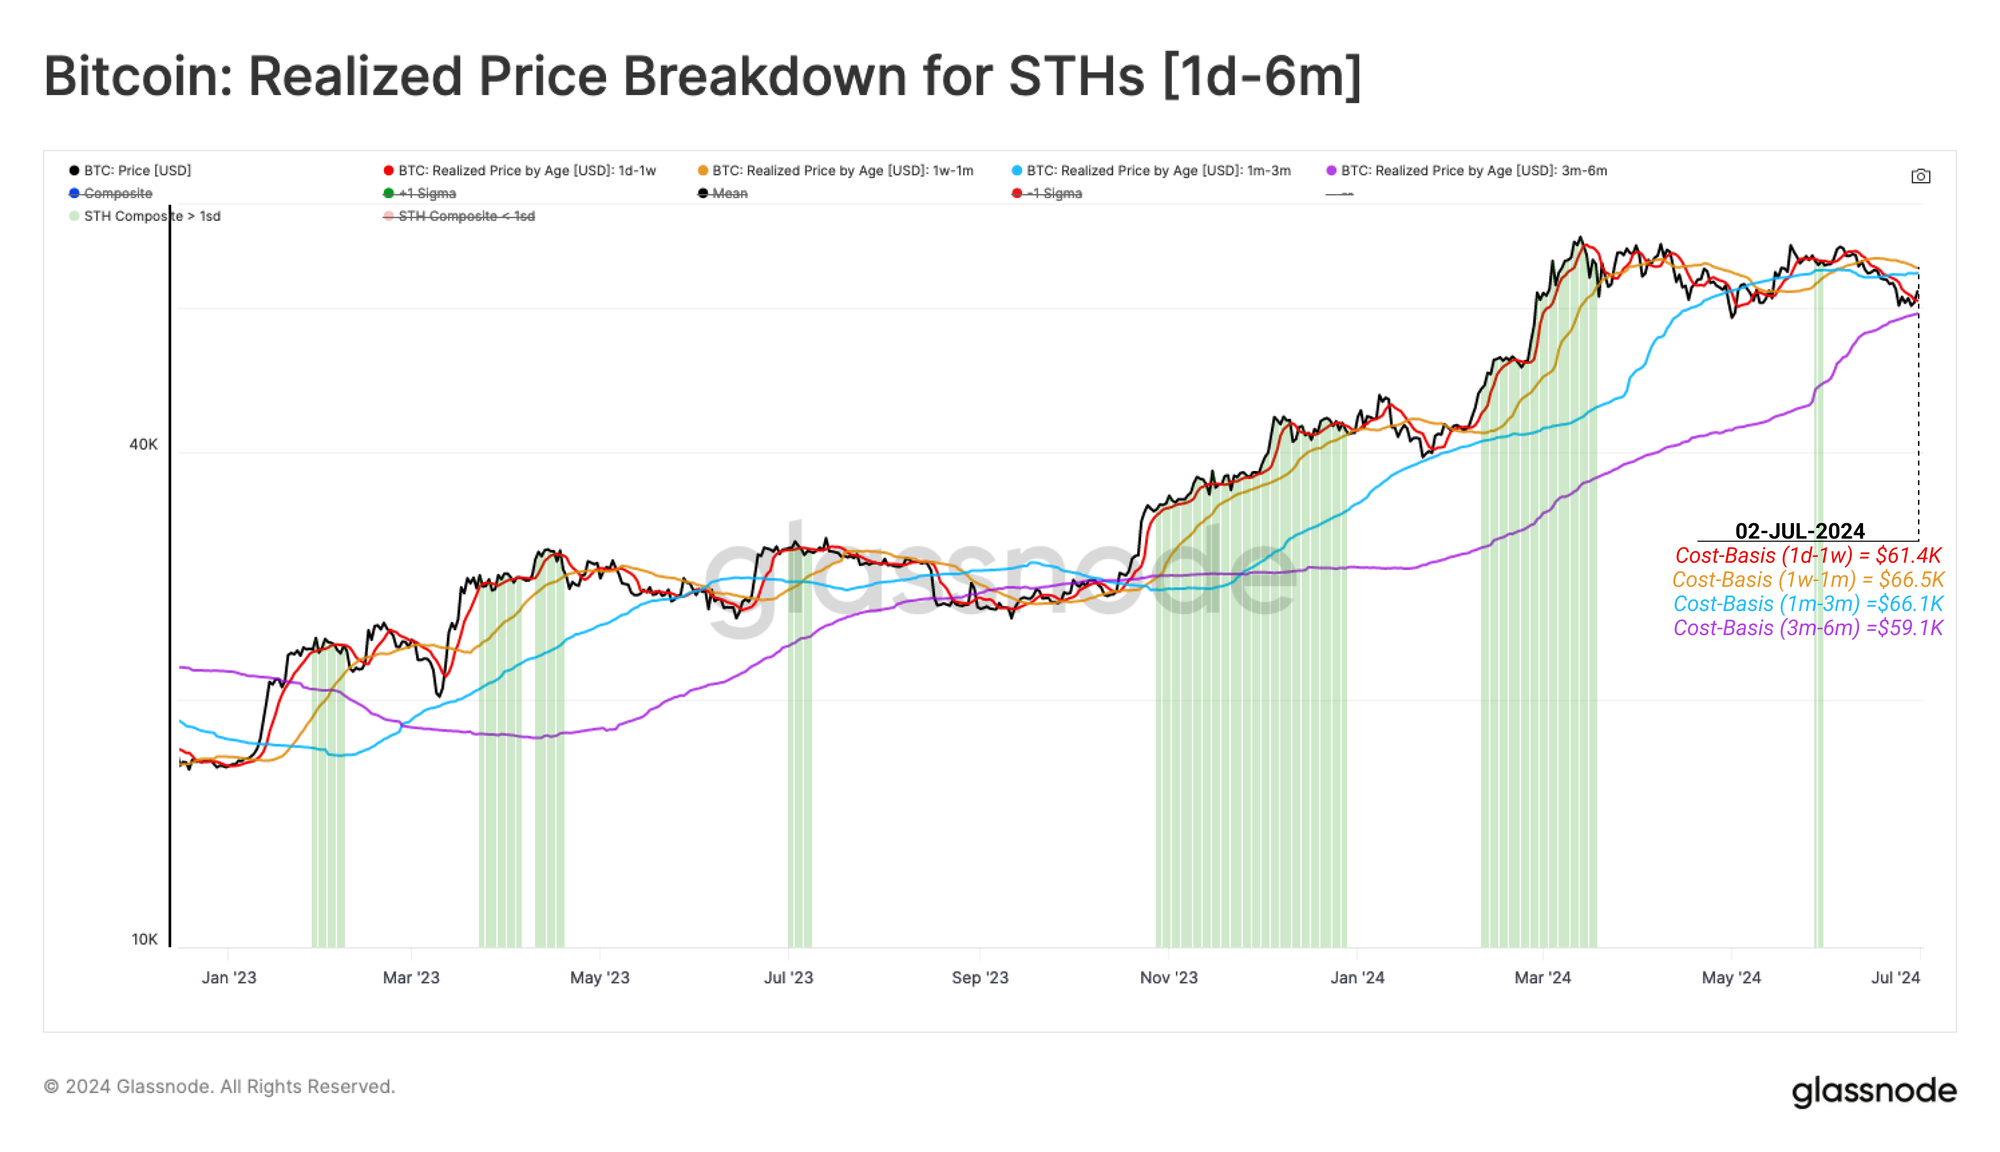
With price trading below the STH cost basis, it is judicious to inspect the degree of financial stress within various subsets of this cohort. Using our breakdown by age metrics, we can dissect and inspect the cost-basis of differing age constituents within the Short-Term Holder cohort.
Currently, coins aged 1d-1w, 1w-1m and 1m-3m are all holding an unrealized loss on average. This shows that this consolidation range has been largely unproductive for traders and investors.
The 3m-6m cohort remains the only sub-group to remain in an unrealized profit, with an average cost-basis of $58k. This aligns with the price low of this correction, which again marks this as a key area of interest.
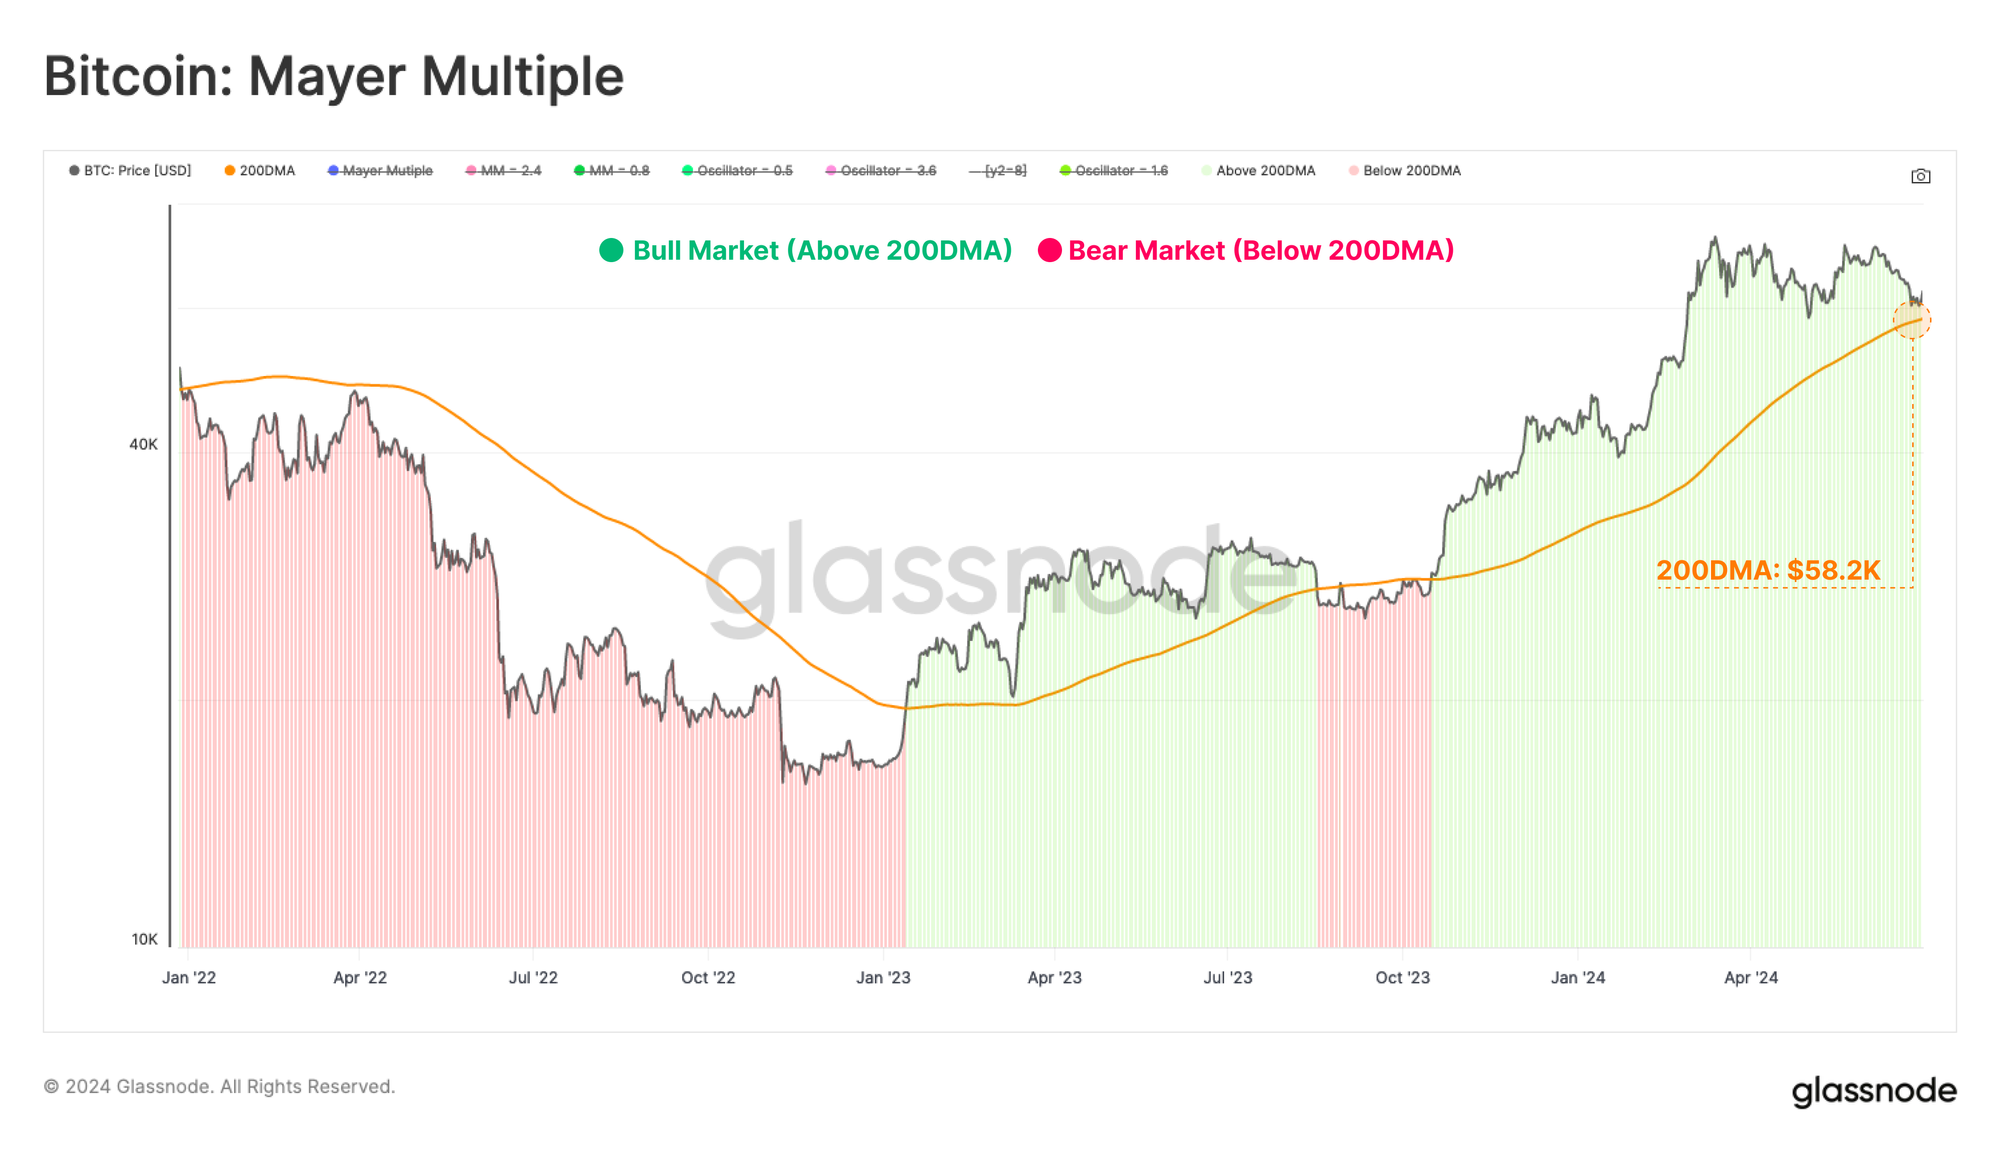
Moving towards technical indicators. we can use the widely used Mayer Multiple metric, which assesses the ratio between price and its 200DMA. The 200DMA is often used as a simple indicator for assessing bullish or bearish momentum, making any breaks above or below a key market pivot point.
The 200DMA currently resides at a value of $58k, once again providing confluence with on–chain price models.
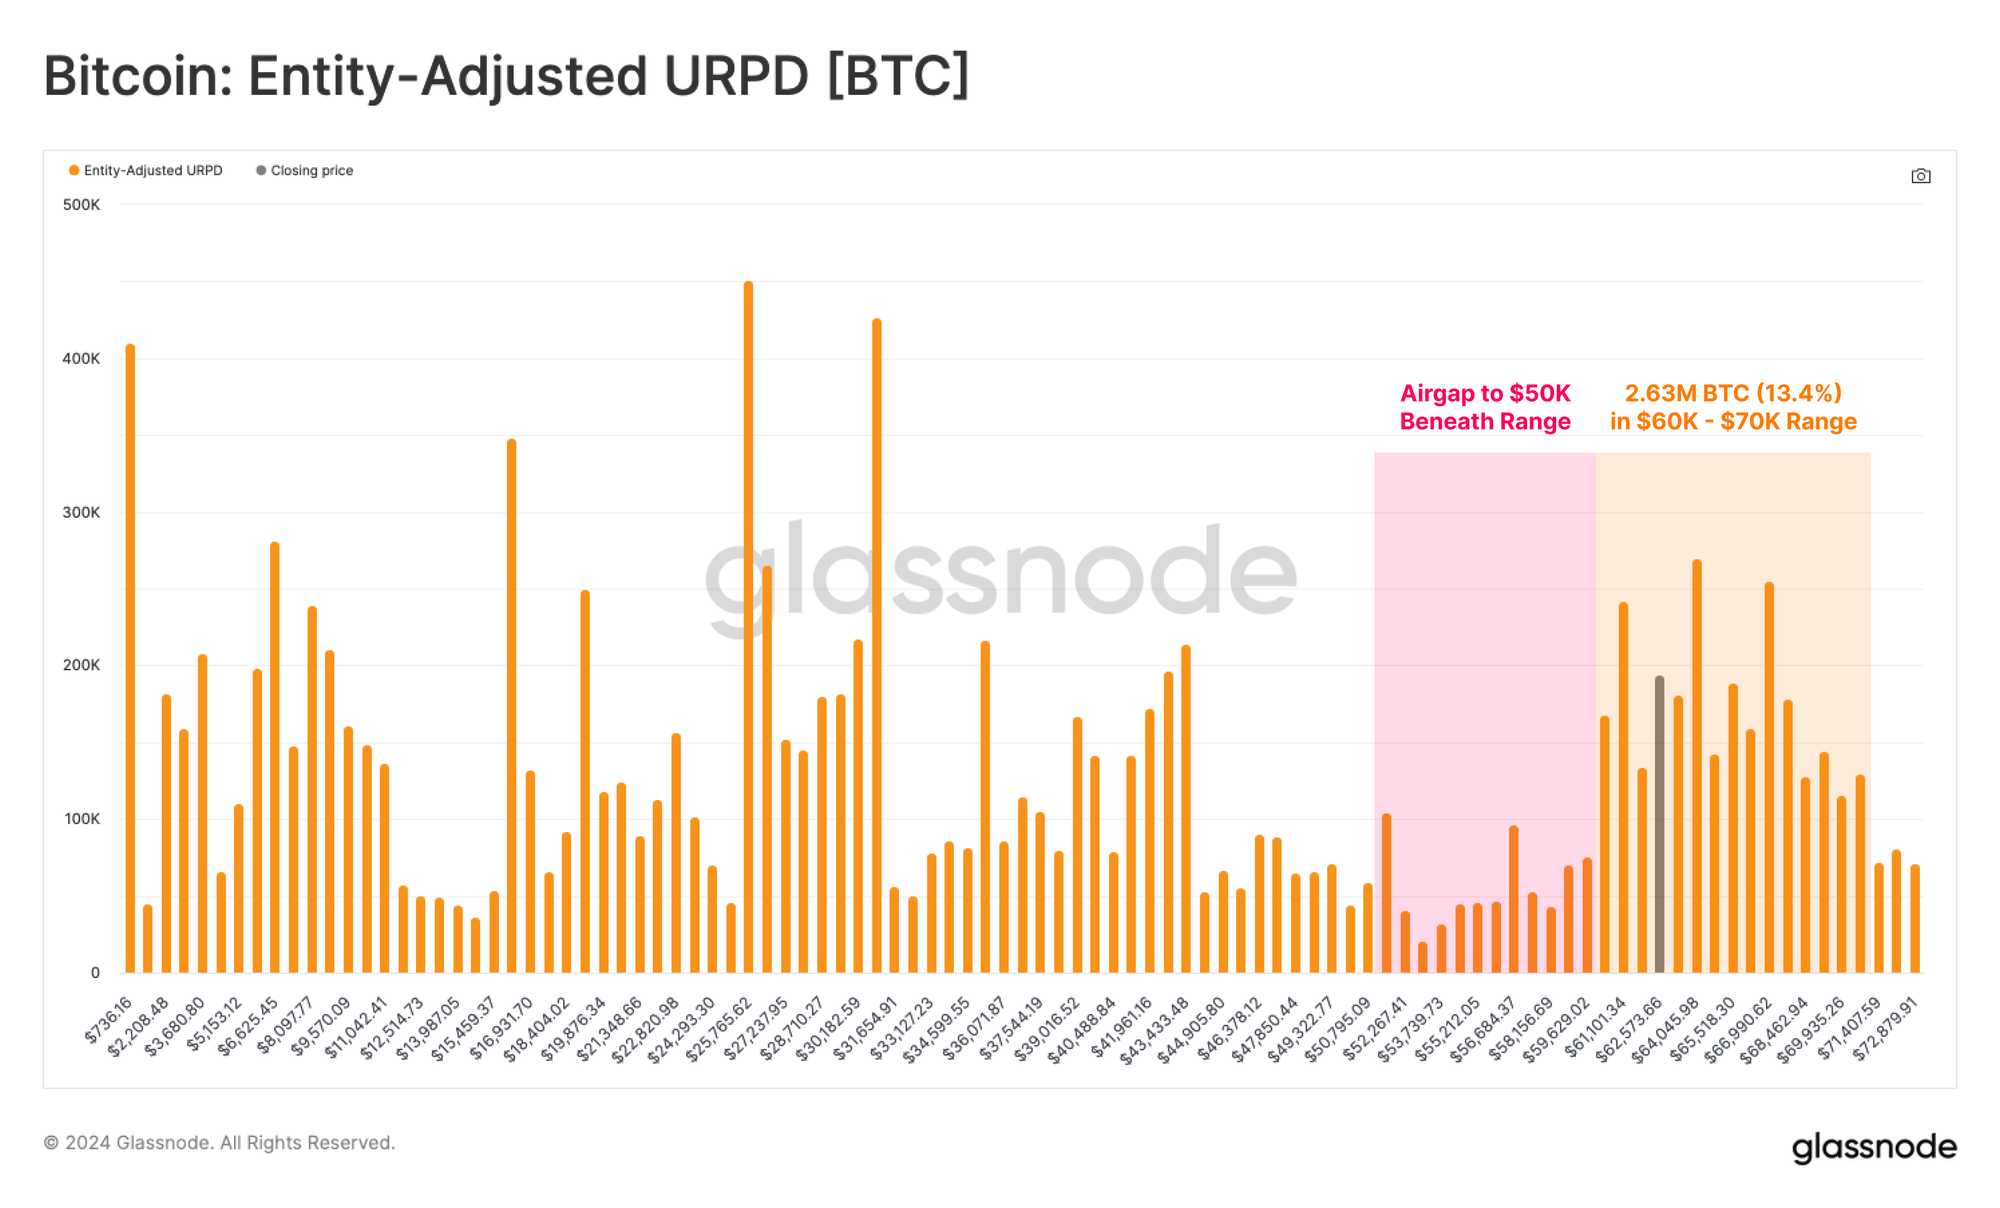
We can use the URPD metric to further assess concentrations of supply around particular cost basis clusters. Currently, the spot price is near the lower bound of a large supply node between $60k and the ATH. This aligns with the cost basis models of Short-Term Holders.
With 2.63M BTC (13.4% of the circulating supply) located within the $60k to $70k cluster, small price fluctuations are able to substantially affect the profitability of coins and investor portfolios.
Overall, this indicates a risk that many investors may be sensitive to any price drops below $60k.
Volatility Expectations
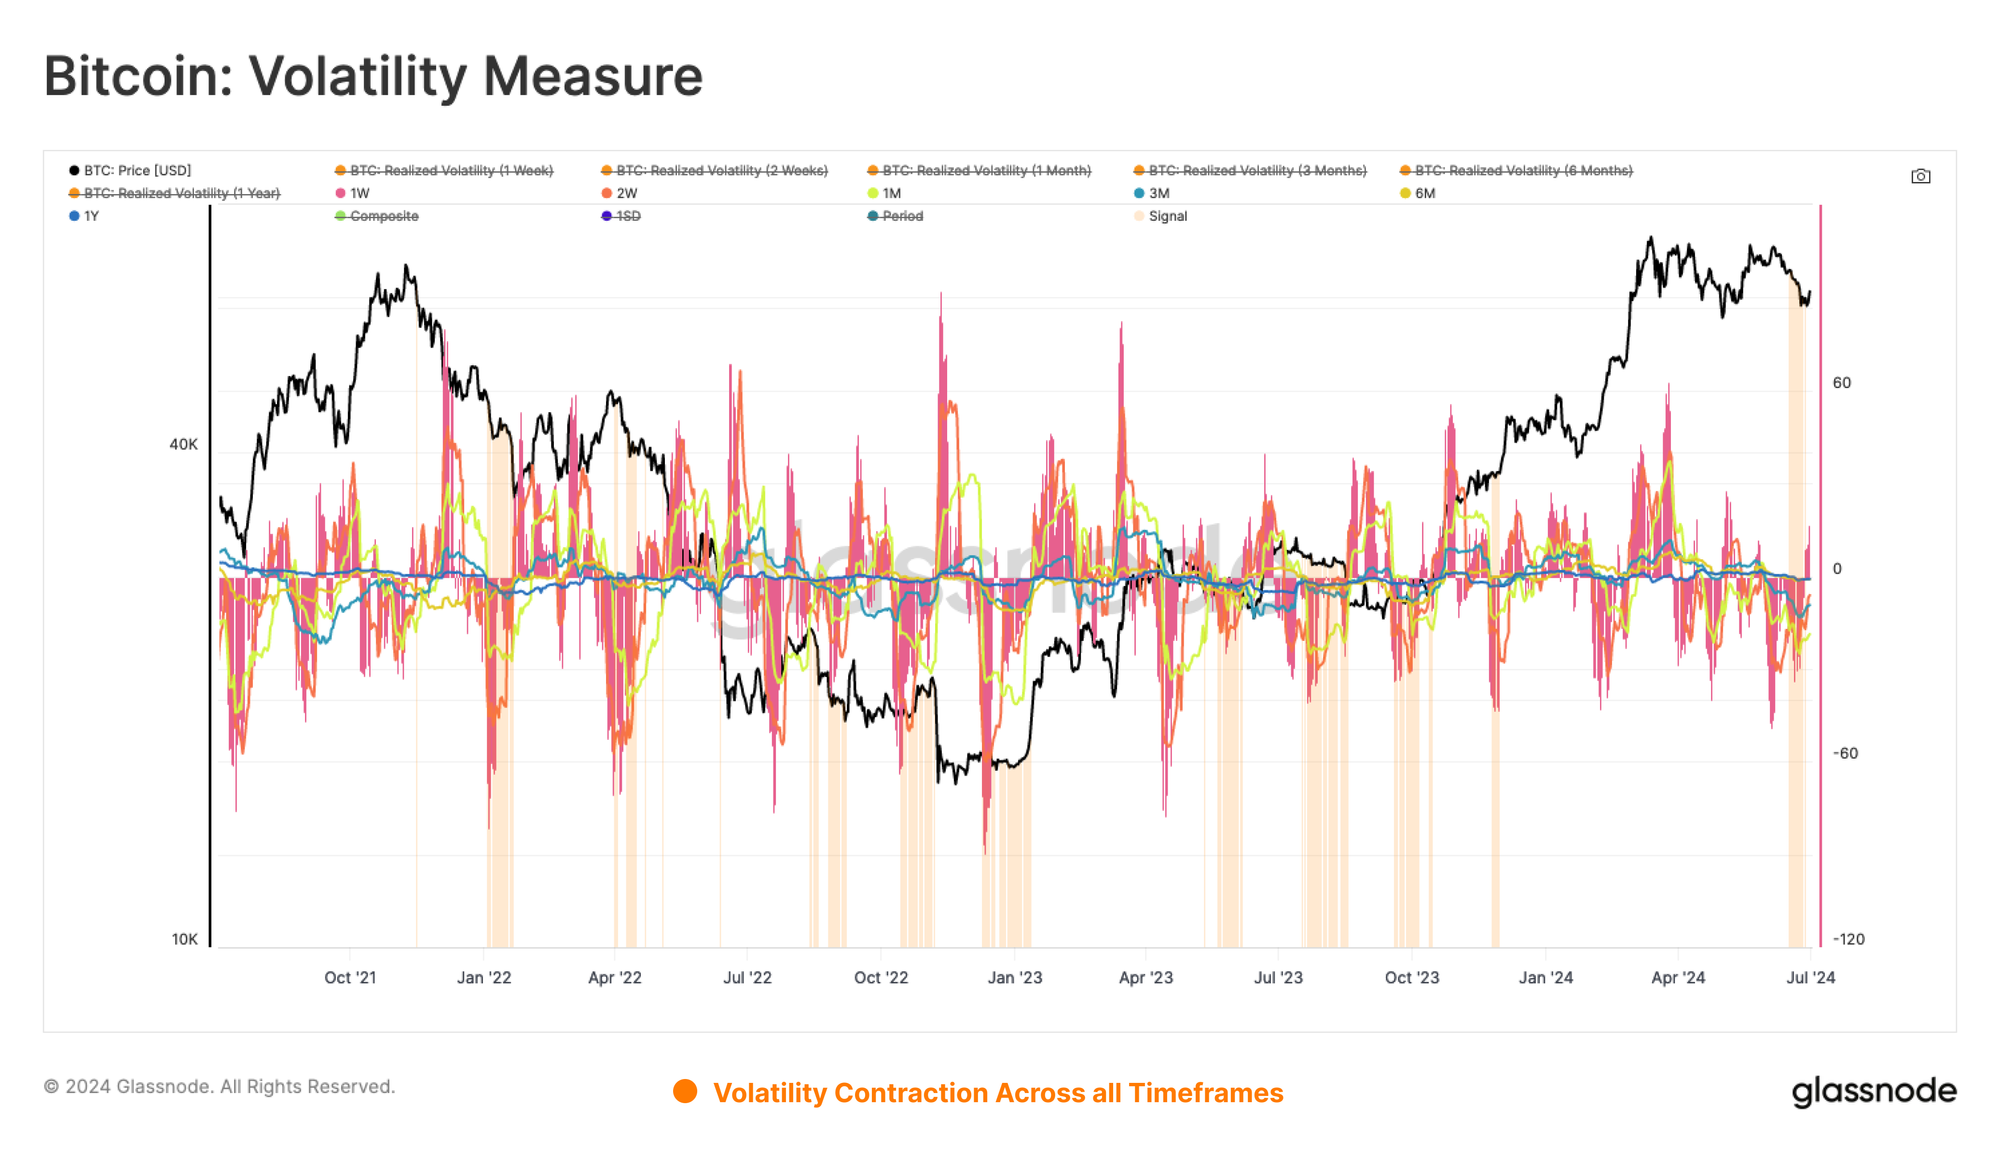
After several months of range-bound price action, we note a marked decline in volatility across many rolling window time frames. To visualise this phenomena, we introduce a simple tool to detect periods of realized volatility contraction, which often provides an indicator that heightened volatility is likely ahead.
The model assesses the 30d change in Realized Volatility across 1-week, 2-week, 1-month, 3-month, 6-month and 1-year timeframes. When all windows are exhibiting negative 30d change, a signal is triggered, inferring that volatility is compressing, and so are investor expectations of lower volatility ahead.
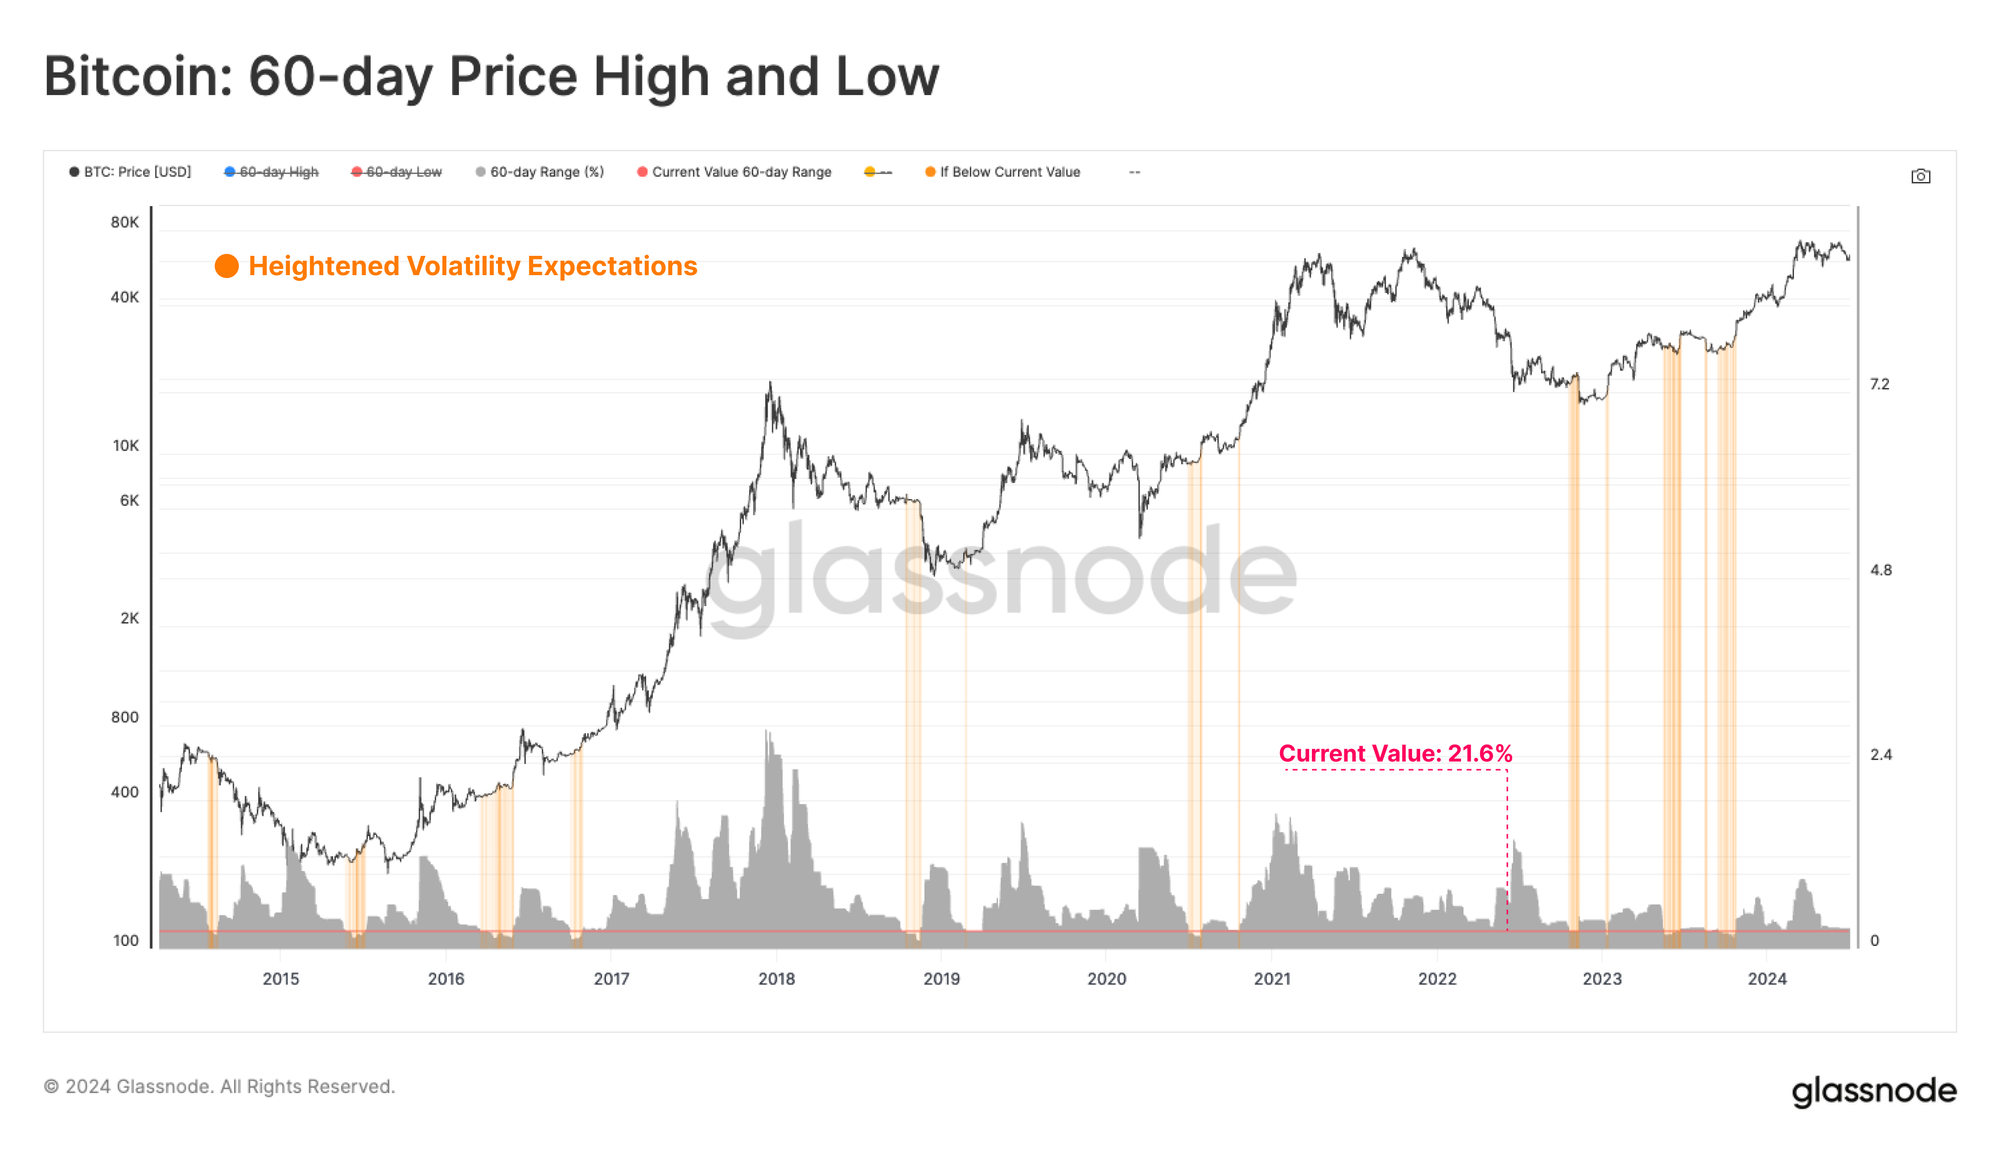
We can also assess market volatility by measuring the percent range between the highest and lowest price ticks over the last 60-days. By this metric, volatility continues to compress to levels rarely seen, but usually after lengthy consolidations, and prior to large market moves.
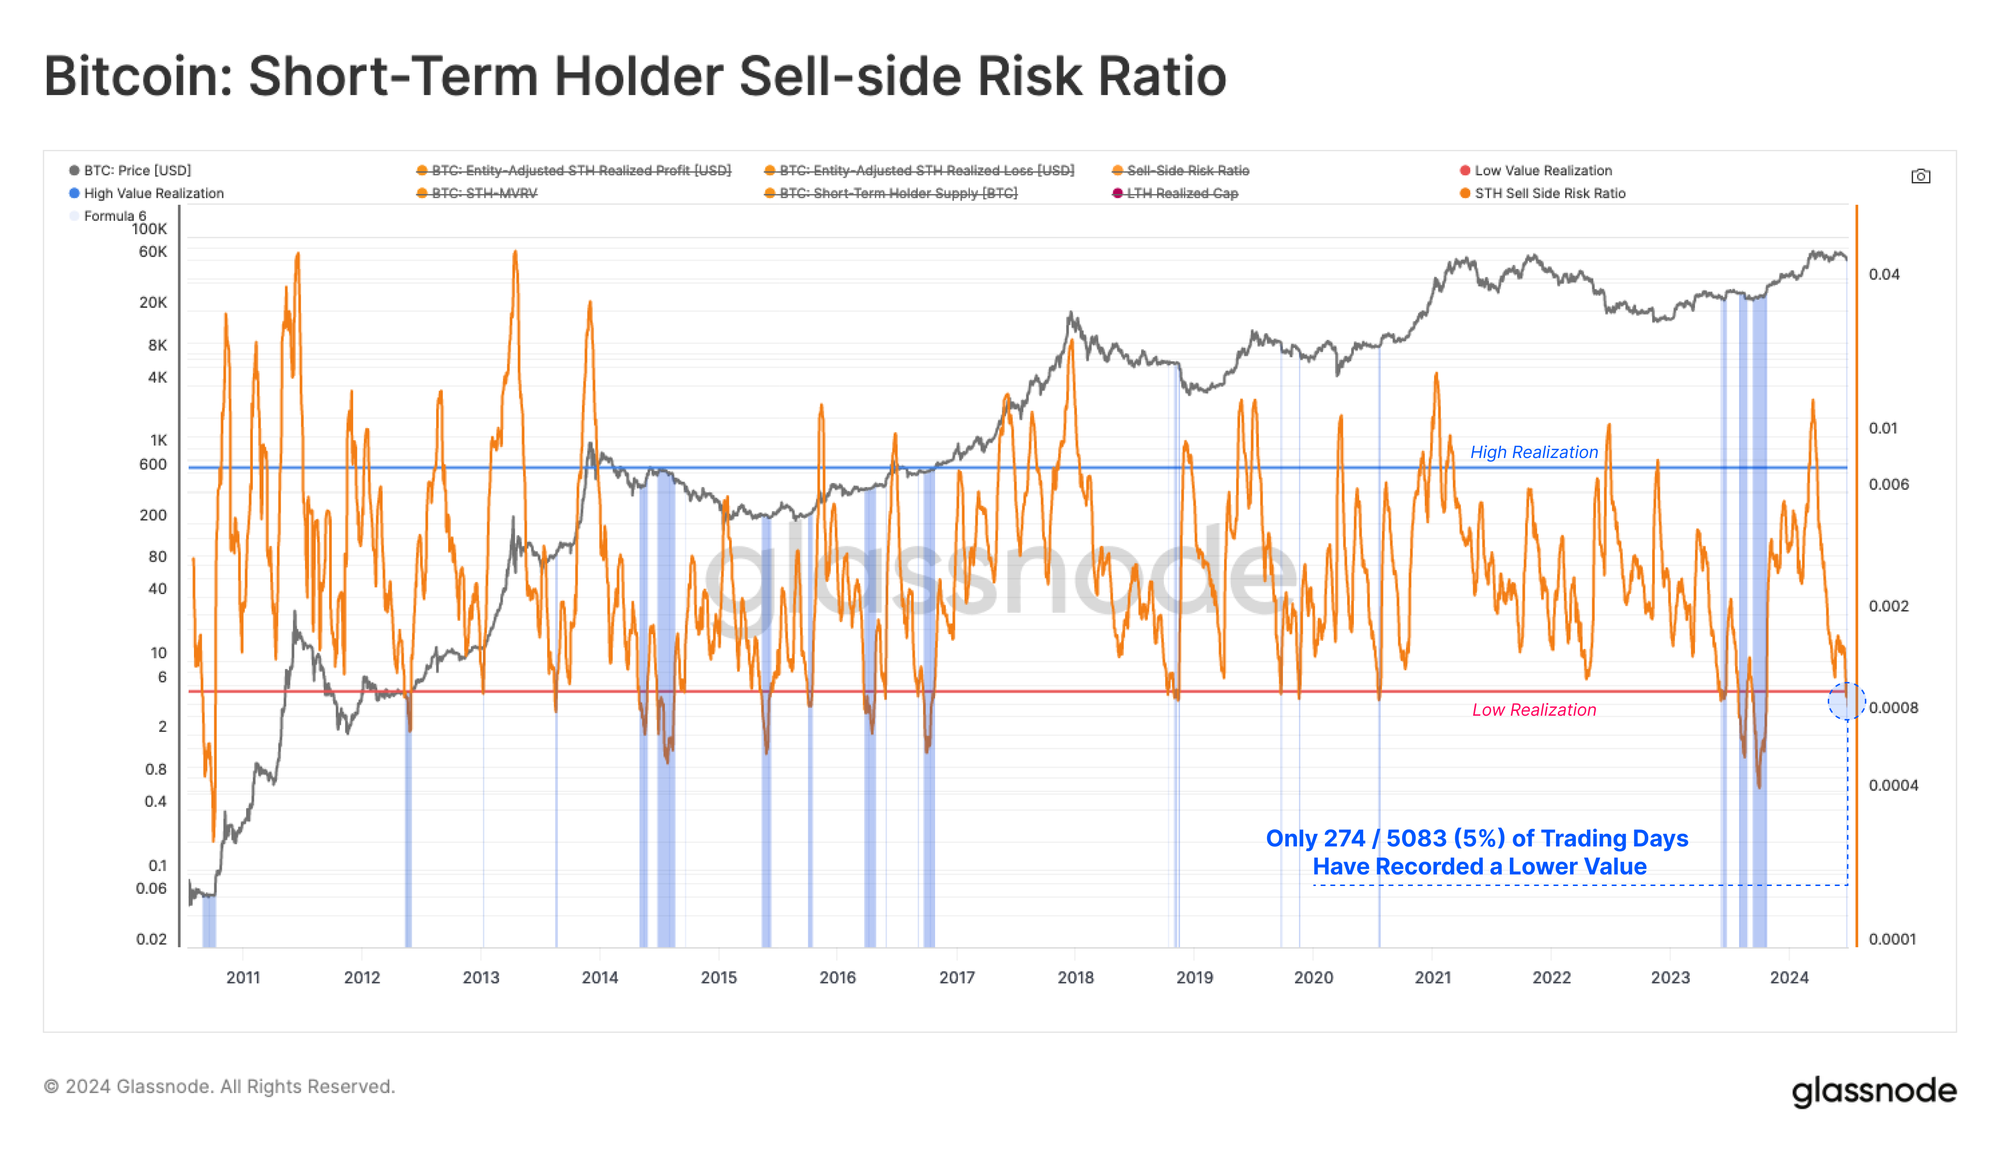
Finally, we can bolster our volatility assessment using the Sell-Side Risk Ratio. This tool assesses the absolute sum of realised profit and loss locked in by investors, relative to the size of the asset (the Realized Cap). We can consider this metric under the following framework:
- High values indicate that investors are spending coins at a large profit or loss relative to their cost basis. This condition indicates that the market likely needs to re-find equilibrium, and usually follows a high volatility price move.
- Low values indicate that the majority of coins are being spent relatively close to their break even cost basis, suggesting a degree of equilibrium has been reached. This condition often signifies an exhaustion of ‘profit and loss’ within the current price range, and usually describes a low volatility environment.
Notably, the STH Sell-Side Risk has contracted to historic lows, with only 274 out of 5083 trading days (5%) recording a lower value. This suggests that a degree of equilibrium has been established during this price consolidation, and alludes to heightened volatility expectations in the near future.
Summary and Conclusion
The Bitcoin market is in an interesting place, with apathy and boredom dominating, despite prices being 20% below the ATH. The average coin is still holding a 2x unrealized profit. however newer buyers are disproportionately underwater on their positions.
We also explored key pricing levels where investor behavior patterns may shift. We sought a degree of confluence across both on-chain and technical indicators, and derived three key areas of interest.
- A break below $58k to $60k would put a significant number of STHs into loss, and trade below the 200DMA price level.
- Price action between $60k and $64k continues the current sideways trajectory of market indecision.
- A decisive break above $64k would put a meaningful volume of STH coins back into profit, with a likely uptick in investor sentiment.
Volatility continues to compress across multiple time-frames, both from a pricing, and an on-chain perspective. Metrics like the Sell-Side Risk Ratio, and 60-day price range have fallen towards historic lows. This suggests that the current trading range is in the later stages of developing towards the next range expansion.
Disclaimer: This report does not provide any investment advice. All data is provided for information and educational purposes only. No investment decision shall be based on the information provided here and you are solely responsible for your own investment decisions.
Exchange balances presented are derived from Glassnode’s comprehensive database of address labels, which are amassed through both officially published exchange information and proprietary clustering algorithms. While we strive to ensure the utmost accuracy in representing exchange balances, it is important to note that these figures might not always encapsulate the entirety of an exchange’s reserves, particularly when exchanges refrain from disclosing their official addresses. We urge users to exercise caution and discretion when utilizing these metrics. Glassnode shall not be held responsible for any discrepancies or potential inaccuracies. Please read our Transparency Notice when using exchange data.
- Join our Telegram channel
- For on-chain metrics, dashboards, and alerts, visit Glassnode Studio
- For automated alerts on core on-chain metrics and activity on exchanges, visit our Glassnode Alerts Twitter
