Pressure Builds on Diamond Hands

With many signals suggesting a widespread capitulation has taken place, attention turns to whether a Bitcoin bottom is forming. Here, we analyse the characteristics and duration of previous bear cycles, to assess what may lie on the road ahead.

Pressure Builds on Diamond Hands

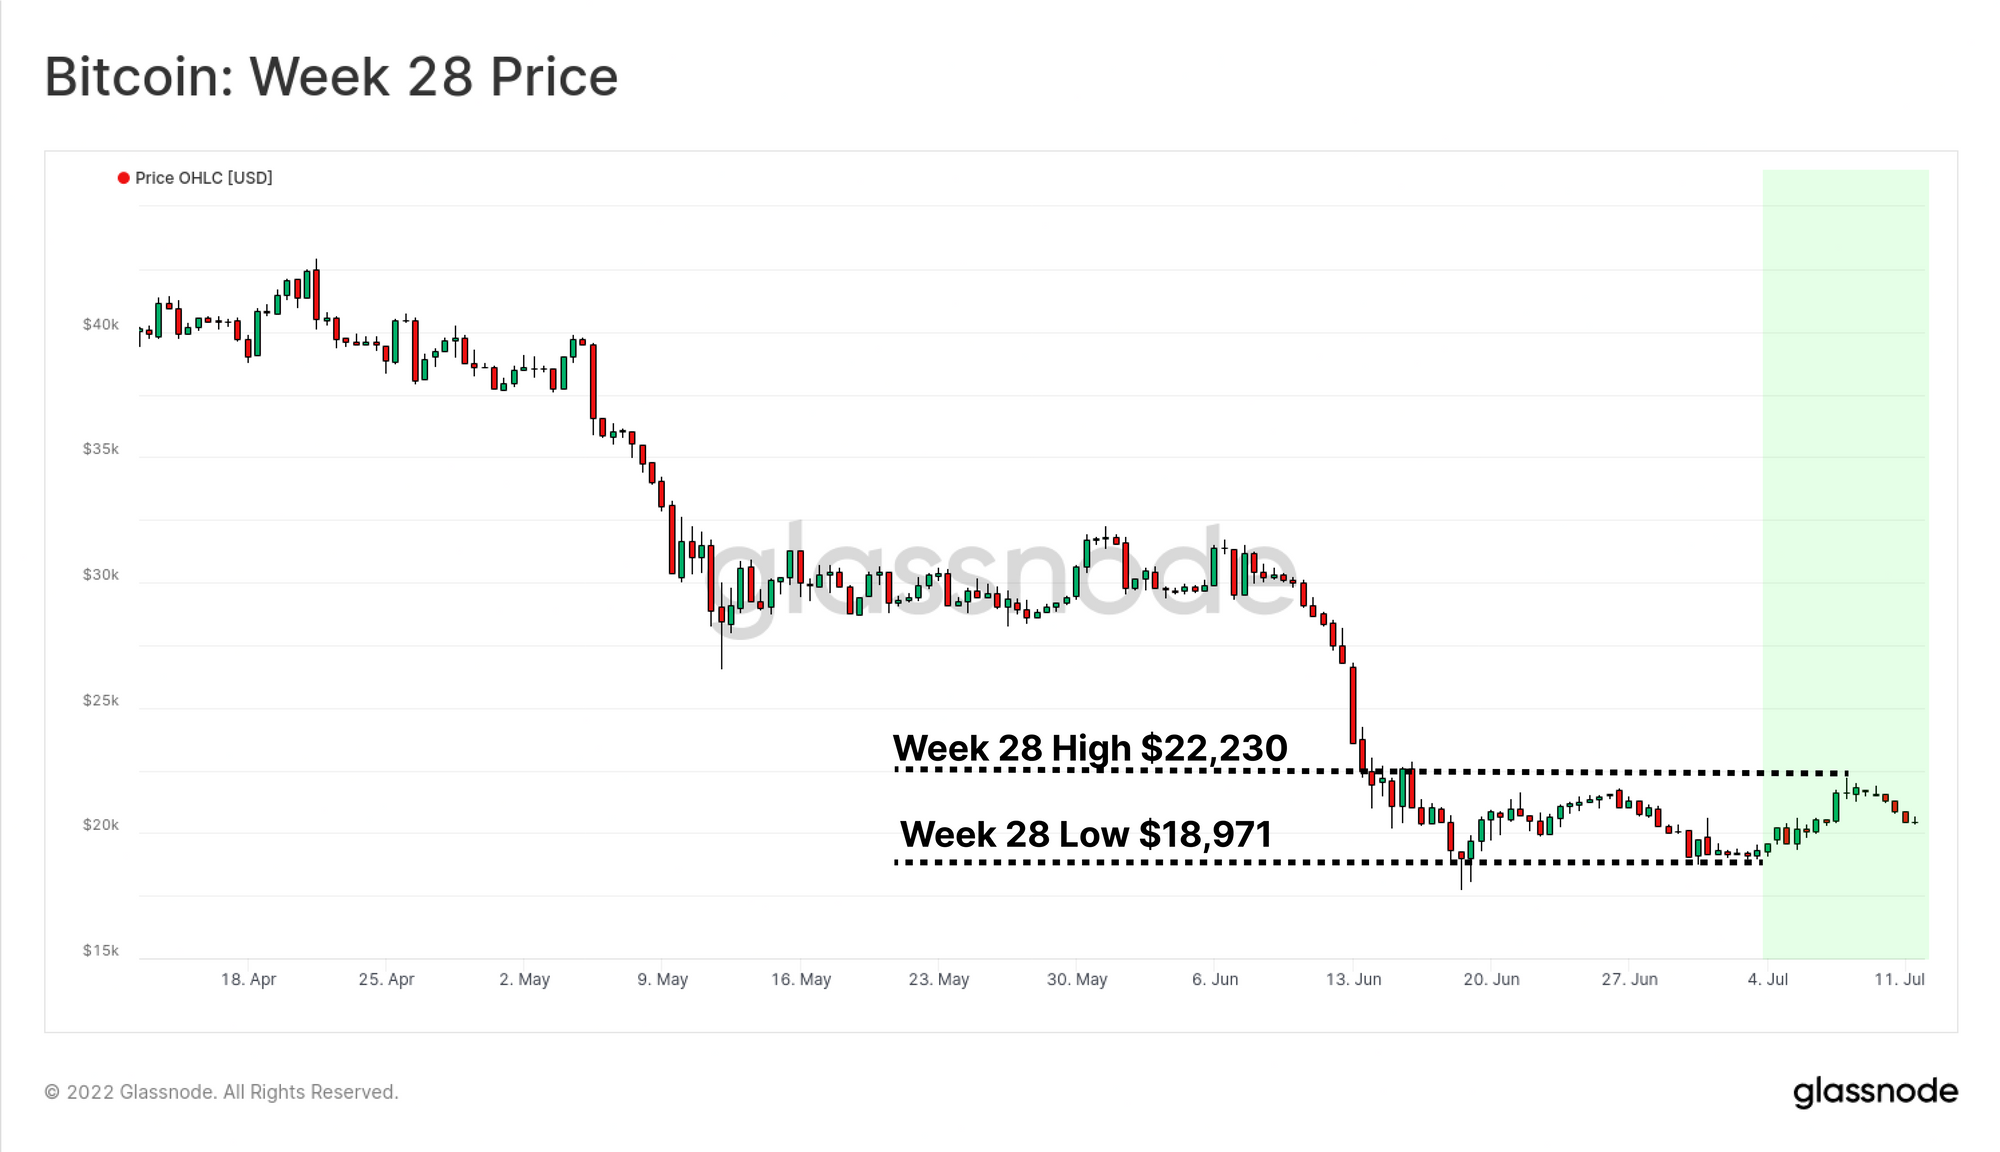
Bitcoin prices continue to consolidate around the $20k range this week, as the market digests the extreme downside volatility of June. Prices traded higher, opening at a weekly low of $18,971, and peaking at $22,230.

With the market now down over 75% from the all-time-high, even the strongest and longest term Bitcoin holders are feeling the pressure. Both Long-Term Holders and Miners are in the spotlight this week, as the market attempts to find a bottom amidst persistent macroeconomic uncertainty.

In this edition, we will seek to extract and identify key characteristics that have historically described the formation of Bitcoin bear market floors. This is a period of time where forced sales pass by, seller exhaustion is reached, and downside pressure begins to wane. We will explore this from a number of angles ranging from:

  • A final flush out of even the strongest hands, creating seller exhaustion.
  • The redistribution of wealth from low to high conviction holders.
  • A recovery of demand from both Big and Small entities.
  • A capitulation of the miner cohort which appears to be underway.

Translations

This Week On-chain is now being translated into Spanish, Italian, Chinese, Japanese, Turkish, French, Portuguese, Farsi, Polish, Russian and Greek.

The Week Onchain Dashboard

The Week Onchain Newsletter has a live dashboard with all featured charts available here. This dashboard and all covered metrics are explored further in our Video Report, which is released on Tuesdays each week. Visit and subscribe to our Youtube Channel, and visit our Video Portal for more video content and metric tutorials.


Wealth Redistribution

The prevailing bear market has numerous similarities to late-2018 in terms of market structure, which we can see in the Drawdown from the ATH metric. The following compares the current 2022 bear, with the 2018 bear market:

  • December 2017 - March 2019: The fallout from the 2017 parabolic top extended for almost 15 months, culminating in a 85% drawdown from the ATH. The $6K area can be seen as the base level breakpoint before the ultimate capitulation, where an additional -50% was wiped from the market over the course of 1-month.
  • November 2021 - July 2022: The current Bear Market has experienced a peak drawdown of 75%, with the $29K floor acting as a similar breakpoint base level. The latest capitulation in mid-June saw prices tumble -40% to $17.6k in just two weeks.
Live Chart

One of the main outcomes of a lengthy bear market is the redistribution of wealth among the stakeholders who remain. This progressive changing of hands can be analyzed by tracking the UTXO Realized Price Distribution (URPD).

As highlighted in Week On-Chain 23, past bear markets, have had two distinct phases:

  • Post-ATH Phase: Where the short-term investors and speculators (low conviction) gradually come to terms with the bear market reality and exit into a depreciating price trend. Moreover, some participants attempt counter-trading the macro trend leading to multiple temporary relief rallies (the dead cat bounce).
  • Bottom Discovery Phase: Diminishing profitability and an extended period of financial pain results in declining new demand and creates favourable conditions for ultimate capitulation.

First, we will inspect the market from Dec 2017 to March 2019. Notice how price acts like a magnet, first attracting supply from top buyers towards the $6k region, and finally, an enormous redistribution occurs post capitulation into the $3k to $4k range. This describes a two part capitulation cycle, and eventual bottom formation

Live Chart

In the current 2022 market, we have a similar structure so far following the November 2021 ATH. We can see a similar redistribution pattern occurs around the $30k floor, originally established in May-July 2021. Over the course of May-June this year, we can see prices trade down to the $20k region which becomes a significant trigger point for both investor capitulation, and new buyers, thus being a node for coins changing hands.

Live Chart

Capitulation of Diamond Hands

With the loss of the $30k price level, miners and long-term holders (LTHs) have come under stress (as explored in Week 25). To demonstrate the ongoing capitulation of 2021-22 cycle LTHs, we can monitor their profitability on two fronts; their actualized losses (spending) and unrealized losses (coins held below cost basis).

Long-Term Holder Spent Output Profit Ratio (LTH-SOPR) is a metric which indicates the profit ratio captured by LTHs (i.e. a value of 2.0 means LTHs are spending coins at a price which is 2x their cost basis). Therefore, when LTH-SOPR is less than one, these players realize losses or spend coins at a price below their cost basis.

LTH-SOPR is currently trading at 0.67, indicating the average LTH spending their coins is locking in a 33% loss.

Live Chart

Long-Term Holder Cost Basis estimates the average price long-term holders paid for their coins. Hence, as the market valuation falls below the LTH-Cost Basis, this cohort can be considered to be in aggregate loss. Similarly, LTHs are currently underwater on average, holding an aggregate unrealized loss of -14%.

Live Chart

The following chart combines these concepts and shows intervals which satisfy both conditions (in green). These moments are where LTHs are both underwater on held coins, and locking in losses based on their spending. In combination, this indicates there is an increased probability that a LTH capitulation is underway.

With the current value of LTH-SOPR at 0.67 and the LTH-Cost Basis at $22.3k, it means LTHs are realizing an average of -33% losses on each spent coin, despite spot prices only being ~6% below their cost basis. This signifies that LTHs who acquired coins at much higher are the primary spenders at the moment, and those who still hold coins from the 2017-20 cycle (or earlier) are largely sitting tight.

Live Workbench

The Transfer of Losses

A consequence of capitulation events is an immediate redistribution of coins to new buyers, whom are often classified as Short-Term Holders at first. Over time, however, the dominance of Long-Term Holders amongst the supply tends to increase, as fair-weather speculators are flushed from the market.

Bottom formation is often accompanied by LTHs shouldering an increasingly large proportion of the unrealized loss. In other words, for a bear market to reach an ultimate floor, the share of coins held at a loss should transfer primarily to those who are the least sensitive to price, and with the highest conviction.

This is the result of two mechanisms:

  • The exiting of entities with weak conviction (Short-Term Holders).
  • The gradual transfer of coins to entities with strong conviction, whom are relatively price-insensitive (Long-Term Holders)

In the depths of previous bear markets, the proportion of supply that was held by LTHs, and at a loss, reached above 34%. Meanwhile, the proportion held by STHs declined to just 3% to 4% of supply. At the moment, STHs still hold 16.2% of the supply in loss, suggesting that freshly redistributed coins must now go through the process of maturation in the hands of higher conviction holders.

This indicates that whilst many bottom formation signals are in place, the market still requires an element of duration and time pain to establish a resilient bottom. Bitcoin investors are not out of the woods yet.

Live Chart

The Recovery of Demand, Both Big and Small

A common component of previous bear market cycles is the expulsion of Bitcoin tourists. An observation made was the stand-out balance growth by Shrimps and Whales. Following on from this, we introduce a new indicator which seeks to track the relative on-chain activity of both small and large entities (originally coined by CryptoVizArt).

Considering the historical transactional data for Bitcoin, the mean value of daily transfer volume has typically been larger than the median value. This is largely the result of there being a larger quantity of small value transactions and a smaller quantity of large value transactions.

We can see this in the consistent disparity between the Mean 🔴 and Median 🔵 transaction USD size throughout Bitcoin history. Therefore, the Bitcoin on-chain transaction value distribution displays positive skewness.

Skewness is the degree of asymmetry observed in a distribution. Positive skewness occurs when the Mean is greater than the Median. This indicates that there are a greater number of small value transactions than large ones.
Live Workbench

We can use this observation to develop a macro framework to assess the comparative level of activity, and demand from small, and large size entities. The oscillators below are constructed by taking the ratio between the 7DMA and the 365DMA of the median (small entities 🔵), and mean (large entities 🔴) USD-transaction volumes.

  • When Small Entities 🔵 exceed Large Entities 🔴, it typically suggests an influx of small size transactions and is often associated with the excitement of bull markets and greater speculation.
  • When the indicators are increasing, it can be considered to be a signal of higher demand from that entity cohort.
  • When the indicators are decreasing, it can be considered to be a signal of lower demand from that entity cohort.

What can be seen in the current market cycle is that the red curve has consistently traded above the blue curve. This indicates that the activity of large entities (likely institutions) has been dramatically higher than retail, both through the bull cycle and more recently during the capitulation events.

Furthermore, we can see that smaller entities remain quite active relative to past bears, but we have not yet seen a bottoming and recovery reversal yet. This is a characteristic to keep an eye on to watch for expanding demand from both entity cohorts. The key takeaway from this metric is that whilst activity is in bottom formation territory, like the conclusion above, it has not yet reverted into recovery mode just yet.

Live Workbench

Miner Capitulation

Finally, we will turn attention to the miner cohort, who often tend to become an influential source of selling pressure during late-stage bear markets. This is a result of the cyclical nature of their income, and current bear market has been no exception to this trend.

To track whether a Miner Capitulation is in play, we can consult a two-part model, which seeks confluence between implied income stress (Puell Multiple) and observed hashrate decline (Difficulty Ribbon Compression).

  • The Puell Multiple 🟠 tracks aggregate miner income in USD, relative to the 1-year average. Here, we can see that presently Bitcoin miners are earning just 49% as much as the 12-month average. This implies miner income stress is a likely factor.
  • The Difficulty Ribbon Compression 🟣 signals that hashrate is indeed coming offline, causing protocol difficulty to fall in a statistically significant way. This is an explicit observation that ASIC rigs are being switched off due to income stress.
  • Miner Capitulation Risk 🟡 highlights periods where both metrics signalled meaningful lows and generally correlated with extreme bear market lows and an elevated risk of miner capitulation events.
Live Workbench

With confirmation that miner capitulation risk is a factor, we can confirm that aggregate miner balances have experienced up to 4.47k BTC/month in distribution. This started primarily after the collapse of the LUNA-UST project.

The income stress on these miners has resulted in a total distribution of 7.9k BTC from their treasuries over a two month period. That said, miners have slowed their spending of late and are currently distributing from their stored treasuries at a rate of 1.35k BTC/month.

The duration of miner capitulation in the 2018-2019 bear market was around 4-months, with the current cycle only having started in 1-month ago. Miners currently hold approximately 66.9k BTC in aggregate in their treasuries, and thus the next quarter is likely to remain at risk of further distribution unless coin prices recover meaningfully.

Live Workbench

Conclusion

The present market structure has many hallmarks of the later stage of a bear market, where the highest conviction cohorts, the long-term holders and the miners, are under remarkable pressure to surrender.

The volume of supply at a loss has now reached 44.7%, of which a majority is carried by the Long-Term Holder cohort. However, this remains at a less severe level compared to previous bear cycles. We also introduced a new indicator that tracks the activity level of small and large entities, as a tool to map market recovery. This supports the observation that the market is well into the bear, however has not yet formed a confident bottom, and still has work to do.

Overall, the fingerprint of a widespread capitulation, and extreme financial stress is certainly in place. However, there may still be a combination of both time pain (duration), and perhaps further downside risk to fully test investor resolve, and enable the market to establish a resilient bottom.


Product Updates

All product updates, improvements and manual updates to metrics and data are recorded in our changelog for your reference.

Disclaimer: This report does not provide any investment advice. All data is provided for information purposes only. No investment decision shall be based on the information provided here and you are solely responsible for your own investment decisions.