Beginnings of a Bear Market Rally?

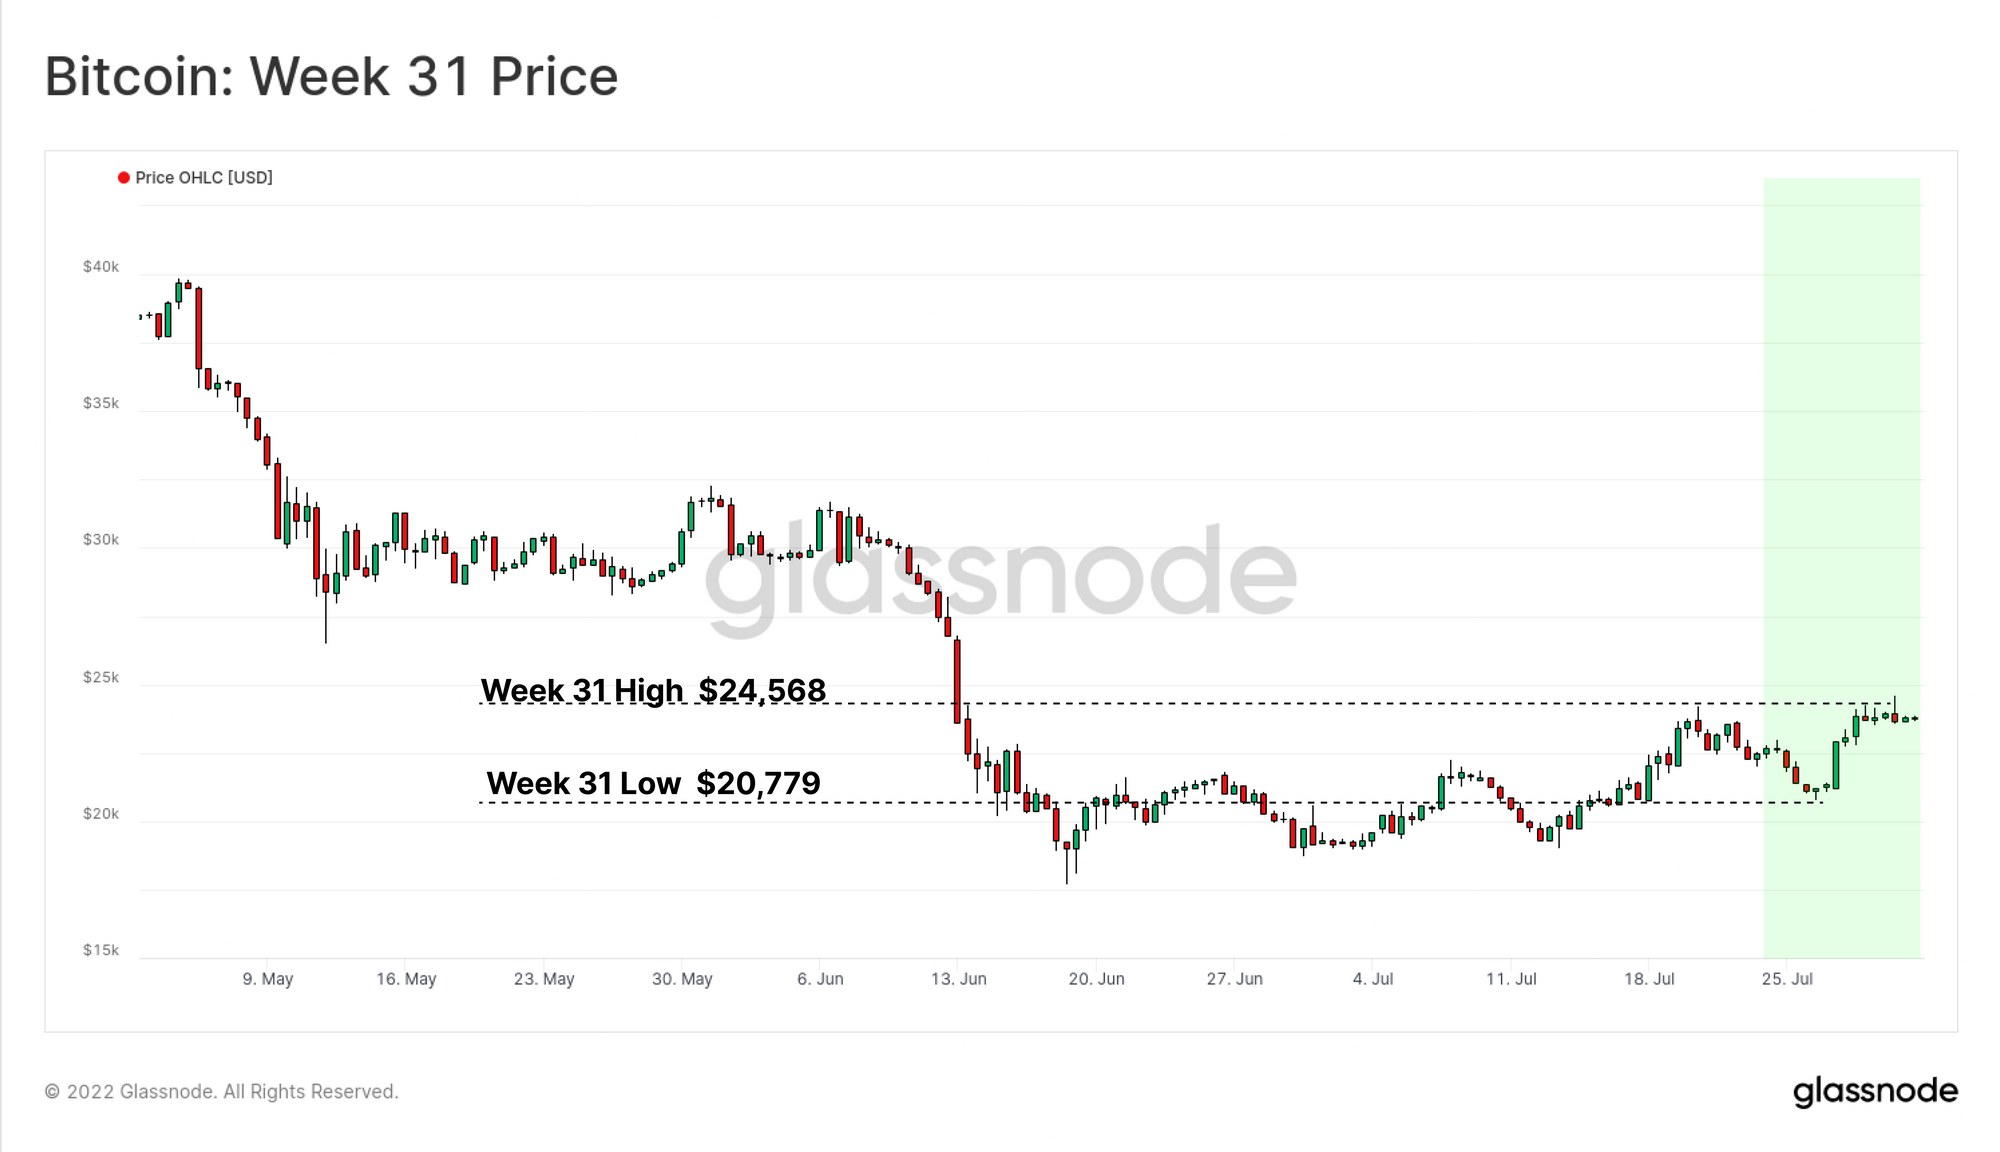
Both BTC and ETH have rallied, coming off extremely oversold conditions, and spurred on by risk-on sentiment following the July FOMC meeting. Attention now turns to whether it is a bear market relief rally, or the start of a sustained bullish impulse.

Beginnings of a Bear Market Rally?

The Bitcoin and digital asset markets responded strongly to the Federal Reserve 75 basis point rate hike this week, with BTC closing up 5.7%, and ETH up 7.6% on the week. Broader markets responded positively to the FOMC announcement as Chairman Powell indicated that the current target Fed Funds rate at 2.25% to 2.5% was now considered neutral, and eyes were on developing data on economic slow-down.

In many regards, recent positive price action for Bitcoin and Ethereum gives much awaited relief to the bulls, who have weathered almost nine months of persistent downtrend. The 2022 bear market has been historically negative for the digital asset space. However, after such a sustained period of risk-off sentiment, attention turns to whether it is a bear market relief rally, or the start of a sustained bullish impulse.

In this edition, we will explore this concept utilising on-chain activity as a baseline, and whether the market is signalling an influx of new demand, or if it lacks sustained follow through.


🔔 Alert Ideas are presented throughout to help identify key metric levels of interest that may signify significant shifts in market/network performance. Any Glassnode member can set an alert directly from Glassnode Studio.

Translations

This Week On-chain is now being translated into Spanish, Italian, Chinese, Japanese, Turkish, French, Portuguese, Farsi, Polish, Russian, Arabic and Greek.

The Week Onchain Dashboard

The Week Onchain Newsletter has a live dashboard with all featured charts available here. This dashboard and all covered metrics are explored further in our Video Report, which is released on Tuesdays each week. Visit and subscribe to our Youtube Channel, and visit our Video Portal for more video content and metric tutorials.


Bitcoin Activity Grinds Sideways

Generally speaking, an influx of new demand into blockchain networks is supported and signalled by sustained upticks in usage on-chain. We can use both on-chain activity, and supply dynamics to assess performance relative to recent comparable history as a guide.

  • Bullish Impulses tend to be described by rising and elevated on-chain activity as more users enter the network. Generally this is supported by increasing volumes of supply changing hands at a profit as older investors sell, and new demand absorbs these coins.
  • Bearish Impulses tend to see declining on-chain activity, often in a violent and rapid flush out. Bear markets then take time to recover as supply rotates from speculators, back to long-term and high conviction holders.

Bitcoin active addresses remain firmly within a well defined downtrend channel 🔴. Note also how the Oct-Nov ATH 🔵 reached significantly lower peak than the April 2021 ATH, suggesting a major washout of users had occurred, and demand did not follow-through.

With exception of a few activity spikes higher during major capitulation events, the current network activity suggests that there remains little influx of new demand as yet.


🔔 Alert Idea: Active Addresses (14 SMA) breaking above 950k would signal an uptick in on-chain activity, suggesting potential market strength and demand recovery.
Live Advanced Chart

The demand for on-chain transactions and blockspace tells a similar story. The market structure of the last year is quite similar to the 2018-19 period (shown in 🔵).

After the initial wash-out in and demand destruction May 2021 🔴, transactional demand has traded sideways to slightly lower, indicative that only the stable base of higher conviction traders and investors remain.


🔔 Alert Idea: Transaction Rate (14 SMA) breaking above 3.0 would signal an uptick in on-chain activity, suggesting potential market strength and demand recovery.
Live Advanced Chart

As a result of lacklustre transaction demand, on-chain transaction fees are firmly within bear market territory 🔵, seeing only 13.4 BTC in total fees paid per day. Similar to active addresses, and transaction demand, the demand destruction 🔴 is visible in May 2021, as network congestion collapsed, and fees started forming a bear market baseline.

Bull markets typically maintain elevated fee rates 🟢, and often are one of the first signals of demand recovery. Whilst we have not seen a notable uptick in fees yet, keeping an eye on this metric is likely to be a signal of recovery.


🔔 Alert Idea: Transaction Fees (14 SMA) breaking above 35 BTC/day would signal an uptick in on-chain activity, suggesting potential market strength and demand recovery.
Live Advanced Chart

We can confirm these observations by looking at the average data footprint (in bytes) of Bitcoin blocks:

  • Network congestion and full blocks 🔴 will result in larger block sizes as miners fill blocks as tightly as possible to earn maximum fee revenue.
  • Low network congestion and partially empty blocks 🔵 will result in smaller blocks as there are insufficient transactions for miners to fill all capacity.

Note that SegWit is a technological upgrade to Bitcoin that acts to increase the maximum data capacity of Bitcoin blocks. Prior to June 2021, SegWit adoption was below 55%, meaning the maximum block capacity was smaller than it is now. However, given SegWit adoption has now reached in excess of 72%, there is more effective blockspace capacity, yet current congestion is even lower than it was in May 2021.

This indicates that overall, the Bitcoin network remains HODLer dominated, and as yet, there has not been any noteworthy return of new demand, as viewed through the lens of on-chain activity.

Live Advanced Chart

On a more positive note however, the capacity in Bitcoin Lightning Network (LN) public channels continues to print new all-time-highs. Total LN public capacity has now reached 4,405 BTC, which is an increase of 19% over the last two months, despite the prevailing bear market.

This metric measures the liquidity available for users to send value routed through nodes that have public channels, and is a good gauge for expanding network effects. It does not account for private channels setup between two counter-parties whom have not opened up their node for public routing.

Live Advanced Chart

New Glassnode x CoinMarketCap Report

We are pleased to release a new report in collaboration with CoinMarketCap exploring just how challenging the 2022 bear market has been for Bitcoin, and Ethereum investors. We analyse the structural shifts happening in asset dominance, stablecoins, investor profitability, and whether signals of bear market bottom formation are in play.

Read our latest report and see the content in a live dashboard.

Read the Report

A Short Burst of Ethereum Activity

The Ethereum network has experienced many of the same trends as Bitcoin over the last 12-months, seeing a gradual deterioration of aggregate network usage and congestion. Despite powerful price action over the last few weeks, Ethereum network congestion is in fact the lowest it has been in some time, manifesting as multi-year lows in gas prices paid for confirmation.

Ethereum transaction demand has been in a gradual decline since the May 2021 sell-off, seeing only a short burst of activity in recent weeks. If this trend can continue higher, it may be constructive, and is one to keep an eye on.


🔔 Alert Idea: Transaction Count (14 SMA) breaking above 1.25M would signal an uptick in on-chain activity, suggesting potential market strength and demand recovery.
Live Advanced Chart

Ethereum tends to have a larger pool of transactions in the mempool compared to Bitcoin, and consistently sees blockspace filled to 99%+ capacity. As a result, the gas price paid is often a superior method for tracking true congestion.

This acts to capture the urgency of users seeking transaction confirmation, as measured by the value they are willing to spend on fees.

The chart below shows:

  • 🟢 Average Gas Limit which is the maximum gas that miners can fit in a block (currently 15M, but can expand to 30M under EIP1559).
  • 🔴 Average Gas consumption per block which is the actual usage profile relative to the Gas Limit.
  • 🔵 Median Gas Fee in Gwei which can be seen to expand in periods of demand, and contract during quiet periods of low congestion.
Live Advanced Workbench

Ethereum gas prices have recently declined to just 17.5 Gwei on a 7-day median basis. This is the lowest network congestion and gas price since May 2020, which was prior to DeFi Summer, and before the initiation of the bull market.

This signals that despite recent positive price action, there has not been an influx of new usage, and overall, the Ethereum is at a multi-year low in relative activity.


🔔 Alert Idea: Median Gas Price (7 SMA) breaking above 30 Gwei would signal an uptick in on-chain activity, suggesting potential market strength and demand recovery.
Live Advanced Chart

As a result, the ETH burn rate via EIP1559 is now at an all time low. Total ETH burned is now just 11% of the total issuance. Ethereum has only crossed into deflationary territory on three occasions in the past under the current issuance schedule.

This effectively means a relatively large volume of ETH is making it into circulation in comparison to all post-EIP1559 history.

Live Advanced Workbench

Absorbing Profits

To close this piece, we will assess the market structure of Bitcoin and Ethereum through the lens of the SOPR metric. SOPR captures the average profit (> 1.0) or loss (< 1.0) realized by the market on spent coins. Generally speaking:

  • 🟢 High values (> 1.0) indicate larger magnitude profits are being realized, and the market has sufficient demand flowing in to absorb it.
  • 🔼 Bull Market Support is characterised by SOPR values of 1.0 acting as support, as investors buy at their cost basis during pull-backs.
  • 🔴 Low Values (< 1.0) indicate larger magnitude losses are being realized and investors are selling coins below their cost basis on average.
  • 🔽 Bear Market Resistance are characterised by SOPR values of 1.0 acting as resistance, as investors sell at their cost basis during rallies.

For Bitcoin, SOPR is attempting to break above 1.0 for the second time since early June. Usually, the market requires a number of attempts before escape velocity can be reached. An ideal bullish scenario would be a break above 1.0, and then a retest, finding support.


🔔 Alert Idea: BTC SOPR (7 SMA) breaking above 1.0 and holding that level would signal profitability is returning, and a possible market recovery.
Live Advanced Chart

Ethereum has had more luck, piercing above a SOPR value of 1.0, and finding its first retest as support. However, given the somewhat lacklustre on-chain activity metrics explored above, it is prudent to watch for a reversal back below 1.0, which could signal weakness. This would resemble previous bearish periods where a brief excursion above 1.0 can be observed, before rejecting back into net loss territory.


🔔 Alert Idea: SOPR (7 SMA) breaking below 1.0 and would signal a decline in profitability, and indicate potential market weakness.
Live Advanced Chart

Summary and Conclusions

Both Bitcoin and Ethereum have seen a rebound in prices this week, coming off the back of extremely oversold conditions, and spurred on by risk-on sentiment following the July FOMC meeting.

However, under the surface, on-chain transactional demand remains lacklustre at best, and this rally has not yet seen a convincing follow through in observable demand activity. The net result is that Bitcoin blocks are partially empty, Etheruem gas prices are at multi-year lows, and the rate of EIP1559 burning is at all-time-lows.

Of course, on-chain activity is only part of the picture, and early signs of SOPR profitability returning are encouraging. Attention can now shift to whether these uptrends can be sustained and improve, as a gauge for whether this is simple bear market relief, or a more constructive structural shift.


Product Updates

All product updates, improvements and manual updates to metrics and data are recorded in our changelog for your reference.

  • Released support for APE, SHIB, SAND and stETH ERC20 tokens
  • New Metric Releases: Provably Lost and Probably Lost
  • Workbench performance improvements: Significantly improved speed of min/max functions, sma function and hline function
  • Improved labels for Gemini ETH balance.

Disclaimer: This report does not provide any investment advice. All data is provided for information purposes only. No investment decision shall be based on the information provided here and you are solely responsible for your own investment decisions.