Facing Mt. Gox Distribution
After more than a decade of legal process, the long awaited creditor distribution of the Bitcoin recovered from the Mt.Gox exchange collapse is underway. From a psychological perspective, this represents the final chapter in what has been a major market overhang over the industry since 2013.


Executive Summary
- After an exacerbated legal process, Mt.Gox Creditors are at last receiving the Bitcoin recovered from the infamous exchange hack. As of current, 59k of the recovered 142k BTC has been distributed to creditors via the Kraken and Bitstamp exchanges.
- The proportion of wealth held by new investors is declining, and is well below the levels typically witnessed at macro market tops. This highlights a general shift in investor behaviour back towards HODLing.
- The distribution pressure by the LTH cohort remains relatively light, and is in decline. Alongside this, Long-term investors currently hold 45% of the network wealth, which is relatively elevated compared to levels seen near macro cycle topping events.
Mt.Gox Distribution Arrives
After over a decade of legal process, the long-awaited creditor distribution of Bitcoin recovered from the Mt.Gox exchange collapse is underway. This marks a historical event for the Bitcoin industry, and especially for the patient and resilient creditors who fought a long, hard battle to be reimbursed in BTC rather than fiat currency.
From a psychological perspective, this represents the final chapter in a major market overhang over the industry since 2013.
The total recovered coin volume was over 141,686 BTC, and just under 59k BTC has now been redistributed to creditors, with another 79.6k BTC soon to follow suit.
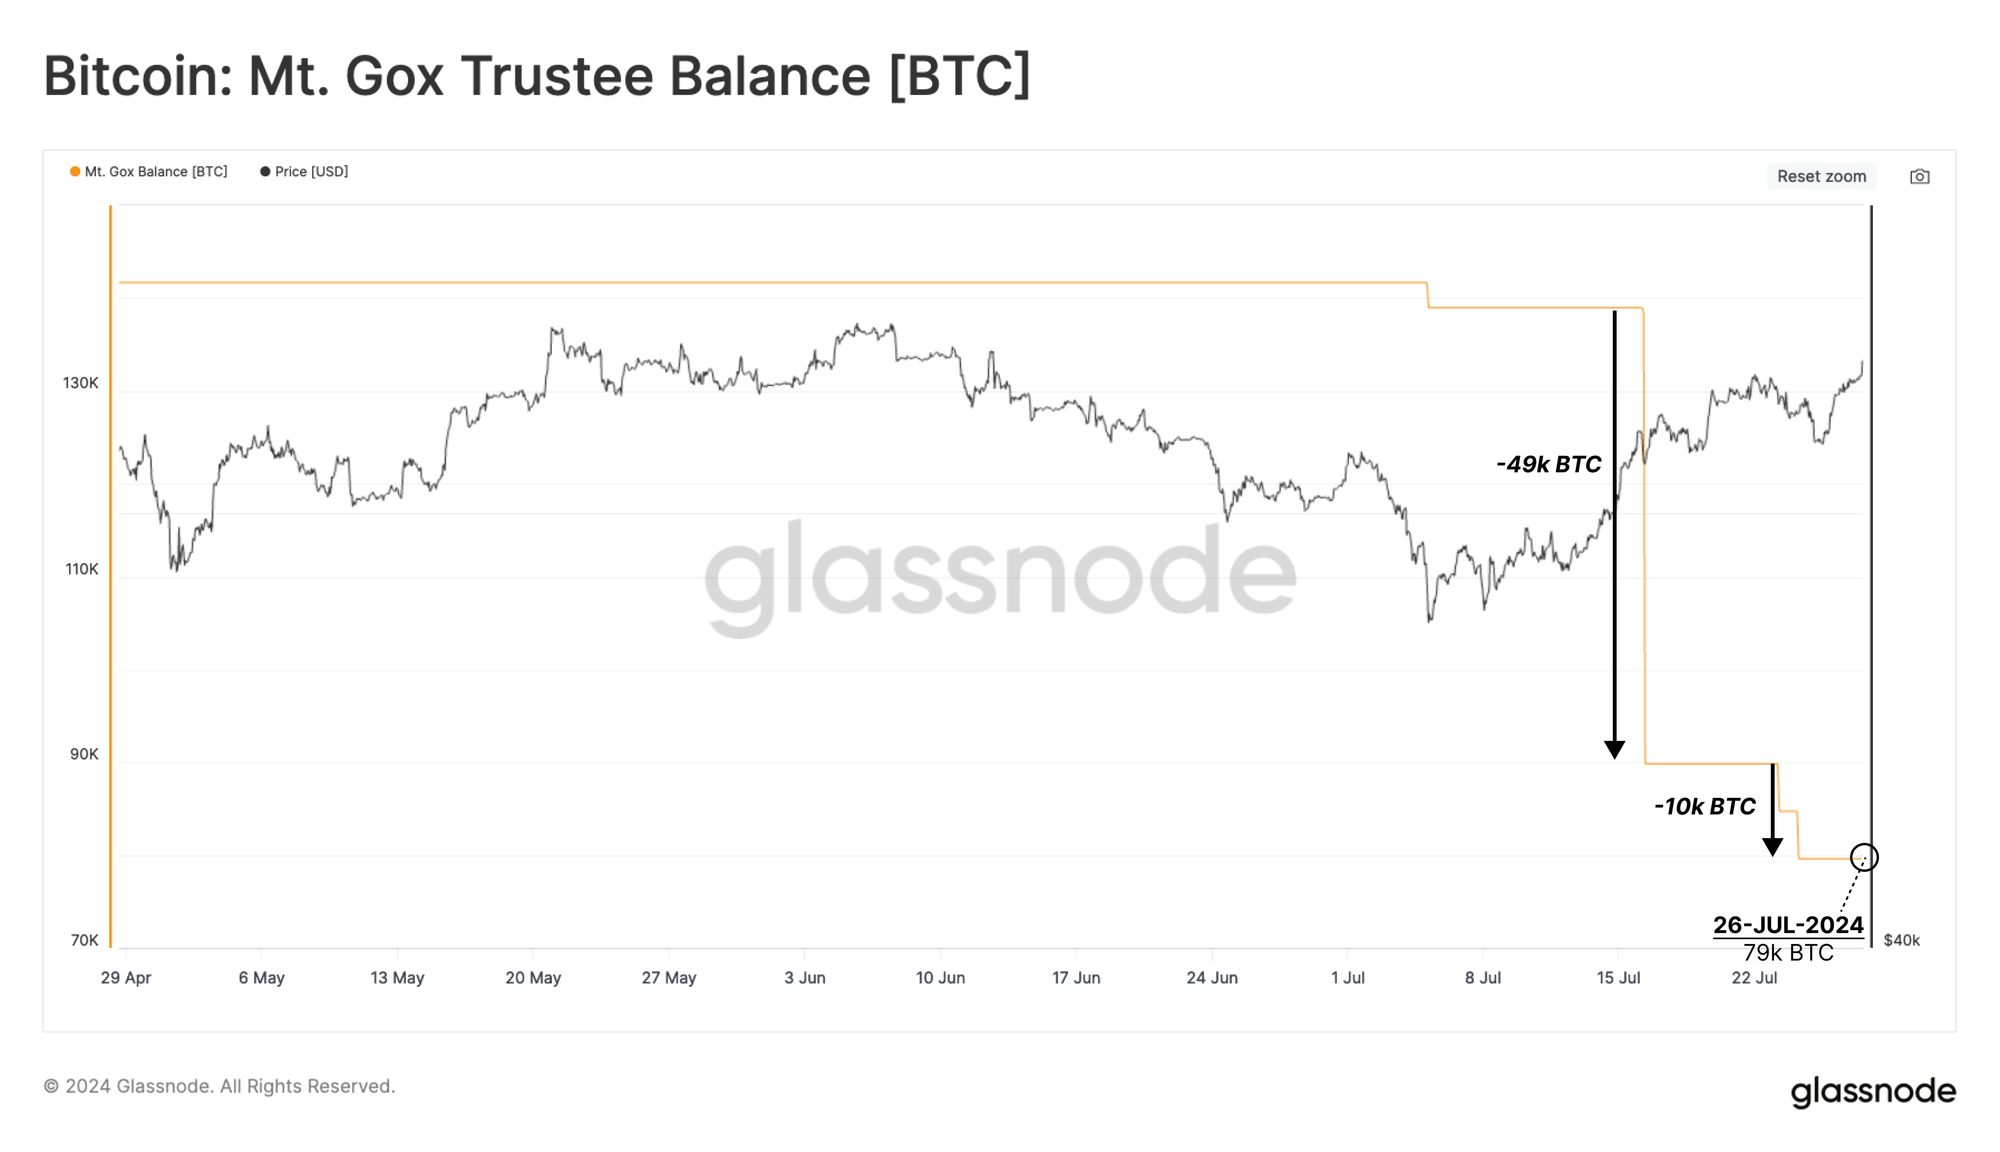
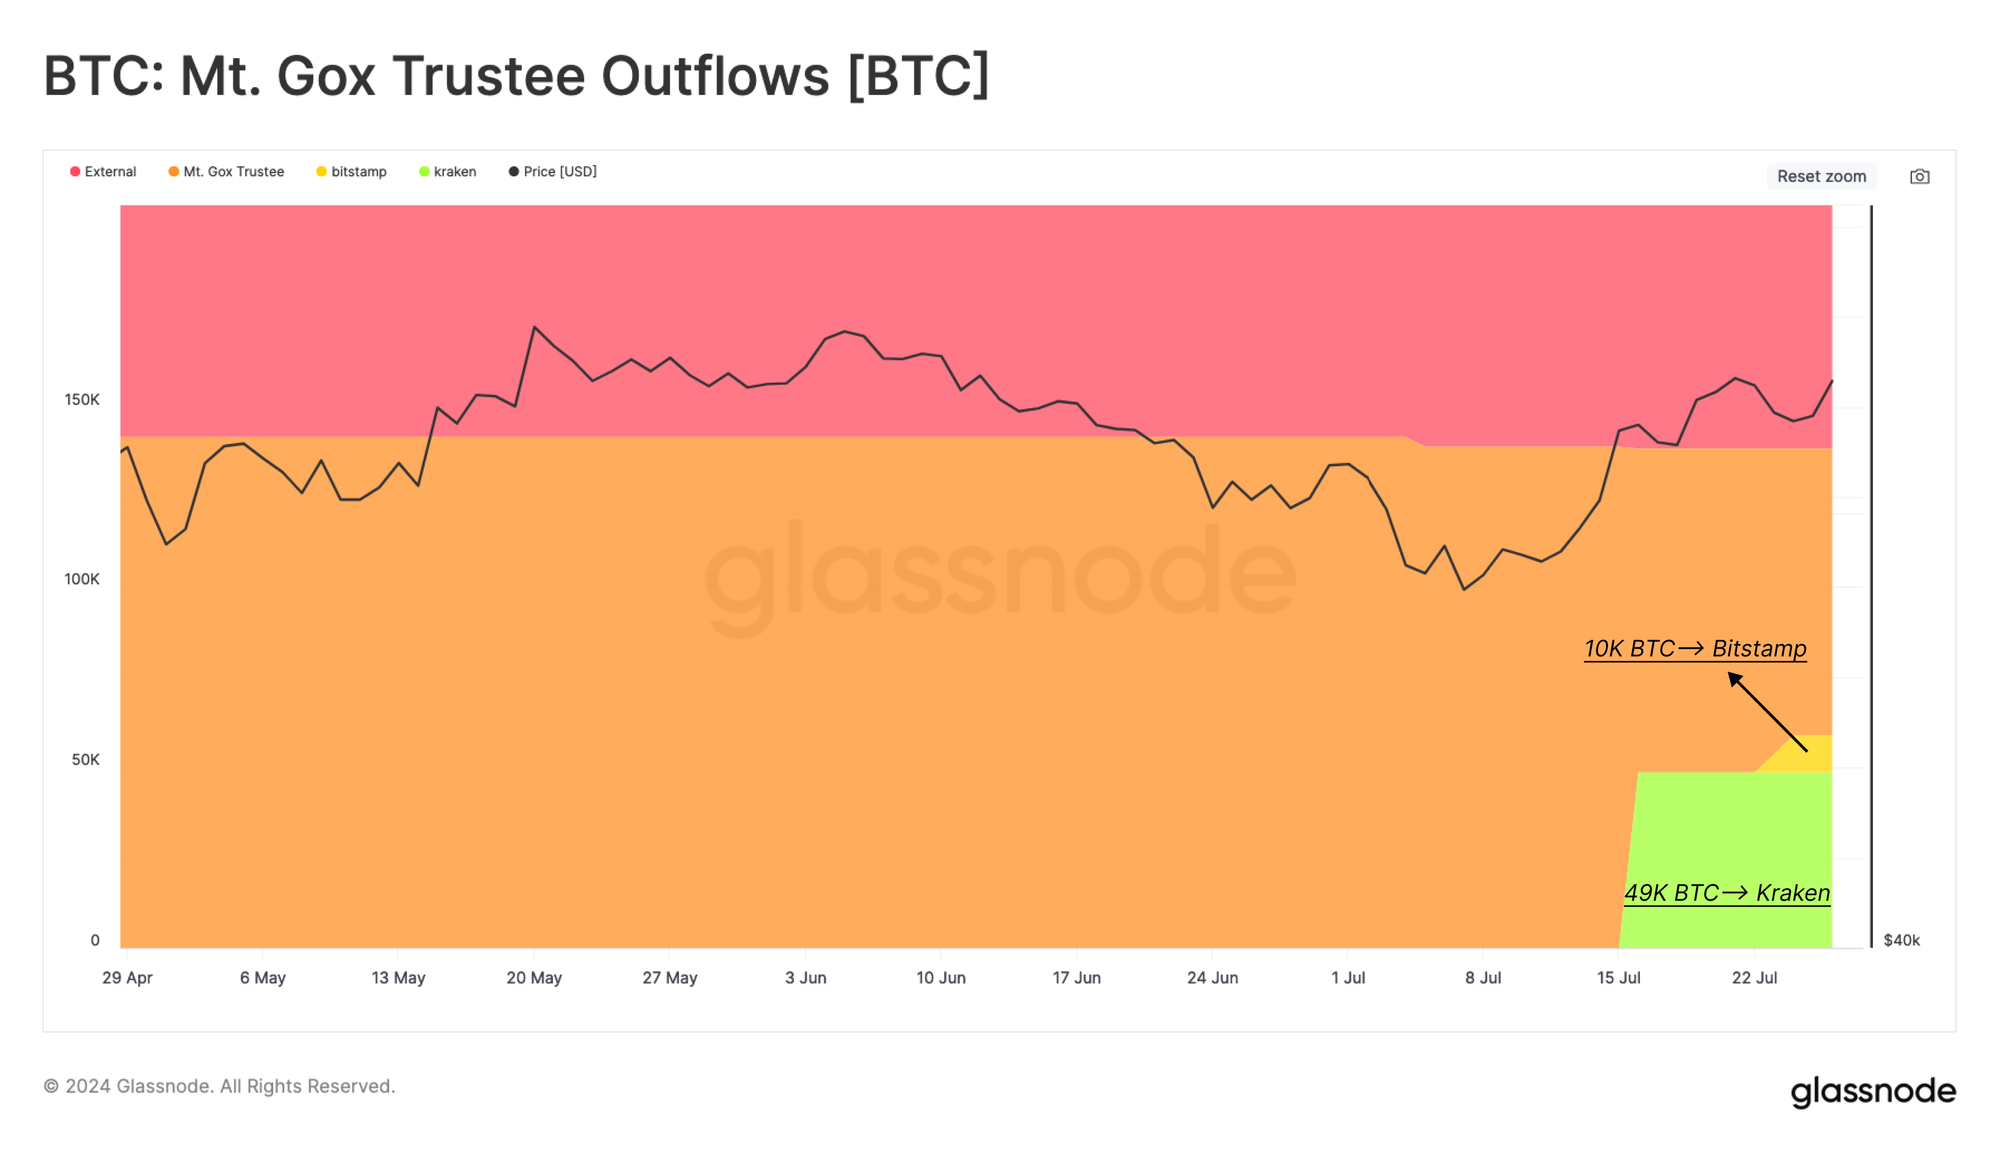
Kraken and Bitstamp have been selected as designated exchanges responsible for redistributing creditor funds. Kraken has now received 49k BTC, and Bitstamp has received the first tranche of 10k BTC.
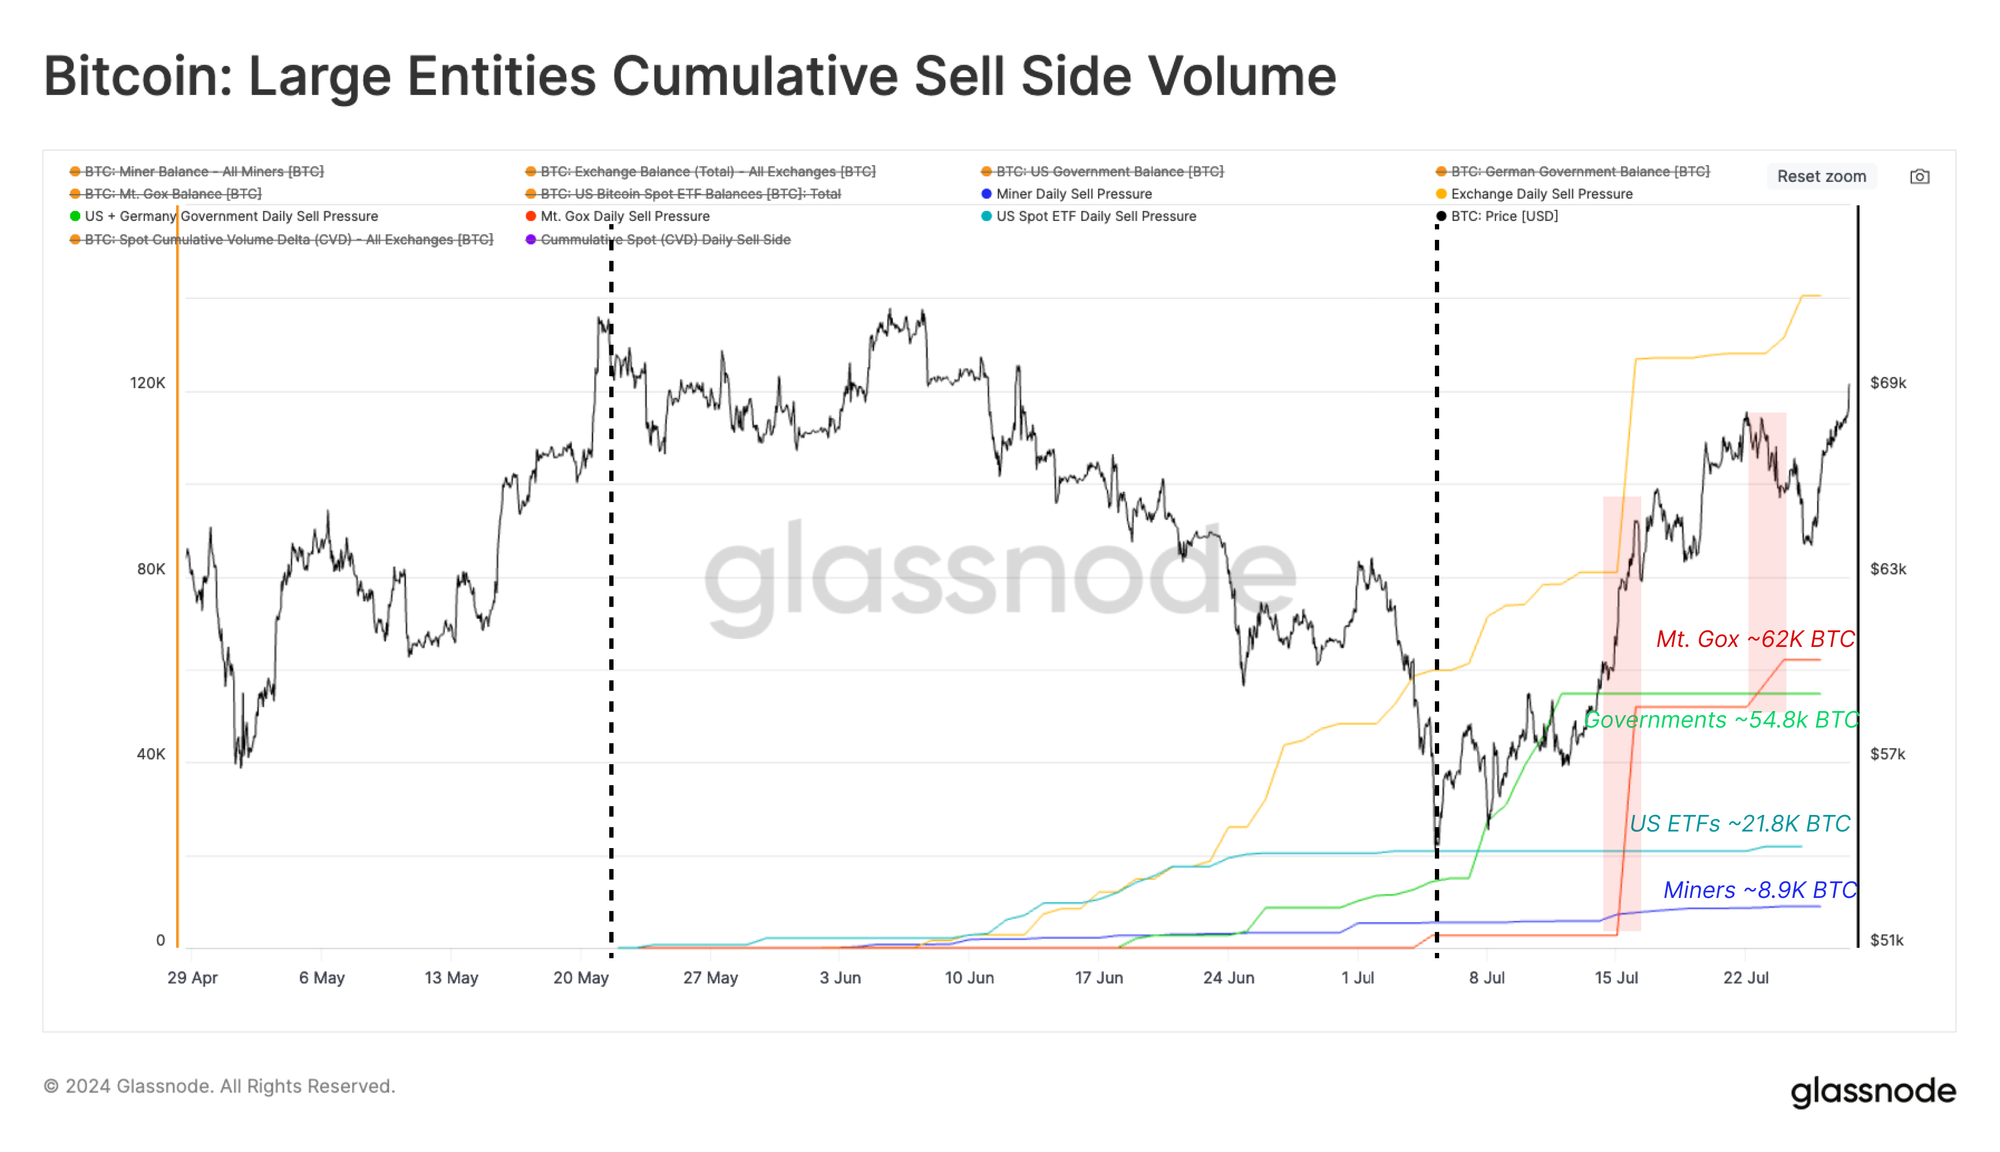
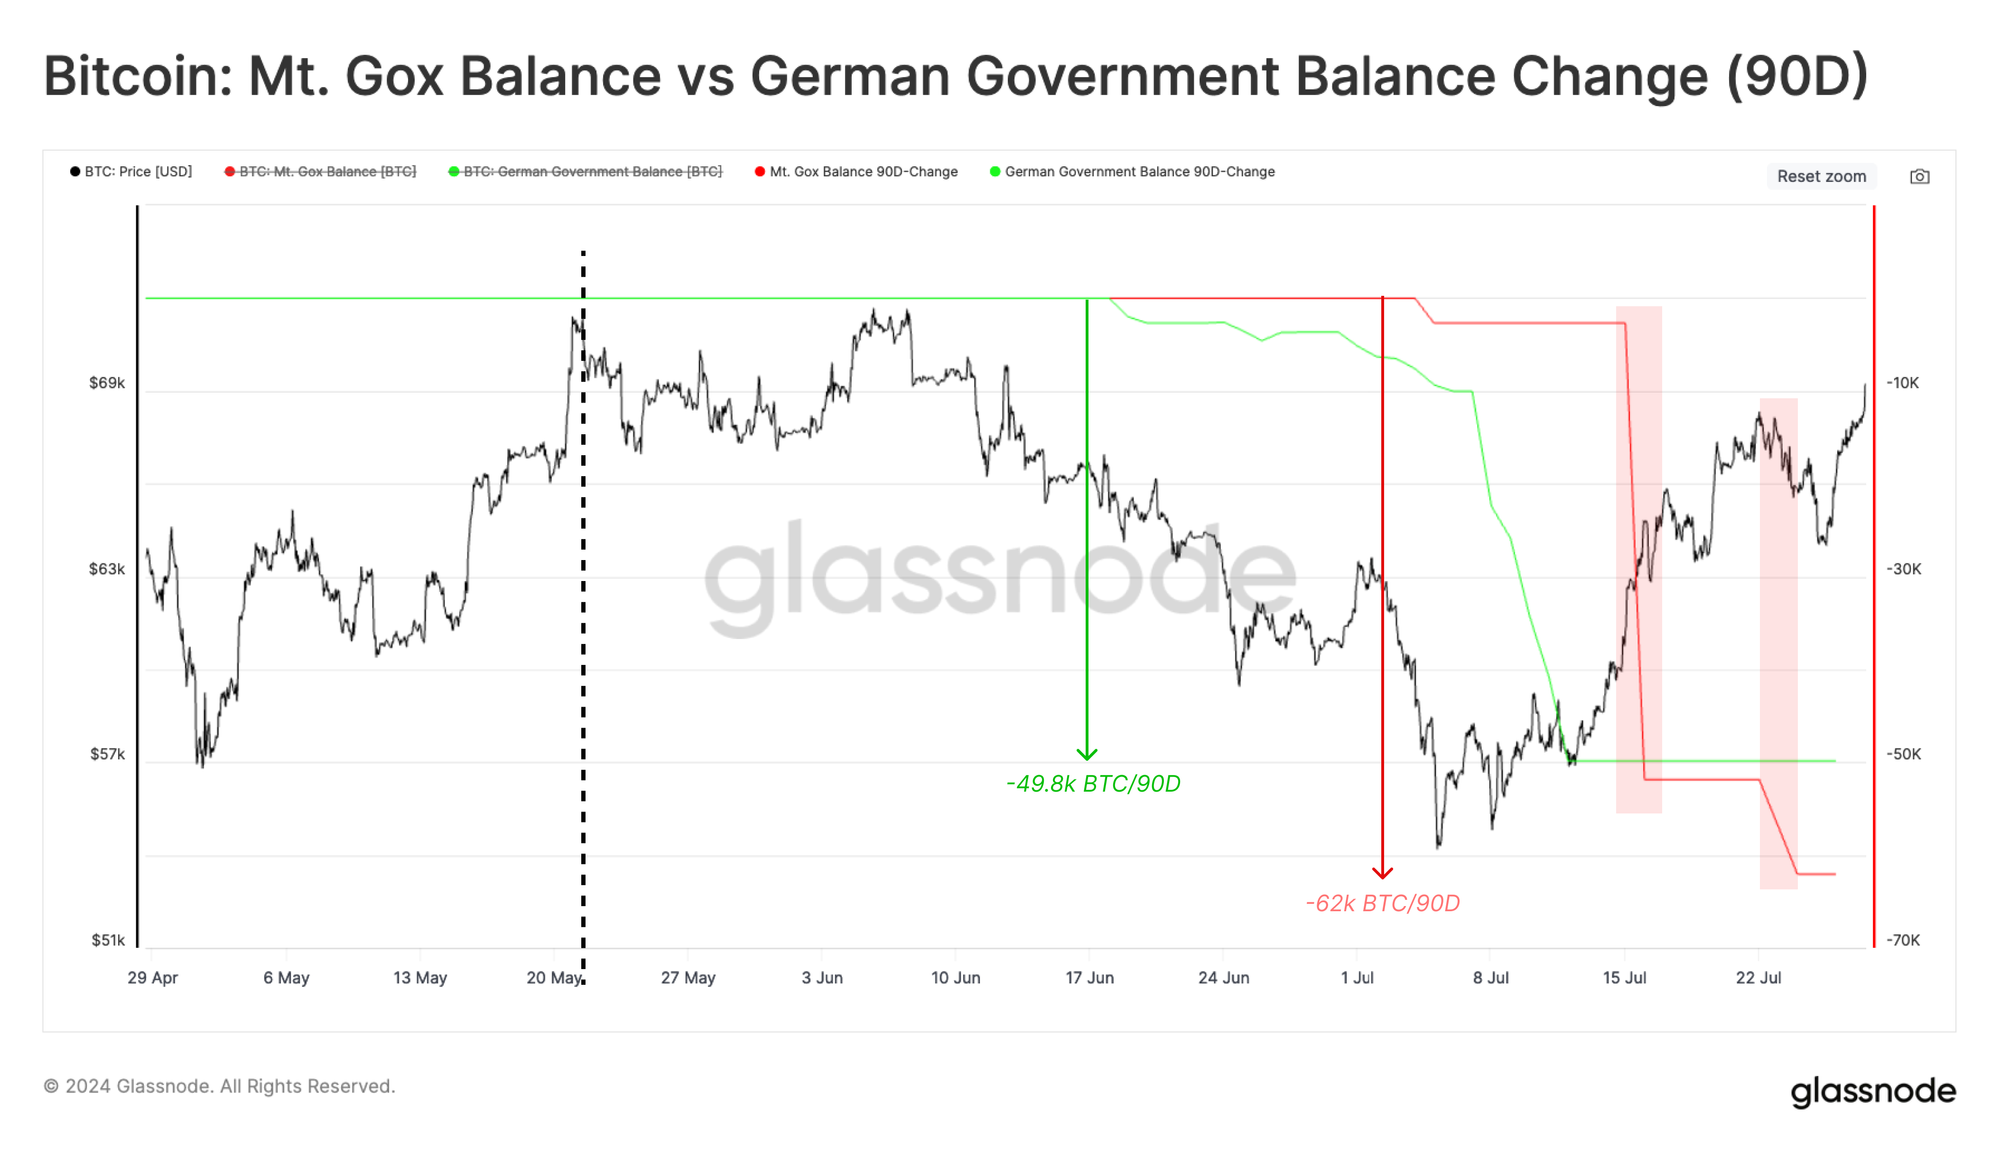
When comparing the size of distribution over the last 2 months, from the Mt.Gox estate to other large entities, we can see that these distributions are already larger in scale than the ETF inflows, issuance to miners, and sell-side by the German Government.
However, it is also worth noting the long history of creditors trying to recover their coins, as it can paint a picture of their likely behavior patterns moving forward:
- Creditors opted to receive BTC, rather than fiat, which was new in Japanese bankruptcy law.
- Several entities sought to acquire creditor claims throughout the decade-long legal process.
- Given the extensive time-span between Mt.Gox collapsing, and today, it is likely many creditors (who didn’t sell their claims) remain somewhat active in the Bitcoin space.
As such, it is relatively likely that only a subset of these distributed coins will be truly sold onto the market. However, this idea rests on a degree of speculation, and the reality is difficult to measure individually.
The degree of sell-side pressure by the German Government in late June was tremendous, with over 48k BTC sold over the span of 1-month. Nevertheless, the market absorbed this supply and managed to rally from $53k to over $68k soon after.
The Bitcoin price has continued to trade between $68k and $66k throughout the Mt.Gox distribution, which may allude to a lighter than expected sell-side (thesis above), and/or a relatively resilient demand profile.
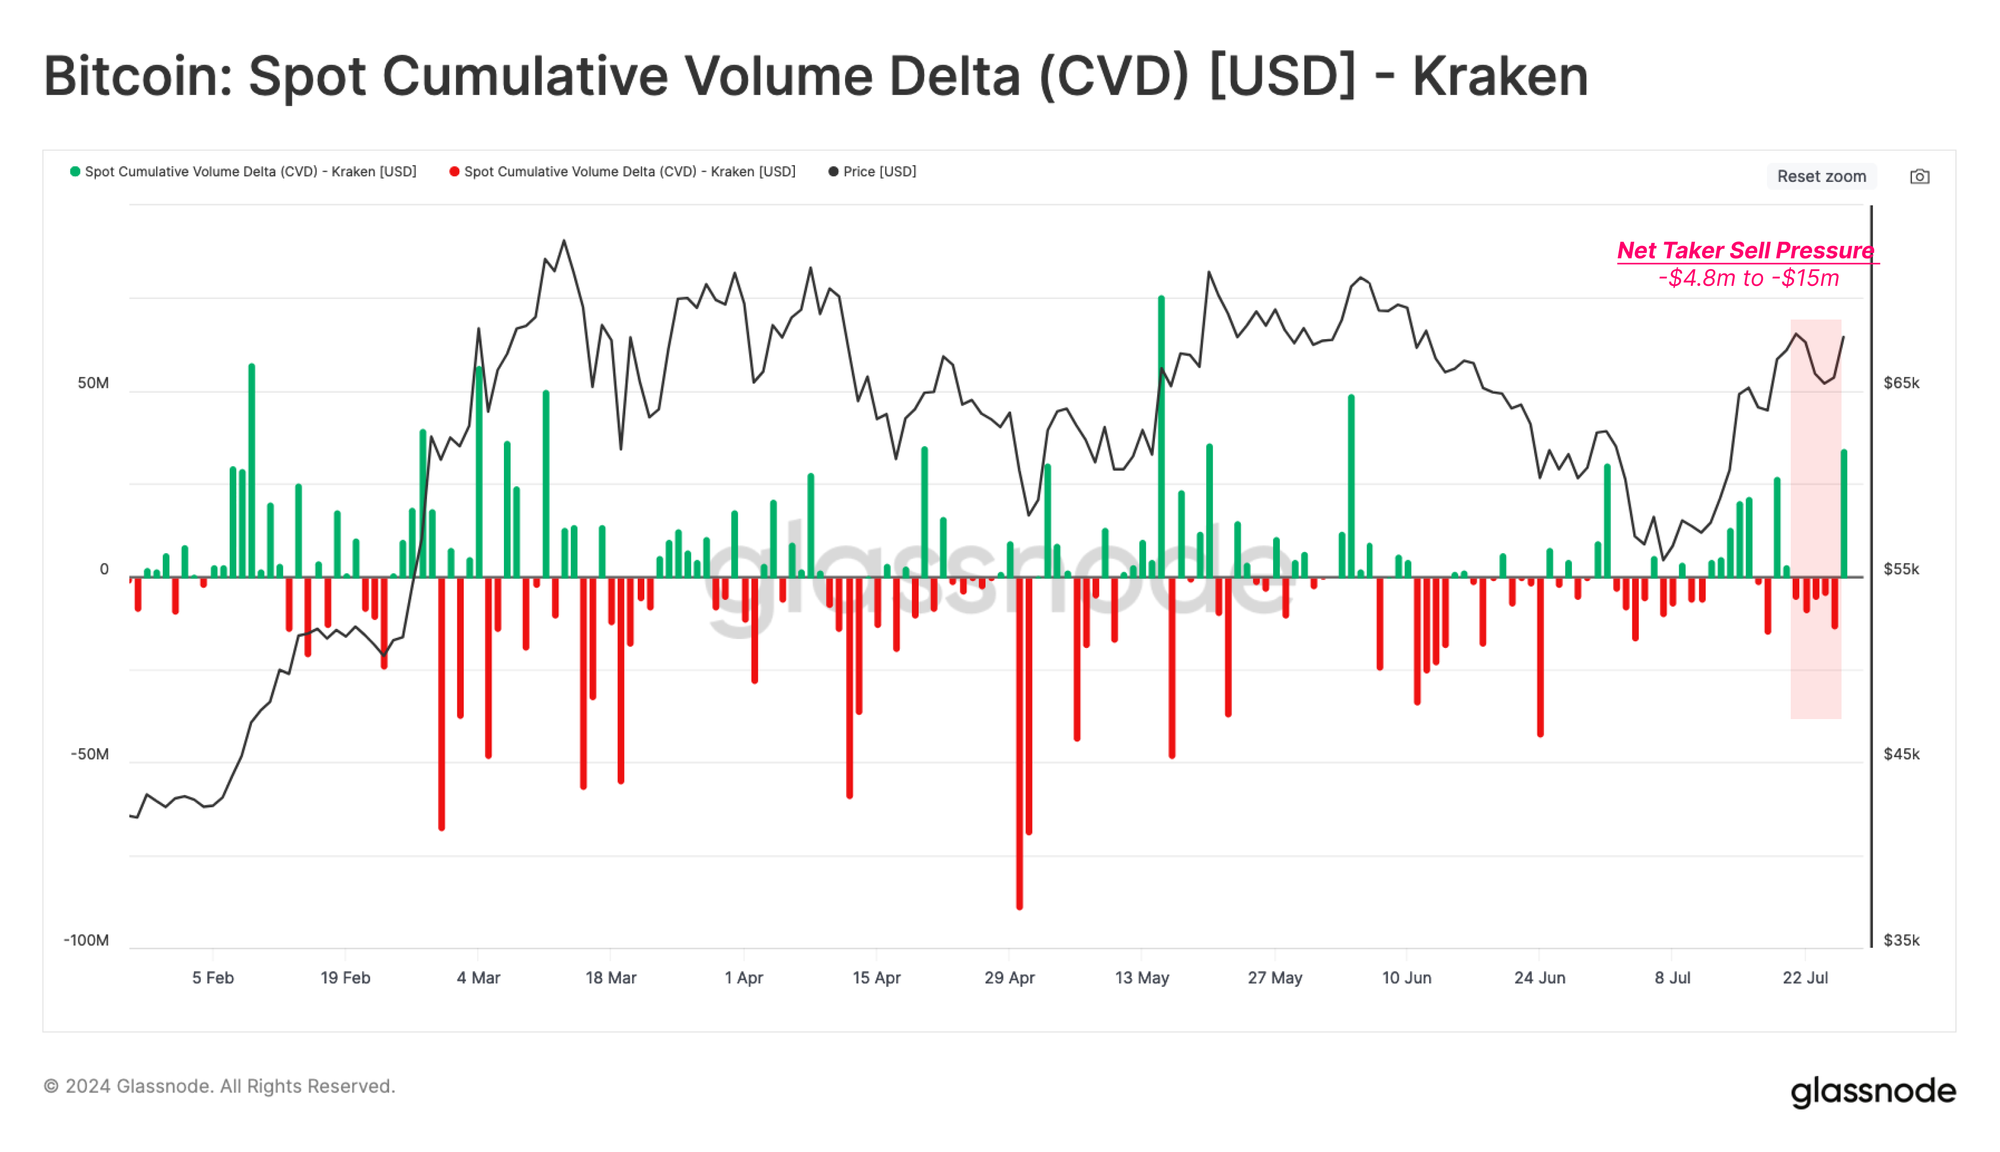
With the knowledge that both Kraken and Bitstamp are the destination exchanges for redistributed coins, we can utilize the spot cumulative volume delta (CVD) metric to add more colour to this idea.
CVD measures the net difference between spot buying and selling trade volumes on centralized exchanges (market orders only).
If we isolate the CVD metric related to Kraken, we can see a marginal uptick in sell-side pressure following the distribution. However, this remains well within typical day-to-day ranges.
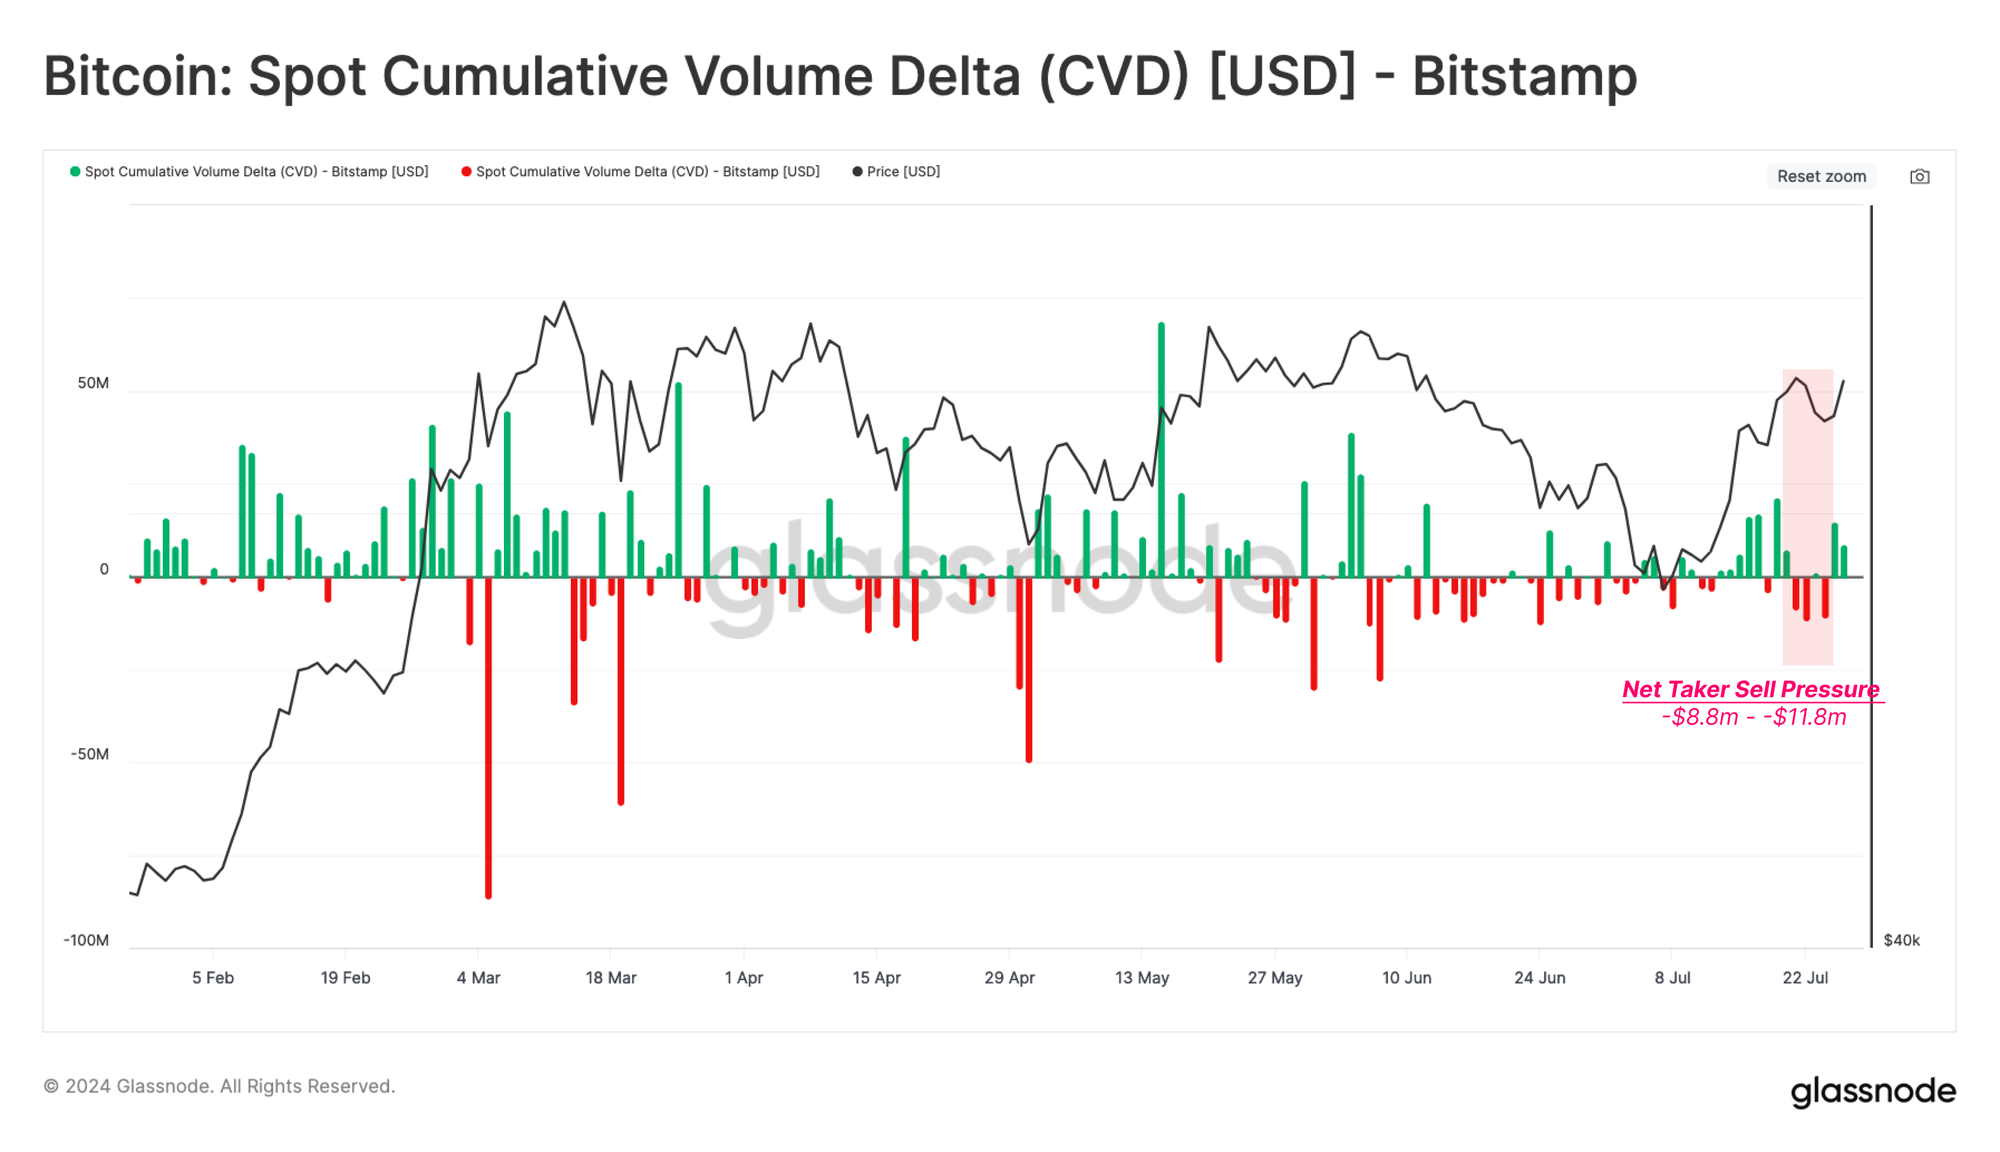
For Bitstamp, we can see a similar story, with only a marginal bias towards sell-side dominance.
This adds a bit more evidence to our thesis that creditors may be better thought of as having the mindset of long-term holders for the time being. If this thesis holds, it is a remarkable observation, as the incentive for creditors to take profits is very large due to the substantial price increase since 2013.
HODLing On
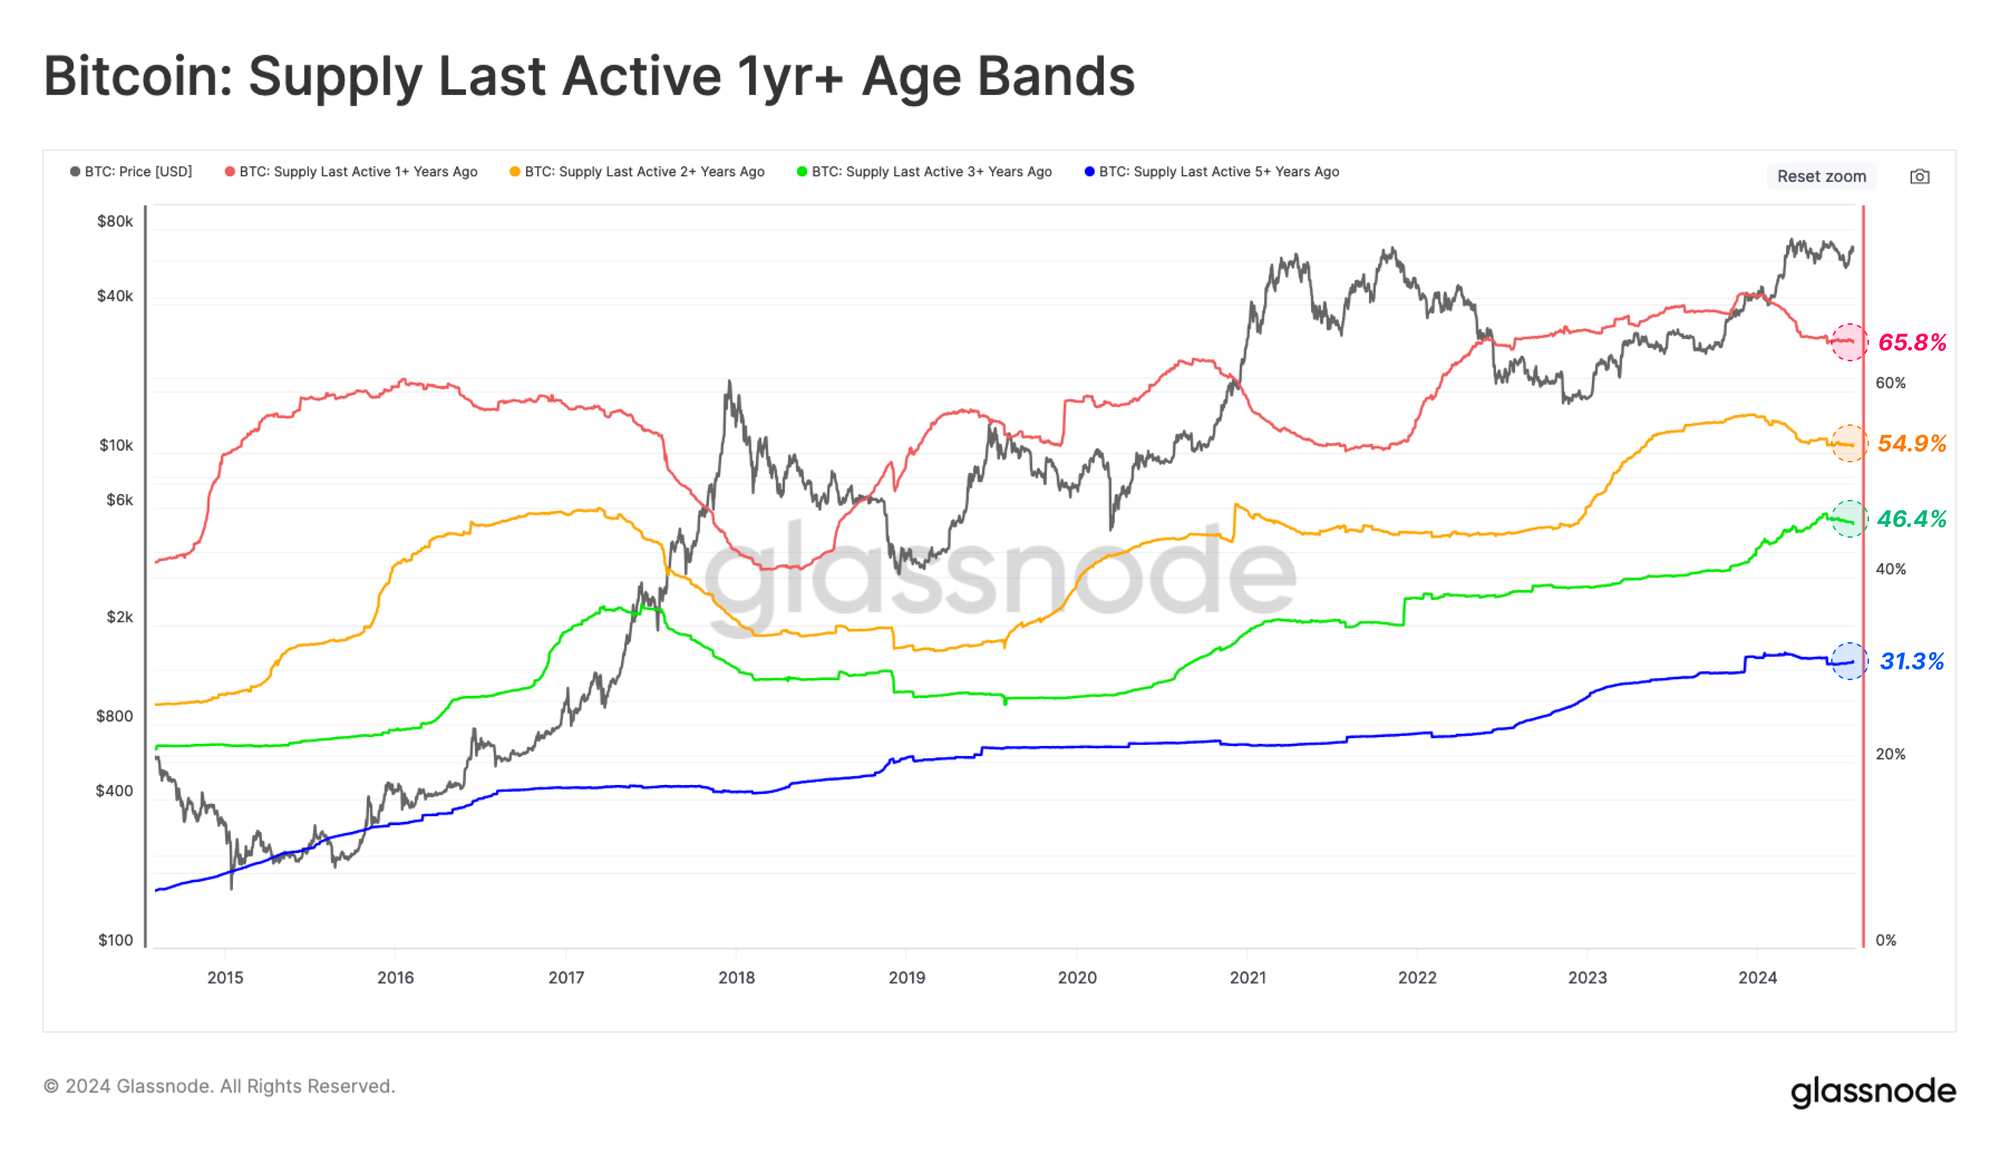
Bitcoin bull markets naturally attract sell-side pressure, as higher prices incentivize long-term holders to take profits on some of their holdings. We can observe this phenomenon through the significant decline in the Supply Last Active 1y+ and 2y+ metrics throughout March and April.
This describes long-term investors spending and selling coins to satisfy new demand in the run-up to the $73k ATH. The rate of decline across these curves has slowed of late, suggesting a gradual return to HODLing dominant investor behavior.
🔴 Supply Last Active 1y+: 65.8%
🟡 Supply Last Active 2y+: 54.9%
🟢 Supply Last Active 3y+: 46.4%
🔵 Supply Last Active 5y+: 31.3%
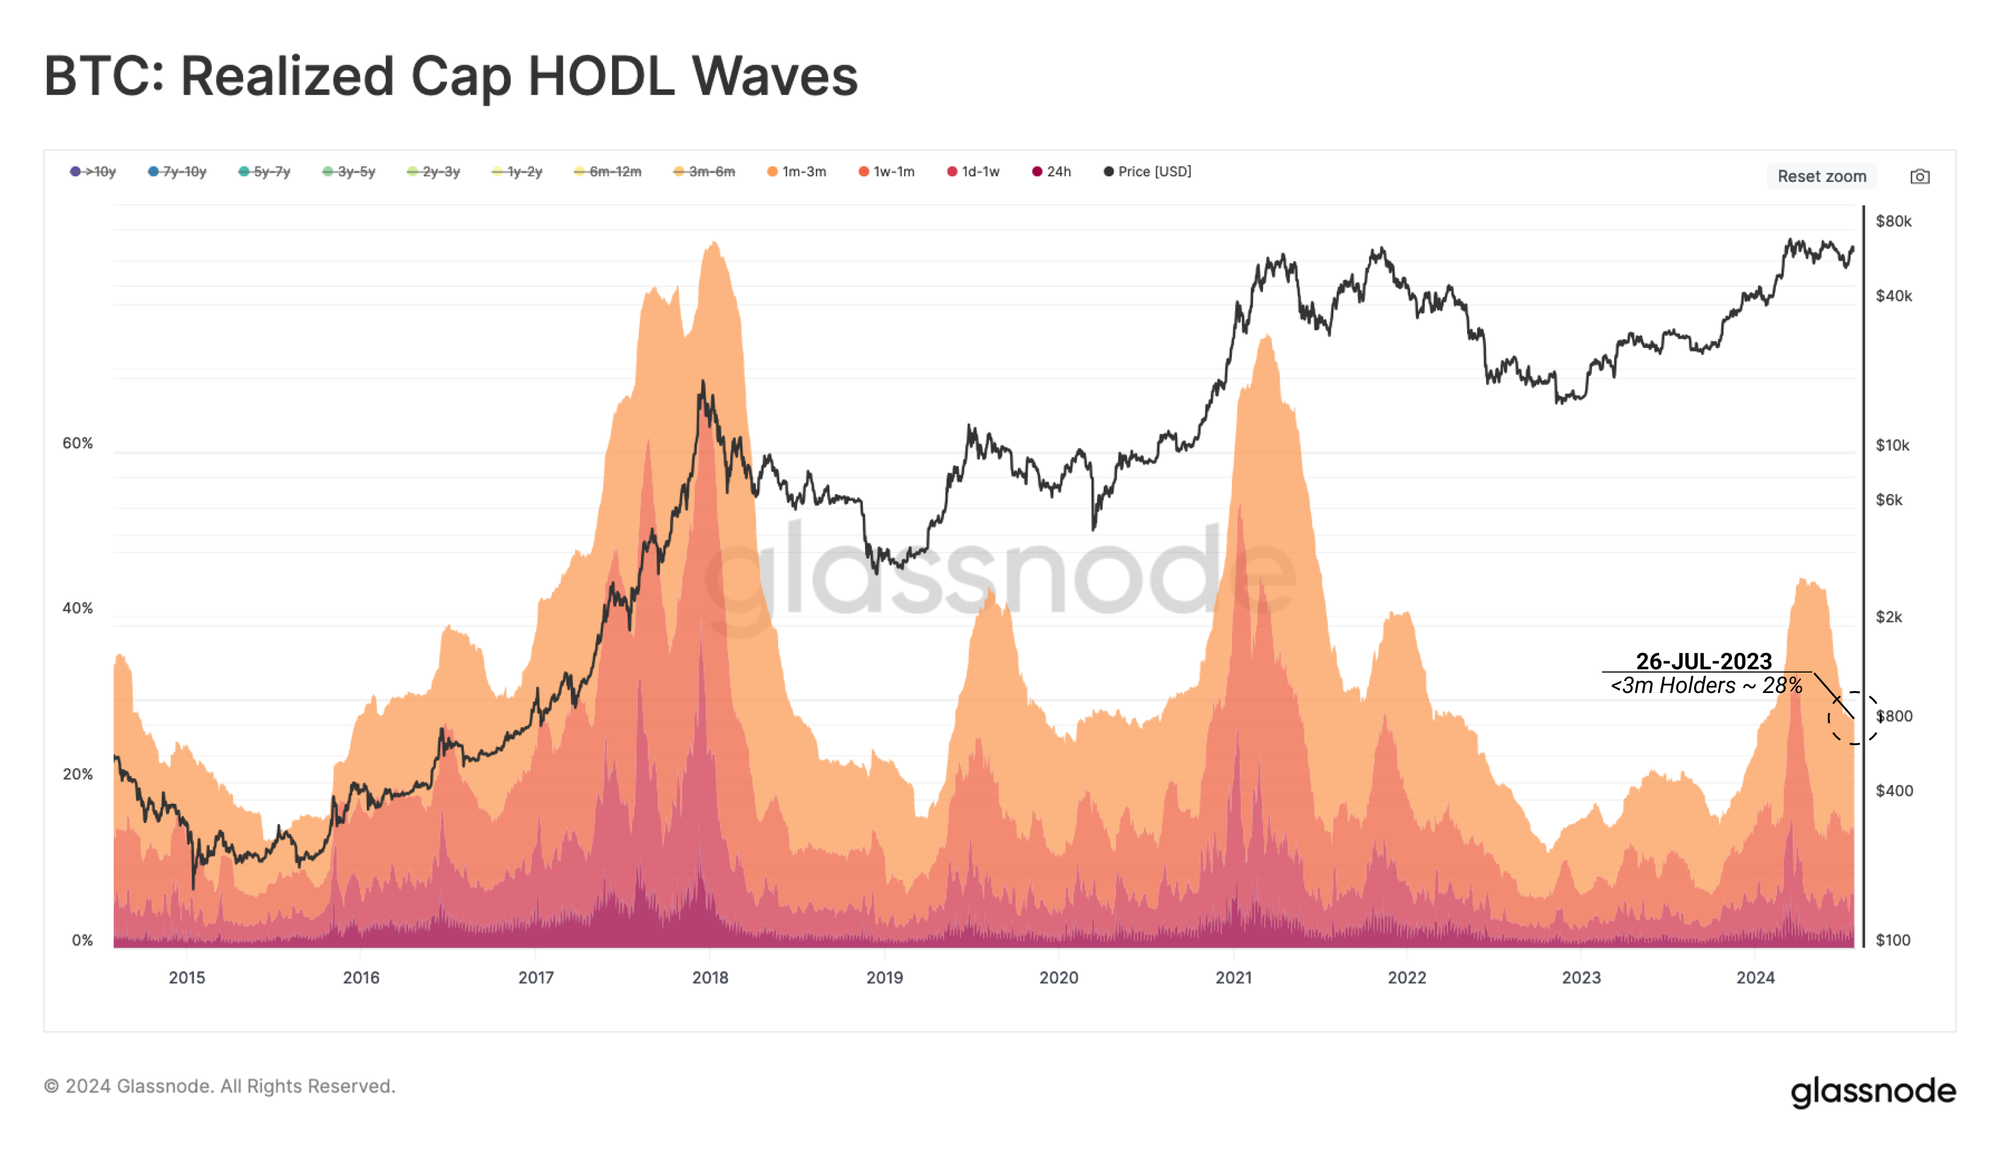
The Realized Cap HODL Wave metric helps us segregate the USD wealth locked in coins held for less than three months. This allows us to evaluate the waves of in-flowing demand by new investors
The culmination of a euphoric bull market is often marked by a saturation in wealth held by these new buyers, which also represents a point of large-scale divestment by long-term holders.
At the moment, the proportion of wealth held by new investors is declining and well below the levels typically witnessed at macro market tops. This highlights a general shift in investor behaviour back towards HODLing, but also a general slow-down in new demand since the $73k ATH.
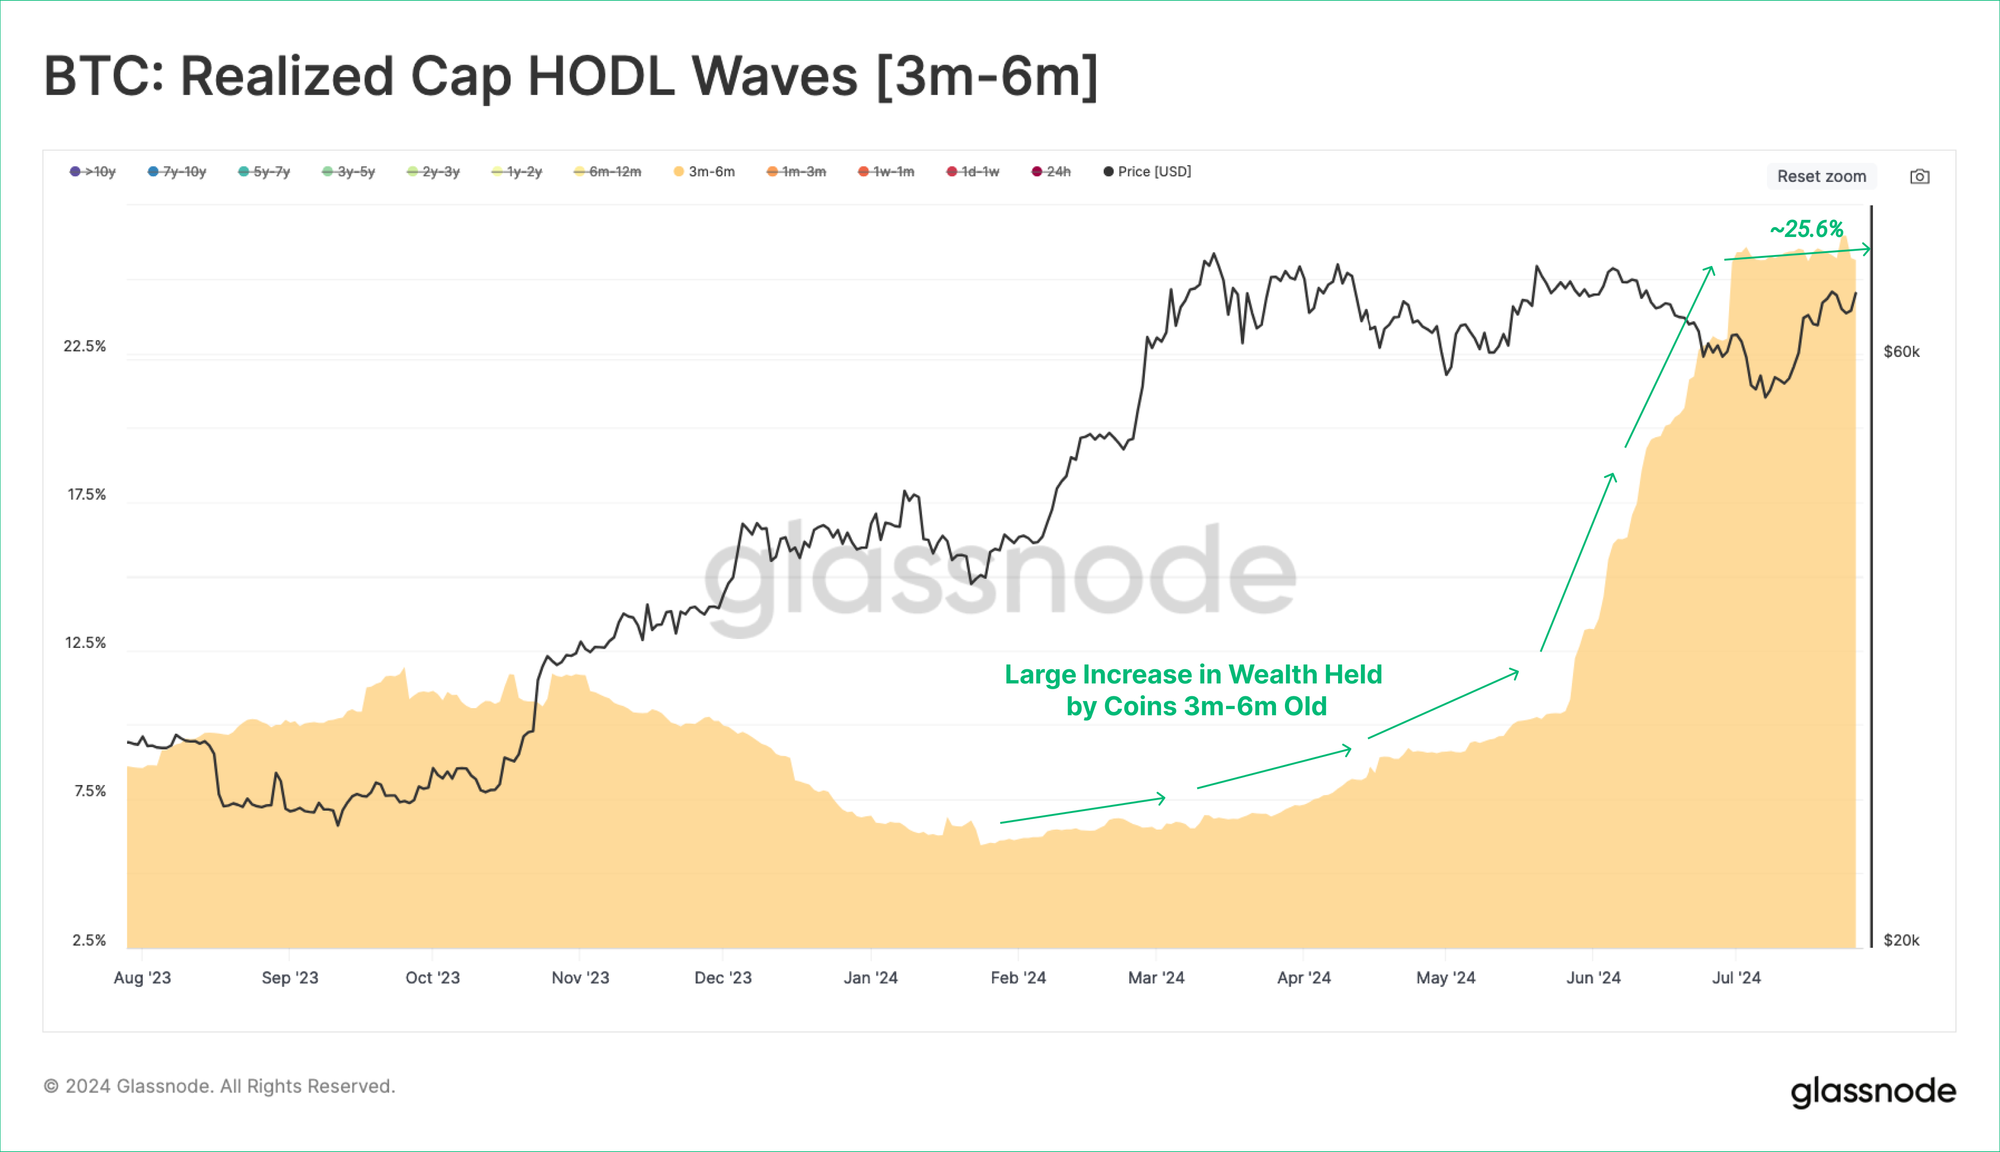
If we inspect the cohort who have held their coins for 3- and 6-months, we can see a significant growth in their relative network wealth. This again suggests a general trend of investors active earlier in the year holding their coins dormant and maturing into increasingly senior age bands.
From this, we deduce that HOLDing is likely the dominant mechanic within the Short-Term Holder cohort.
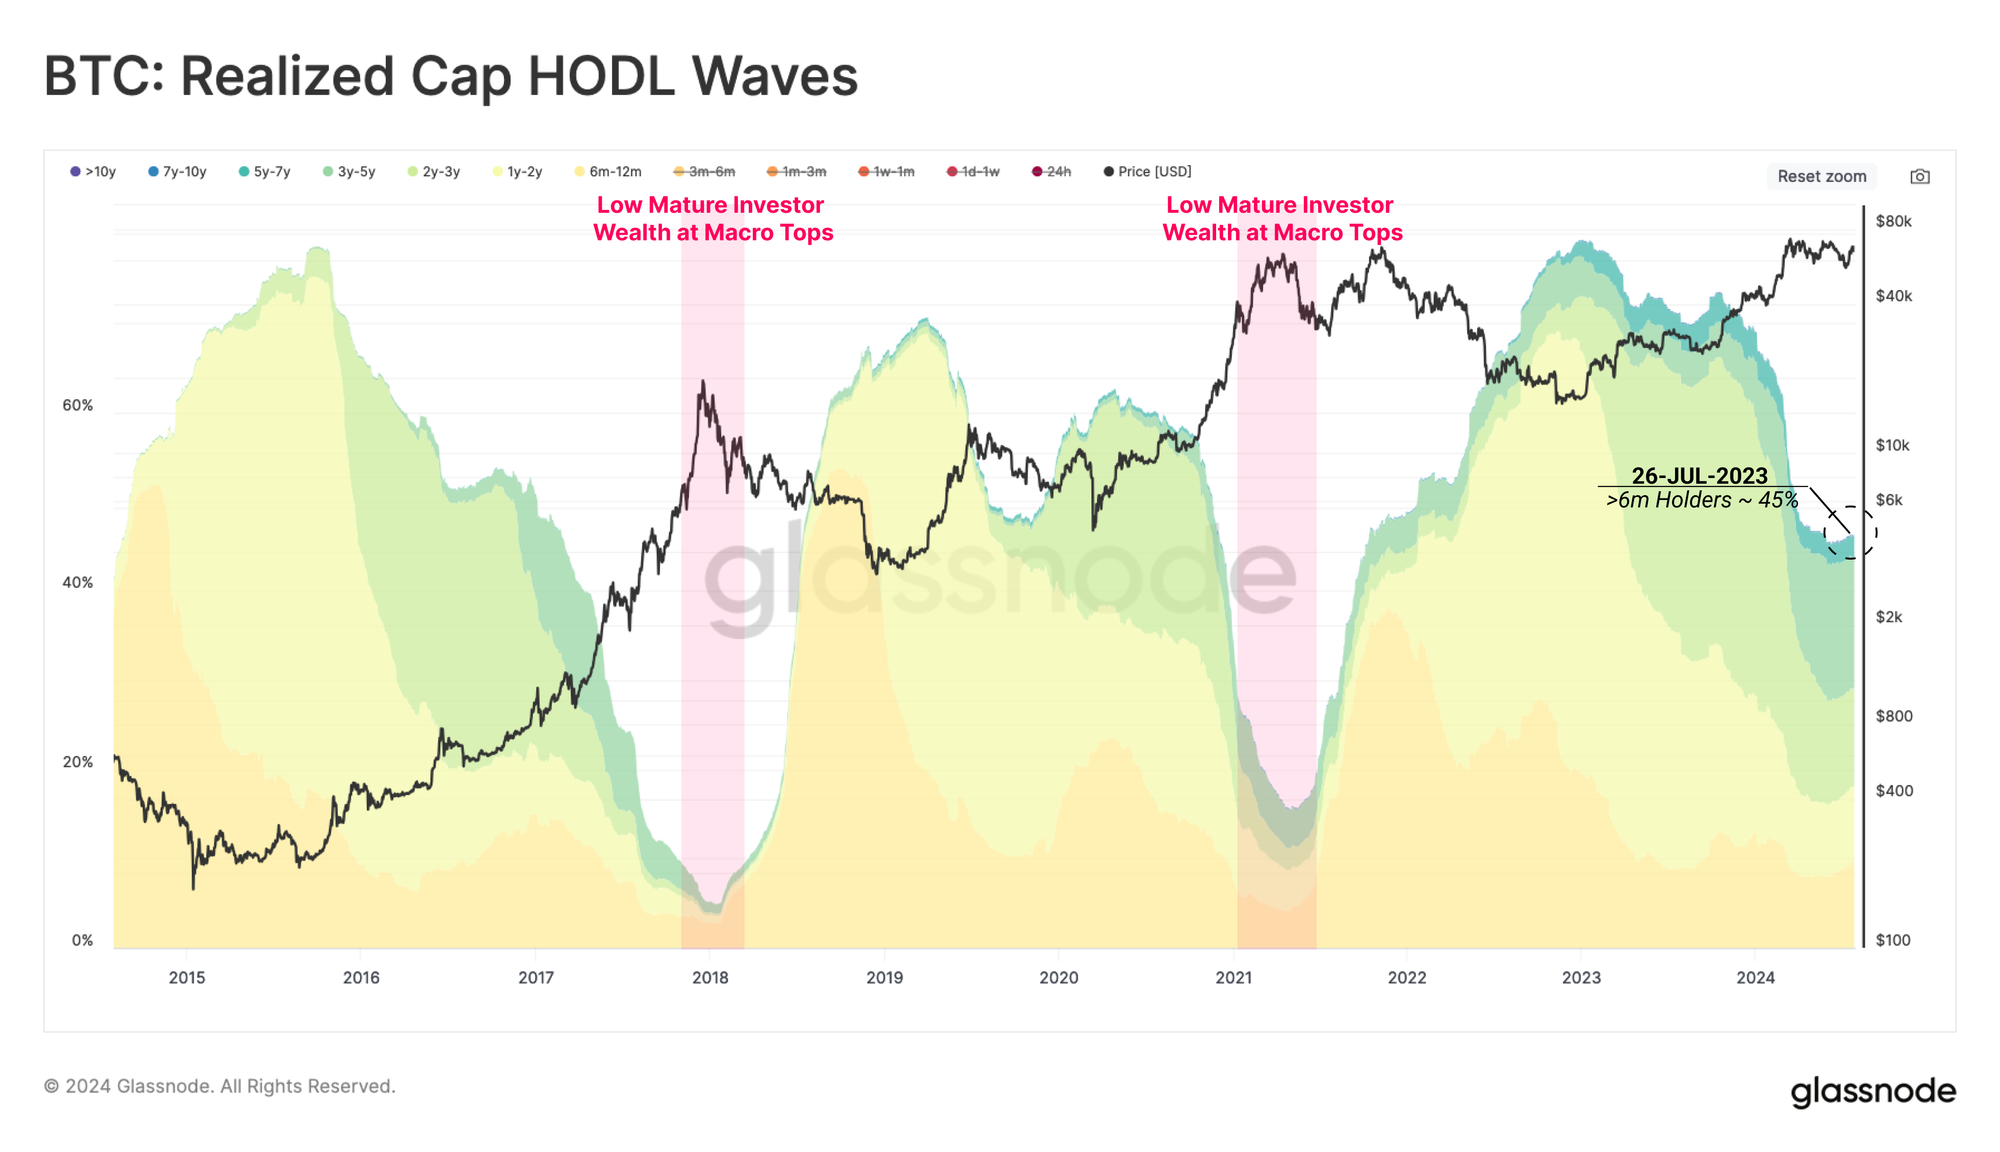
If we flip and look at the opposite side of the equation, the long-term holders, we can investigate the behaviour of investors who acquired supply more than 6-months ago.
Long-term investors currently hold 45% of the network wealth, which is relatively elevated compared to near macro cycle topping events. This underscores that long-term holders hold the coins in HODL mode and are arguably patiently waiting for higher prices to divest into market strength.
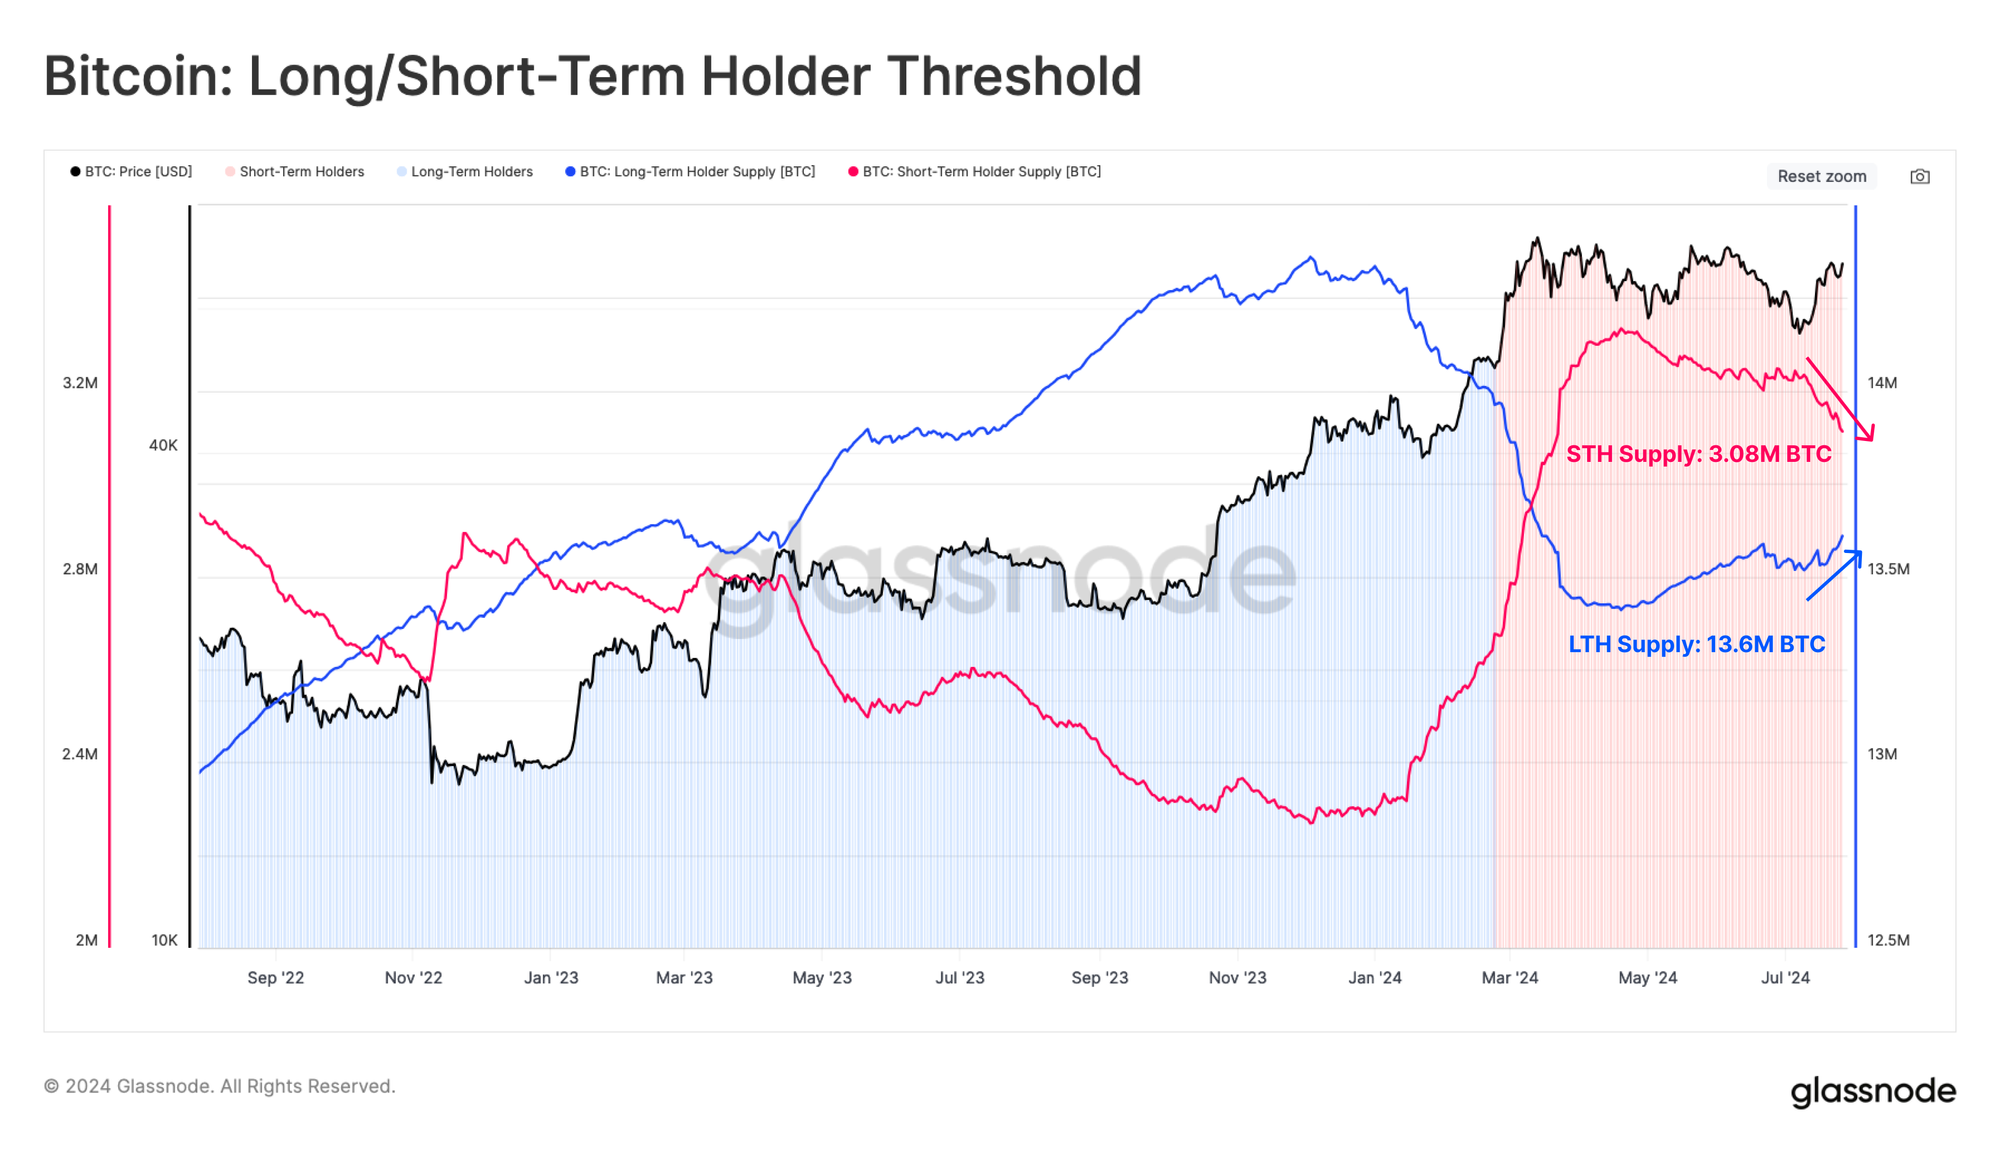
Comparing the total balance held by both Long and Short-Term Holders, we note that a new divergence is underway. The supply of long-term holders is increasing, and the supply of short-term holders is declining.
The chart below shows that the approximate age boundary separating LTHs and STHs is for coins acquired before/after late Feb 2024, when the price was around $51k. Likely, many of the coins acquired during the height of the ETF-hyped run-up will soon start migrating into LTH status, and this divergence is likely to accelerate.
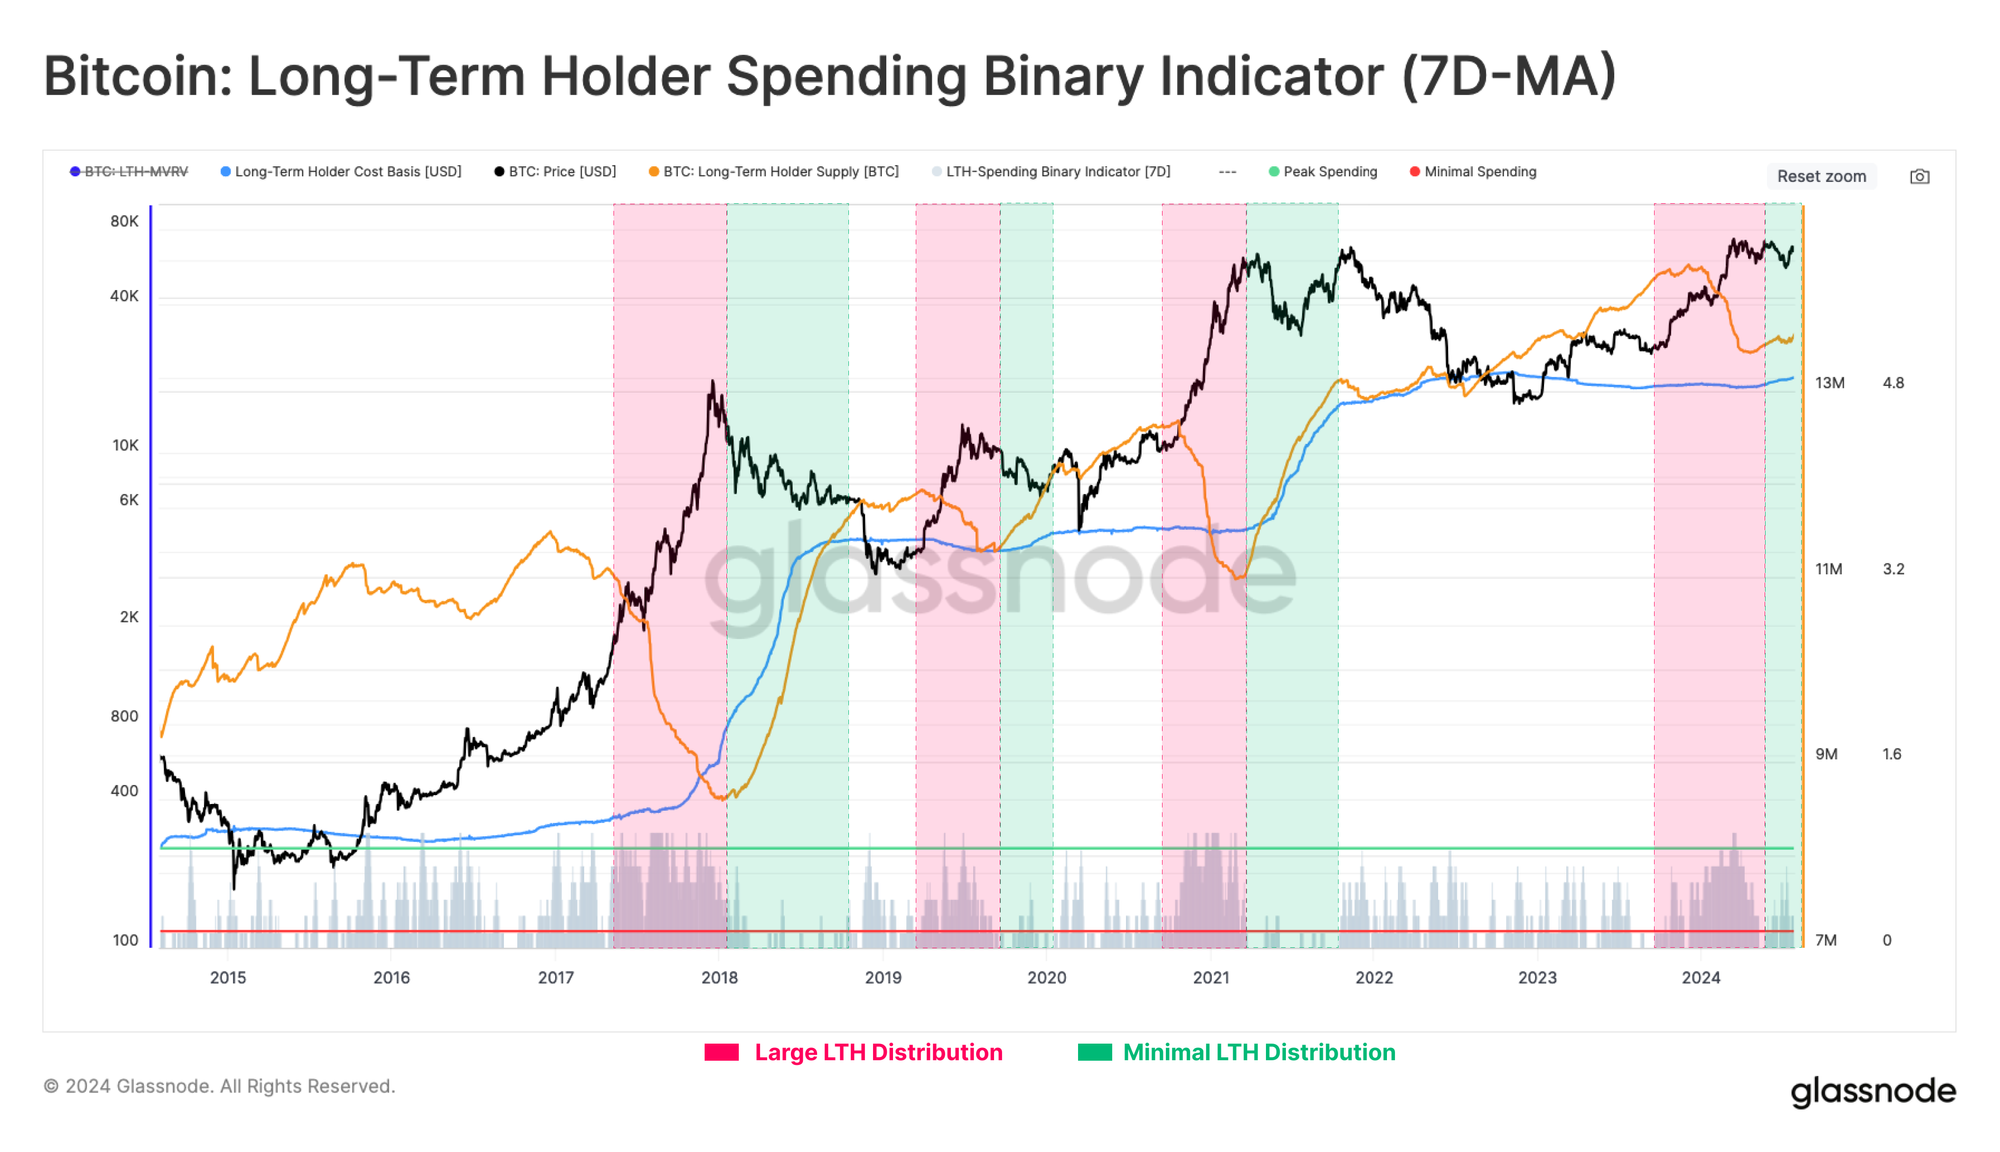
Finally, we can utilize the Long-Term Holder (LTH) Binary Spending Indicator to profile and visualize the intensity of HODLer distribution pressure.
The distribution pressure by the LTH cohort remains relatively light and is declining. This provides further confluence behind our general thesis that the Bitcoin supply remains dominated mainly by longer-term, high-conviction investors. HODLing remains the preferred strategy for the time being.
Summary and Conclusions
Finally, the long-awaited Mt.Gox distribution is occurring, a substantial victory for the creditors who fought tooth and nail for reimbursement in BTC and not fiat. Albeit, due to the rampant price increase across the decade, a non-trivial degree of sell-side pressure from the recipients can be assumed.
Nevertheless, the profile of the creditors appears to represent one of a HODLer or long-term investor, potentially dampening the magnitude of sell-side pressure across the coming weeks.
Alongside this, the balance sheet of Long-Term Holders continues to grow, while their proportion of network wealth held remains substantially high compared to prior macro topping events. This suggests that the predominant market mechanic has transitioned to one of HODLing, as mature investors wait for higher prices to part with their coins.
Disclaimer: This report does not provide any investment advice. All data is provided for information and educational purposes only. No investment decision shall be based on the information provided here and you are solely responsible for your own investment decisions.
Exchange balances presented are derived from Glassnode’s comprehensive database of address labels, which are amassed through both officially published exchange information and proprietary clustering algorithms. While we strive to ensure the utmost accuracy in representing exchange balances, it is important to note that these figures might not always encapsulate the entirety of an exchange’s reserves, particularly when exchanges refrain from disclosing their official addresses. We urge users to exercise caution and discretion when utilizing these metrics. Glassnode shall not be held responsible for any discrepancies or potential inaccuracies. Please read our Transparency Notice when using exchange data.
- Join our Telegram channel
- For on-chain metrics, dashboards, and alerts, visit Glassnode Studio
- For automated alerts on core on-chain metrics and activity on exchanges, visit our Glassnode Alerts Twitter