Short-Term Holder Stress
The Bitcoin market has continued to experience downward pressure over recent months despite the average Bitcoin investor remaining profitable overall. However, the Short-Term Holder cohort remains heavily underwater on their holdings, making them a source of risk for the time being.


Executive Summary
- On average, BTC investors hold relatively small unrealized losses compared to prior cycles, suggesting a relatively favourable overall position.
- However, Short-Term Holder unrealized losses remain quite elevated, indicating they are the primary cohort at risk.
- Profit and Loss-taking activities remain remarkably light, with critical metrics such as the Sell-Side Risk Ratio alluding to a potential for heightened volatility in the near future.
A Downwards Tilt
Bull Market Correction
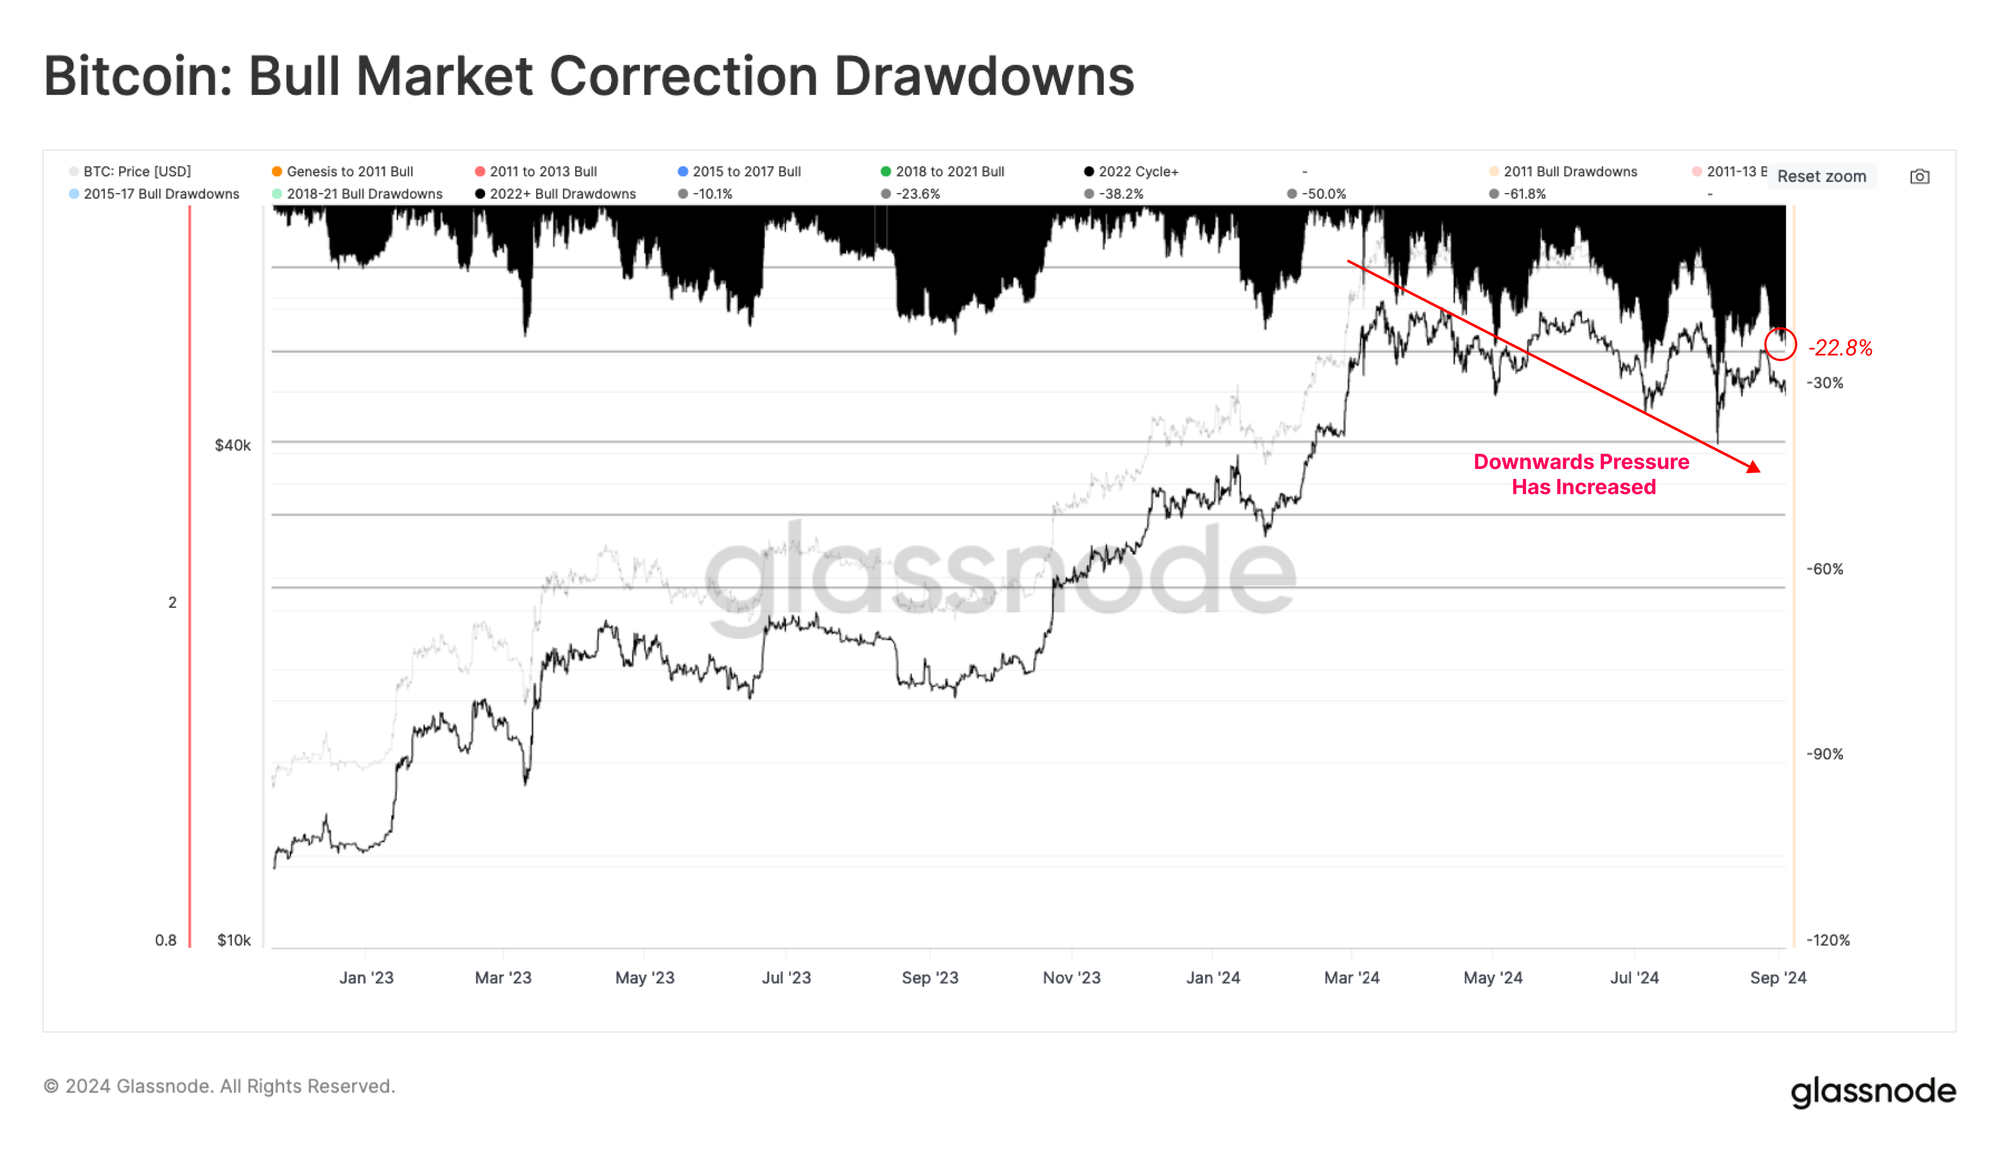
Price action has stagnated, and investor sentiment has been apathetic over the last six months. However, a notable change has occurred over the previous three months, with downward pressure increasing and causing the market to experience its most significant drawdown of the cycle.
Nevertheless, from a macro perspective, the spot price is trading around -22% below the ATH, which remains a relatively shallow drawdown compared to historical bull market regimes.
Current Market Pressures
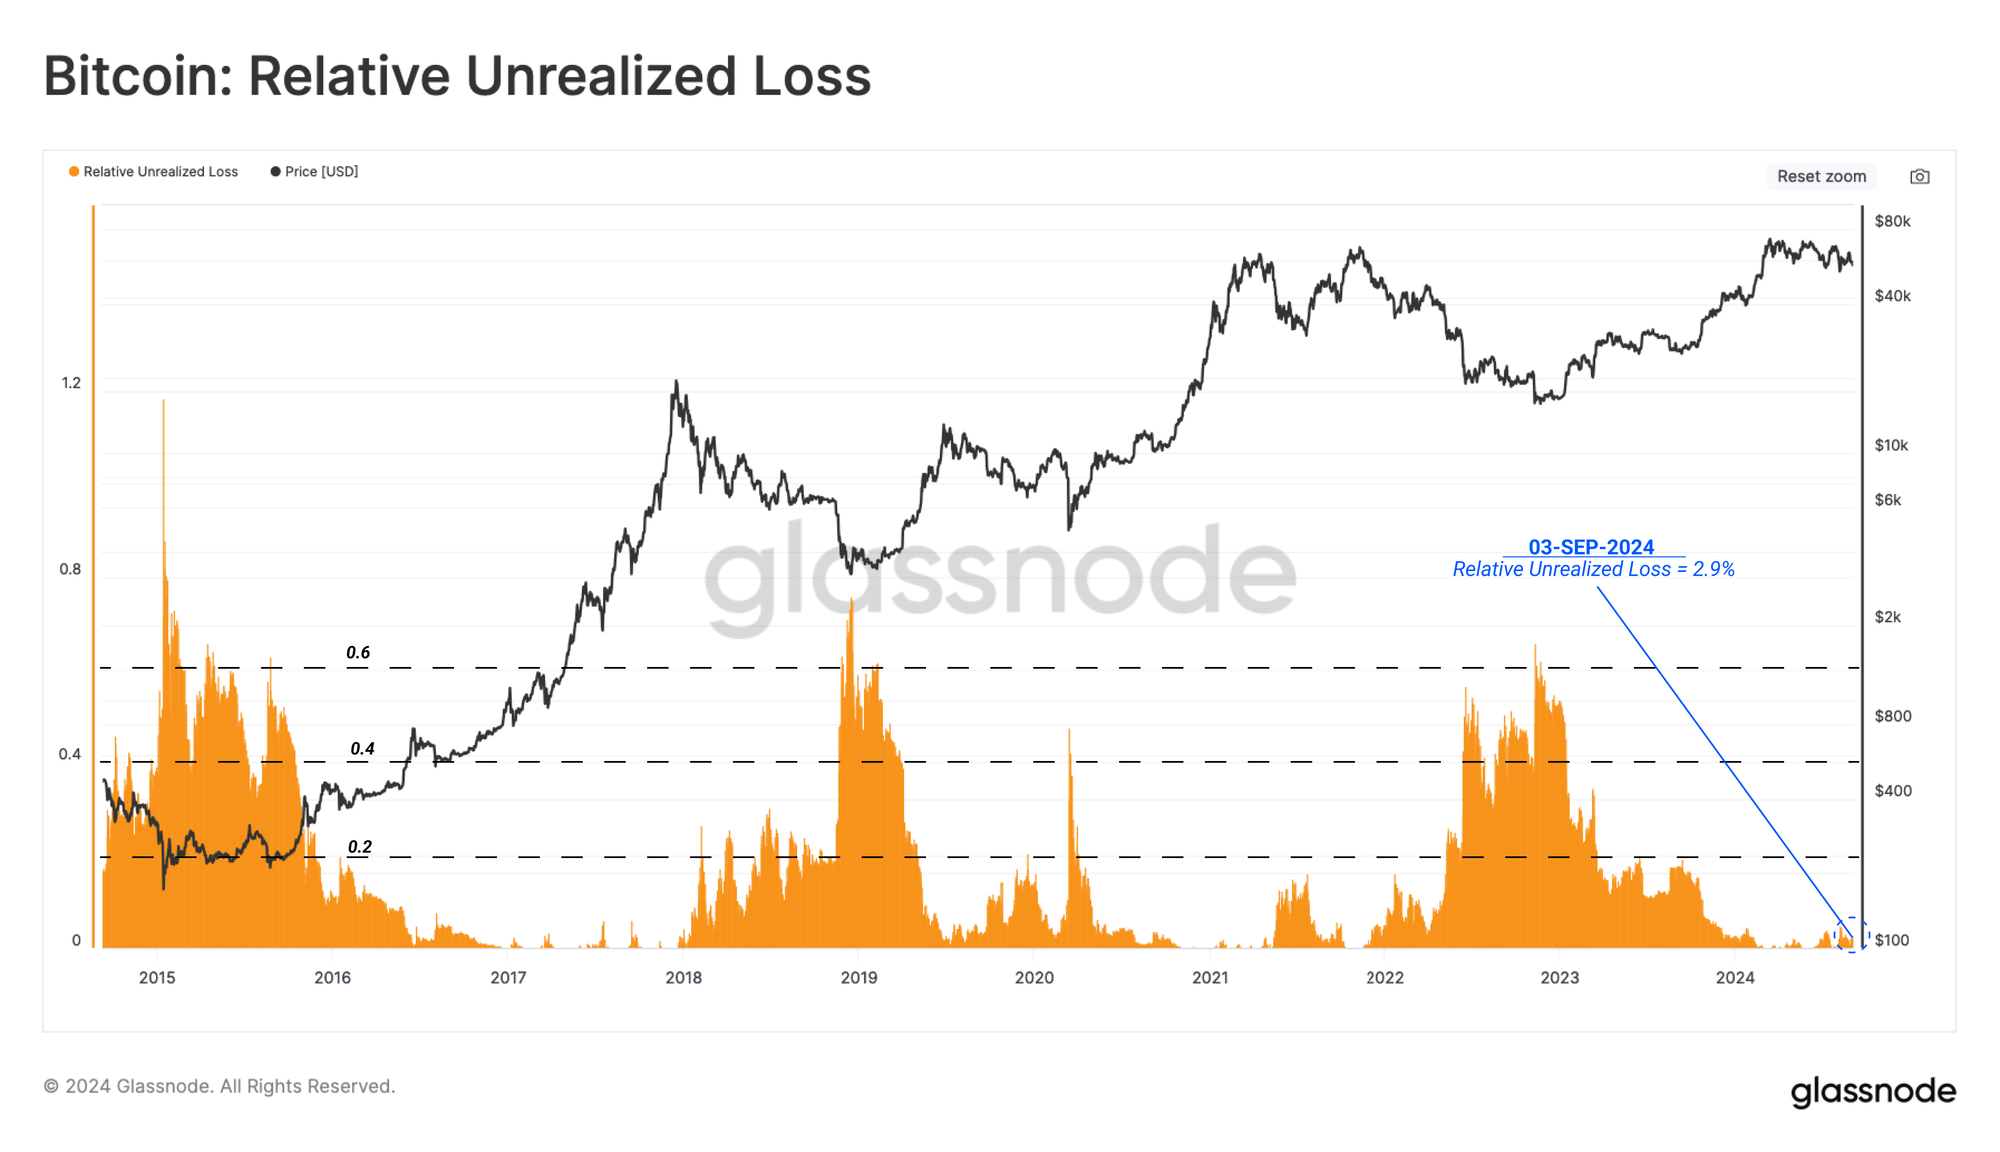
With downward price pressure increasing, it becomes prudent to assess the unrealized loss held by investors to evaluate the financial stress they are experiencing.
From the perspective of the broader market, unrealized losses remain historically low. Total unrealized losses amount to just 2.9% of the Bitcoin market cap, which is historically low.
This suggests that the aggregate investor remains relatively profitable, even in the face of continued price declines.
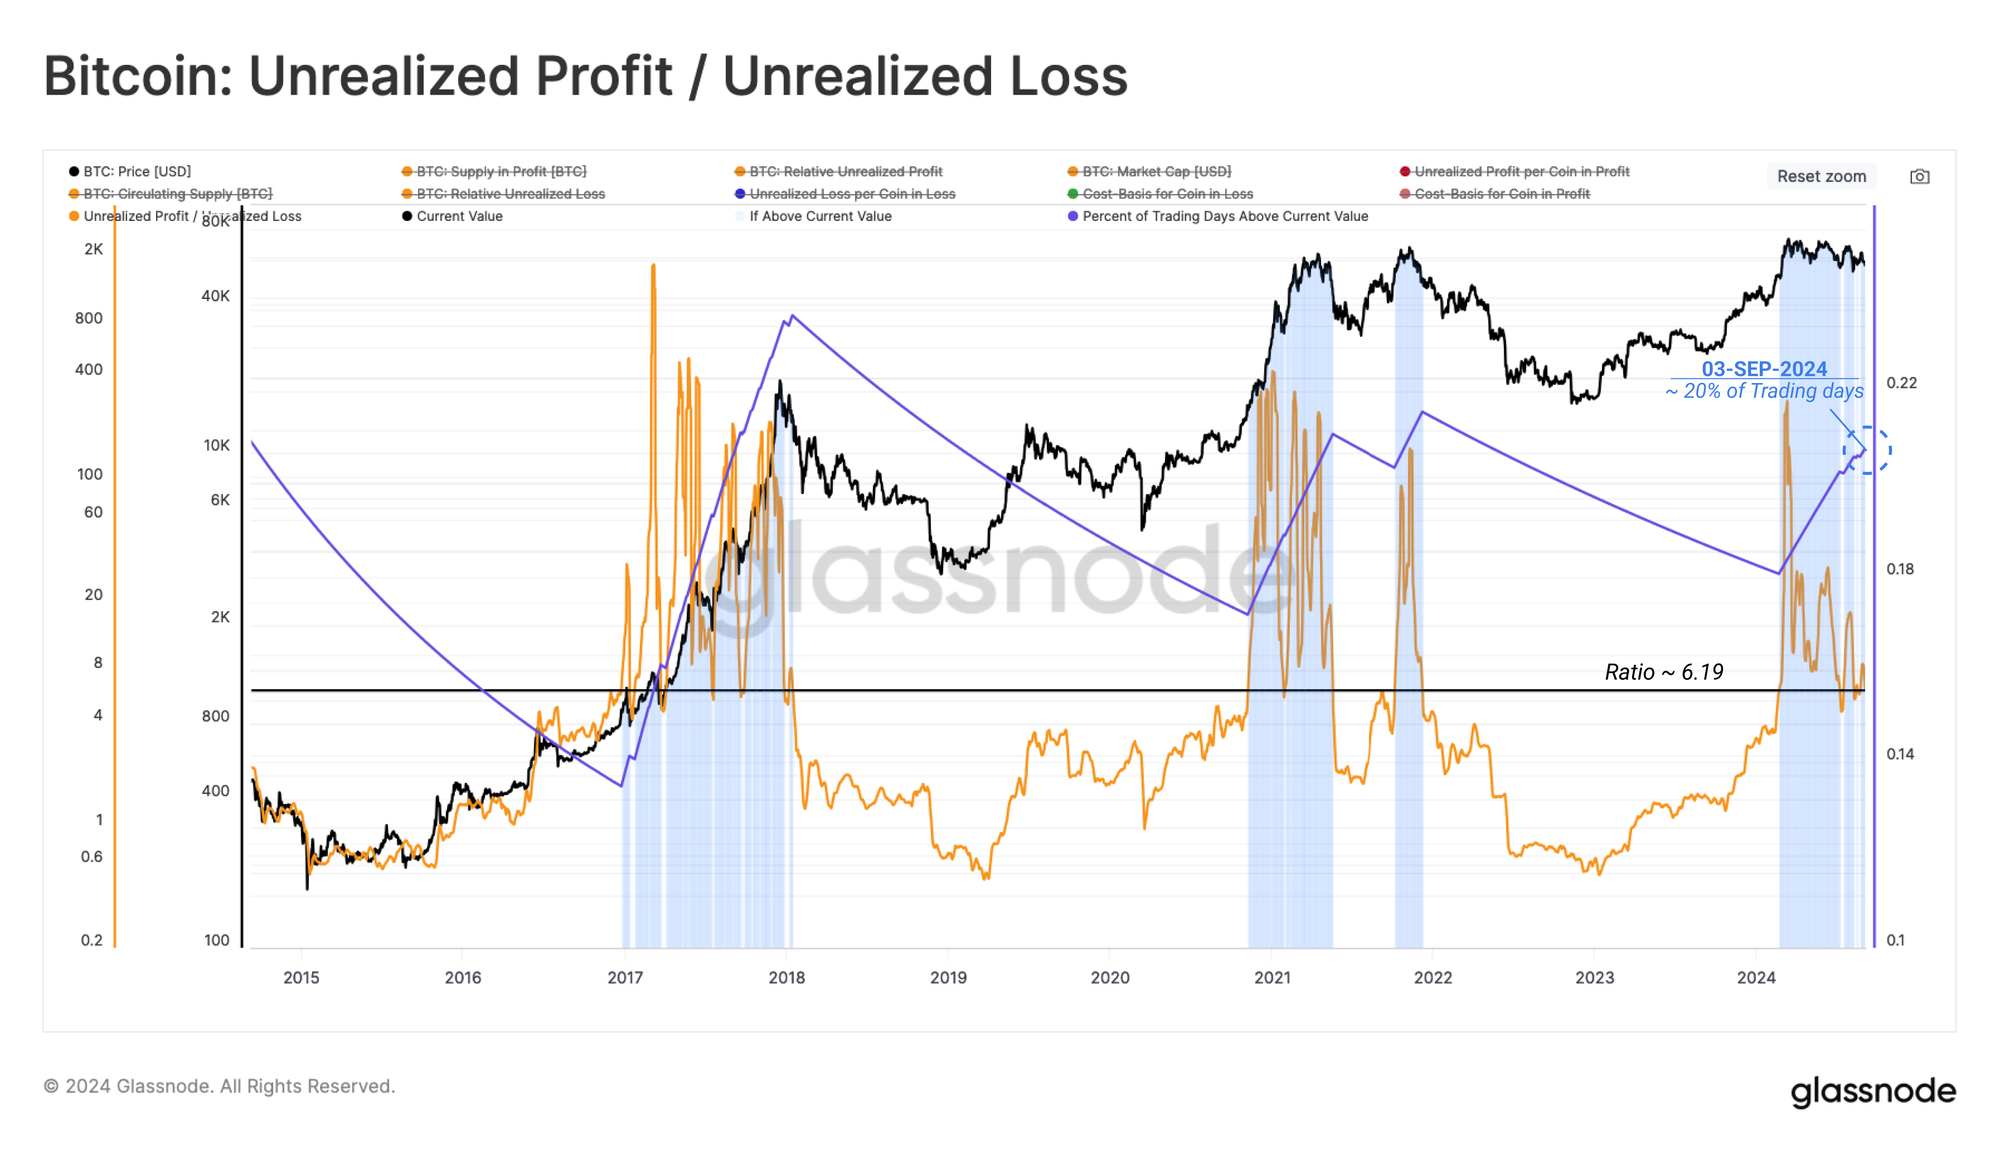
If we take the ratio between total Unrealized Profit and Unrealized Loss, we can see that profits remain 6x larger than losses, supporting the above observation. Around 20% of trading days have seen this ratio above the current value, underscoring the surprisingly robust financial position of the average investor.
Short-Term Concerns
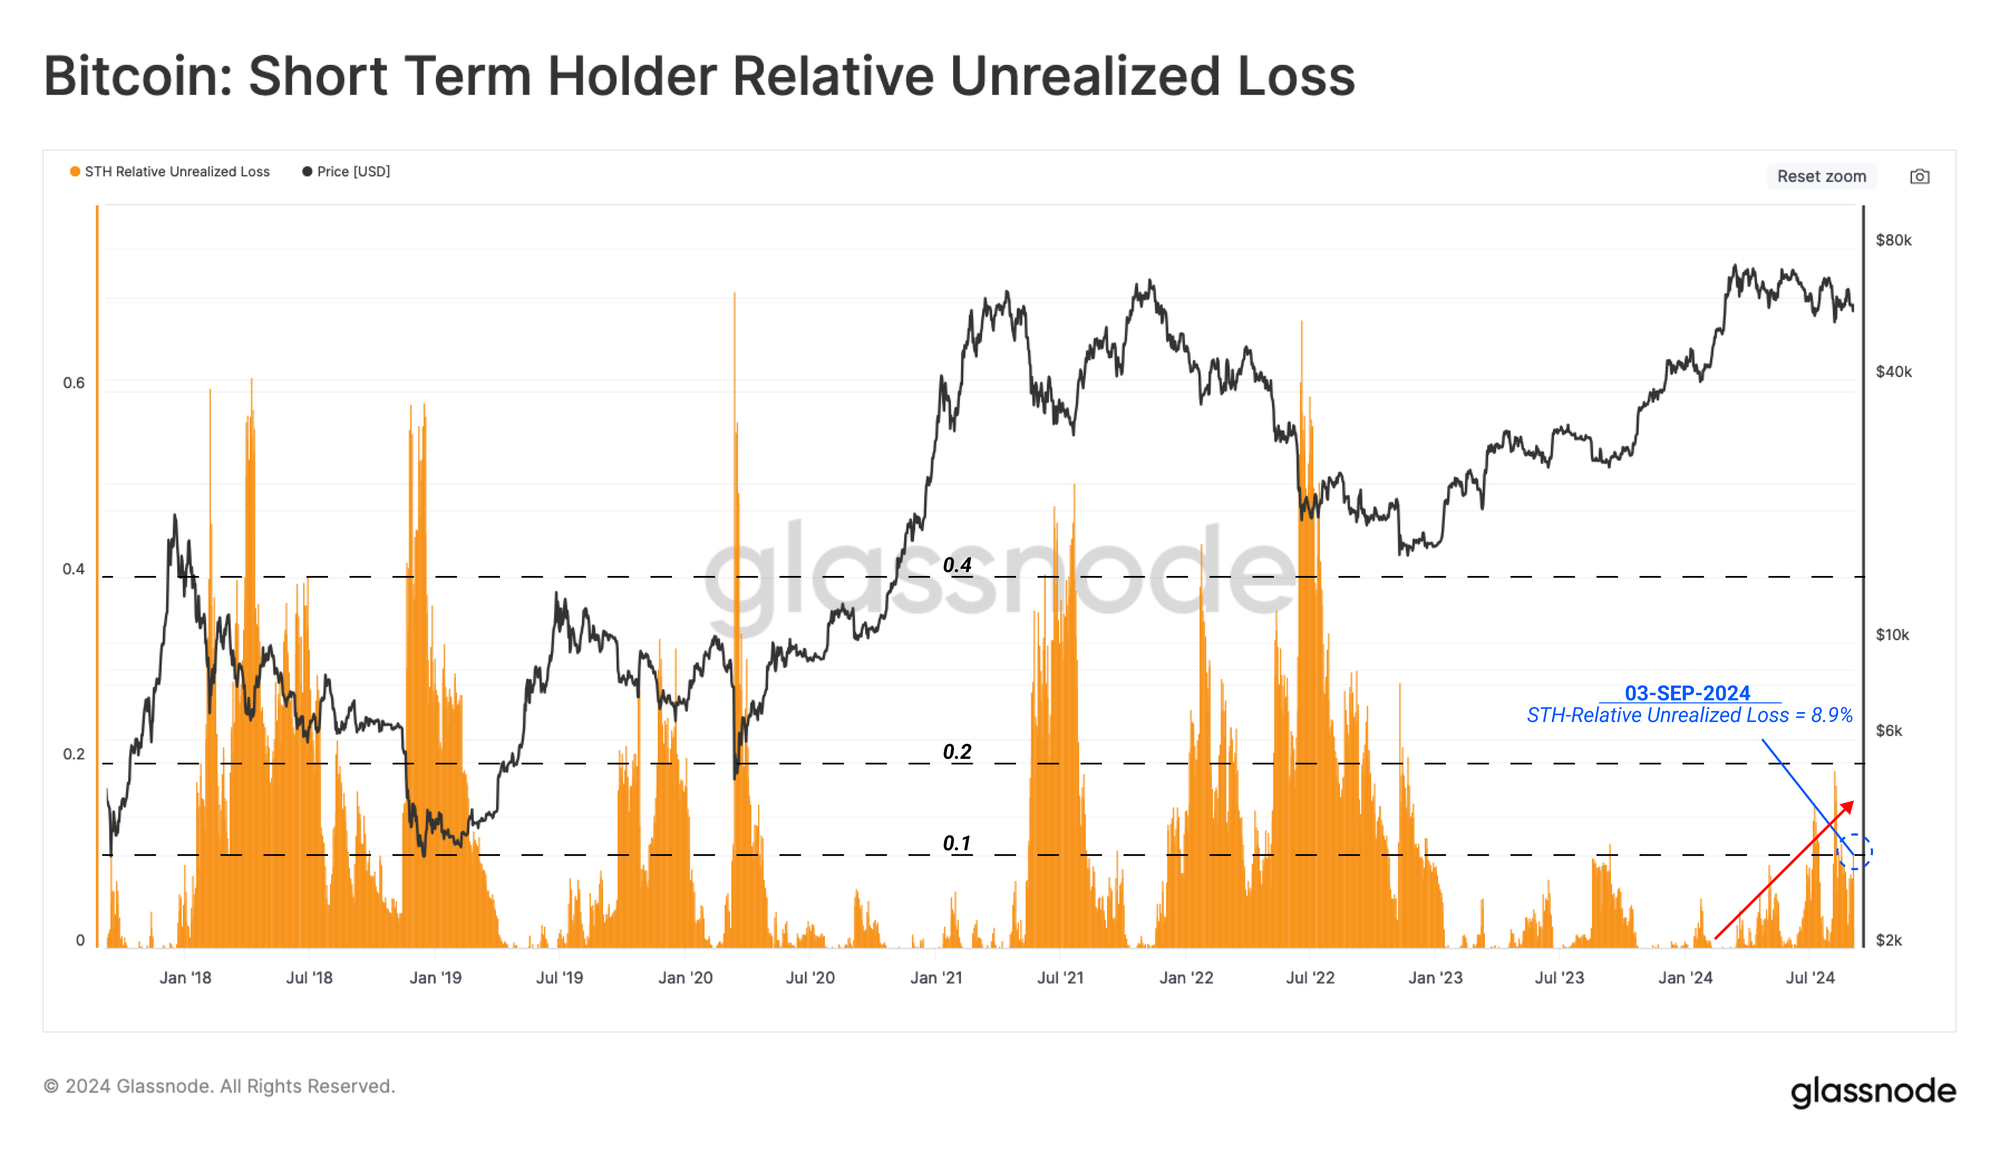
The Short-Term Holder cohort, representing new demand in the market, appears to be shouldering the majority of the market pressure. Their unrealized losses dominate overall, and the magnitude consistently increased over the last few months.
However, even for this cohort, the magnitude of their Unrealized Losses relative to the market cap is not yet in full-scale bear market territory and more closely resembles the choppy 2019 period.
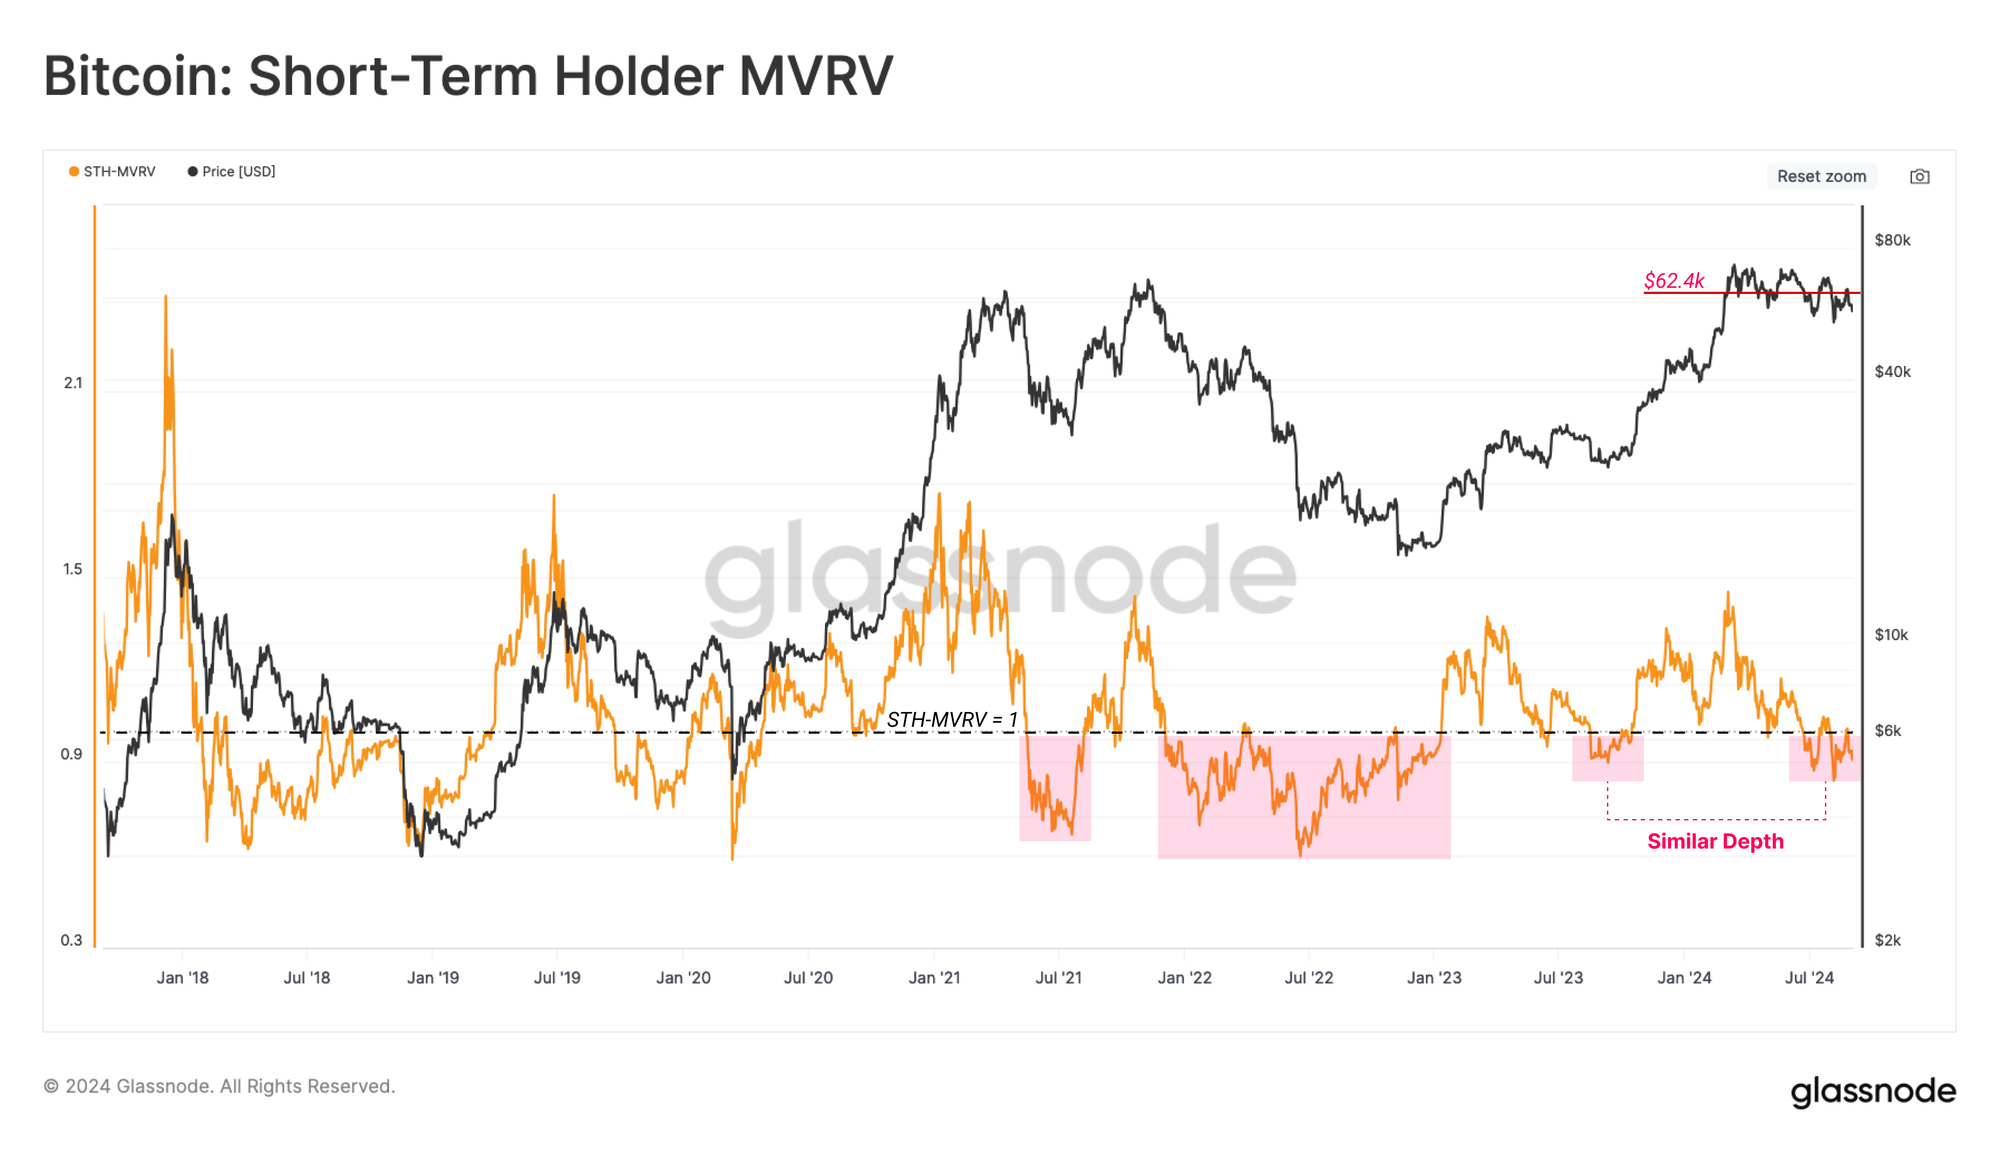
We can bolster the above observation by assessing the STH MVRV Ratio, which has collapsed below the breakeven value of 1.0. This metric trades at levels similar to Aug 2023 during the recovery rally after the FTX failure.
This tells us that the average new investor is holding an unrealized loss. Generally speaking, until the spot price reclaims the STH cost basis of $62.4k, there is an expectation for further market weakness.
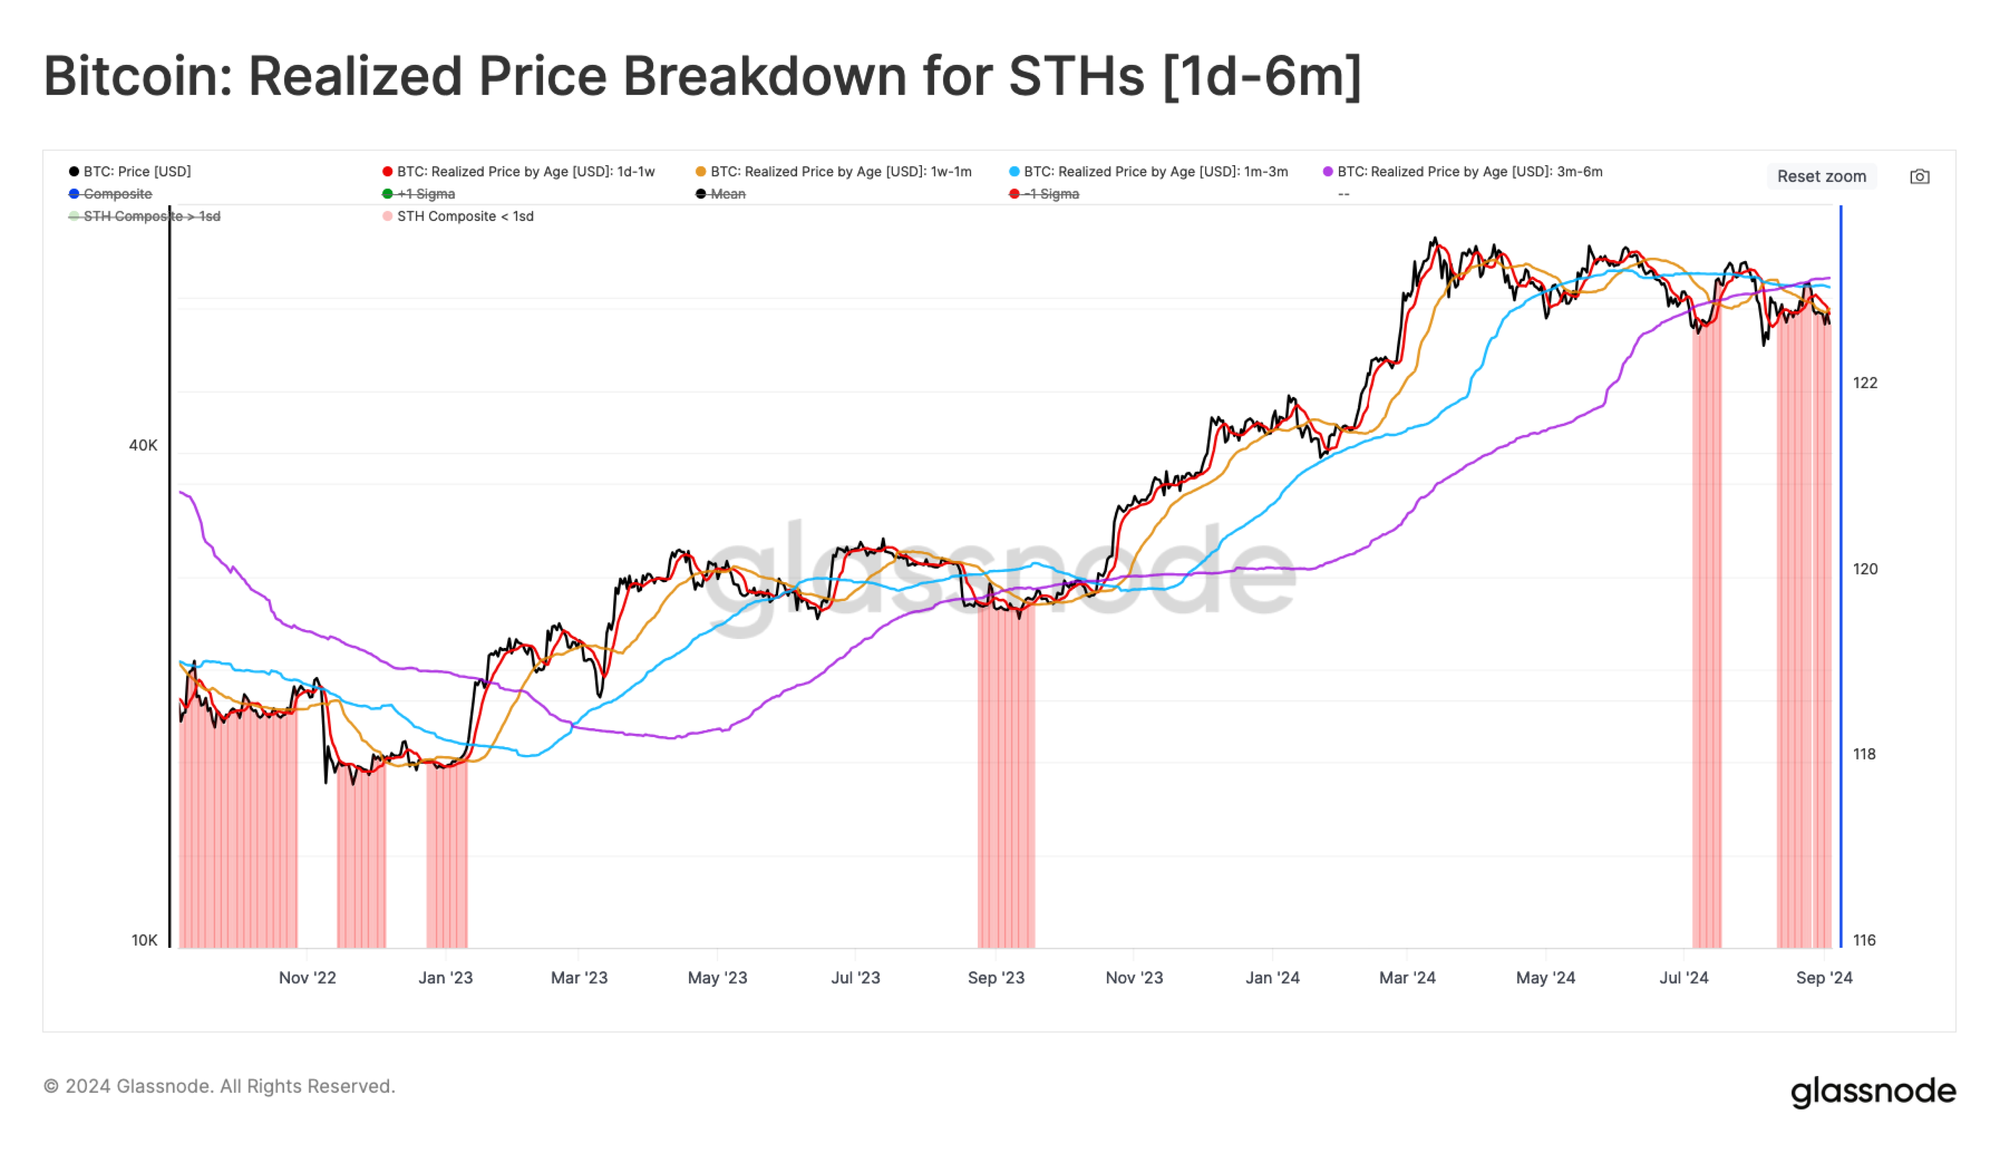
We can increase our confidence in this assessment by inspecting the subsets within the STH investor cohort. Presently, all age bands within the STH cohort are holding an unrealized loss, with their average cost basis as follows:
- 🔴 1d-1w: $59.0k
- 🟠 1w-1m: $59.9k
- 🔵 1m-3m: $63.6k
- 🟣 3m-6m: $65.2k
Investor Reactions
Assessing unrealized losses provides crucial insight into the pressure that market investors are experiencing. We can then supplement this with an analysis of the volumes of profit and loss realized (locked-in) to better understand how these investors respond to this pressure.
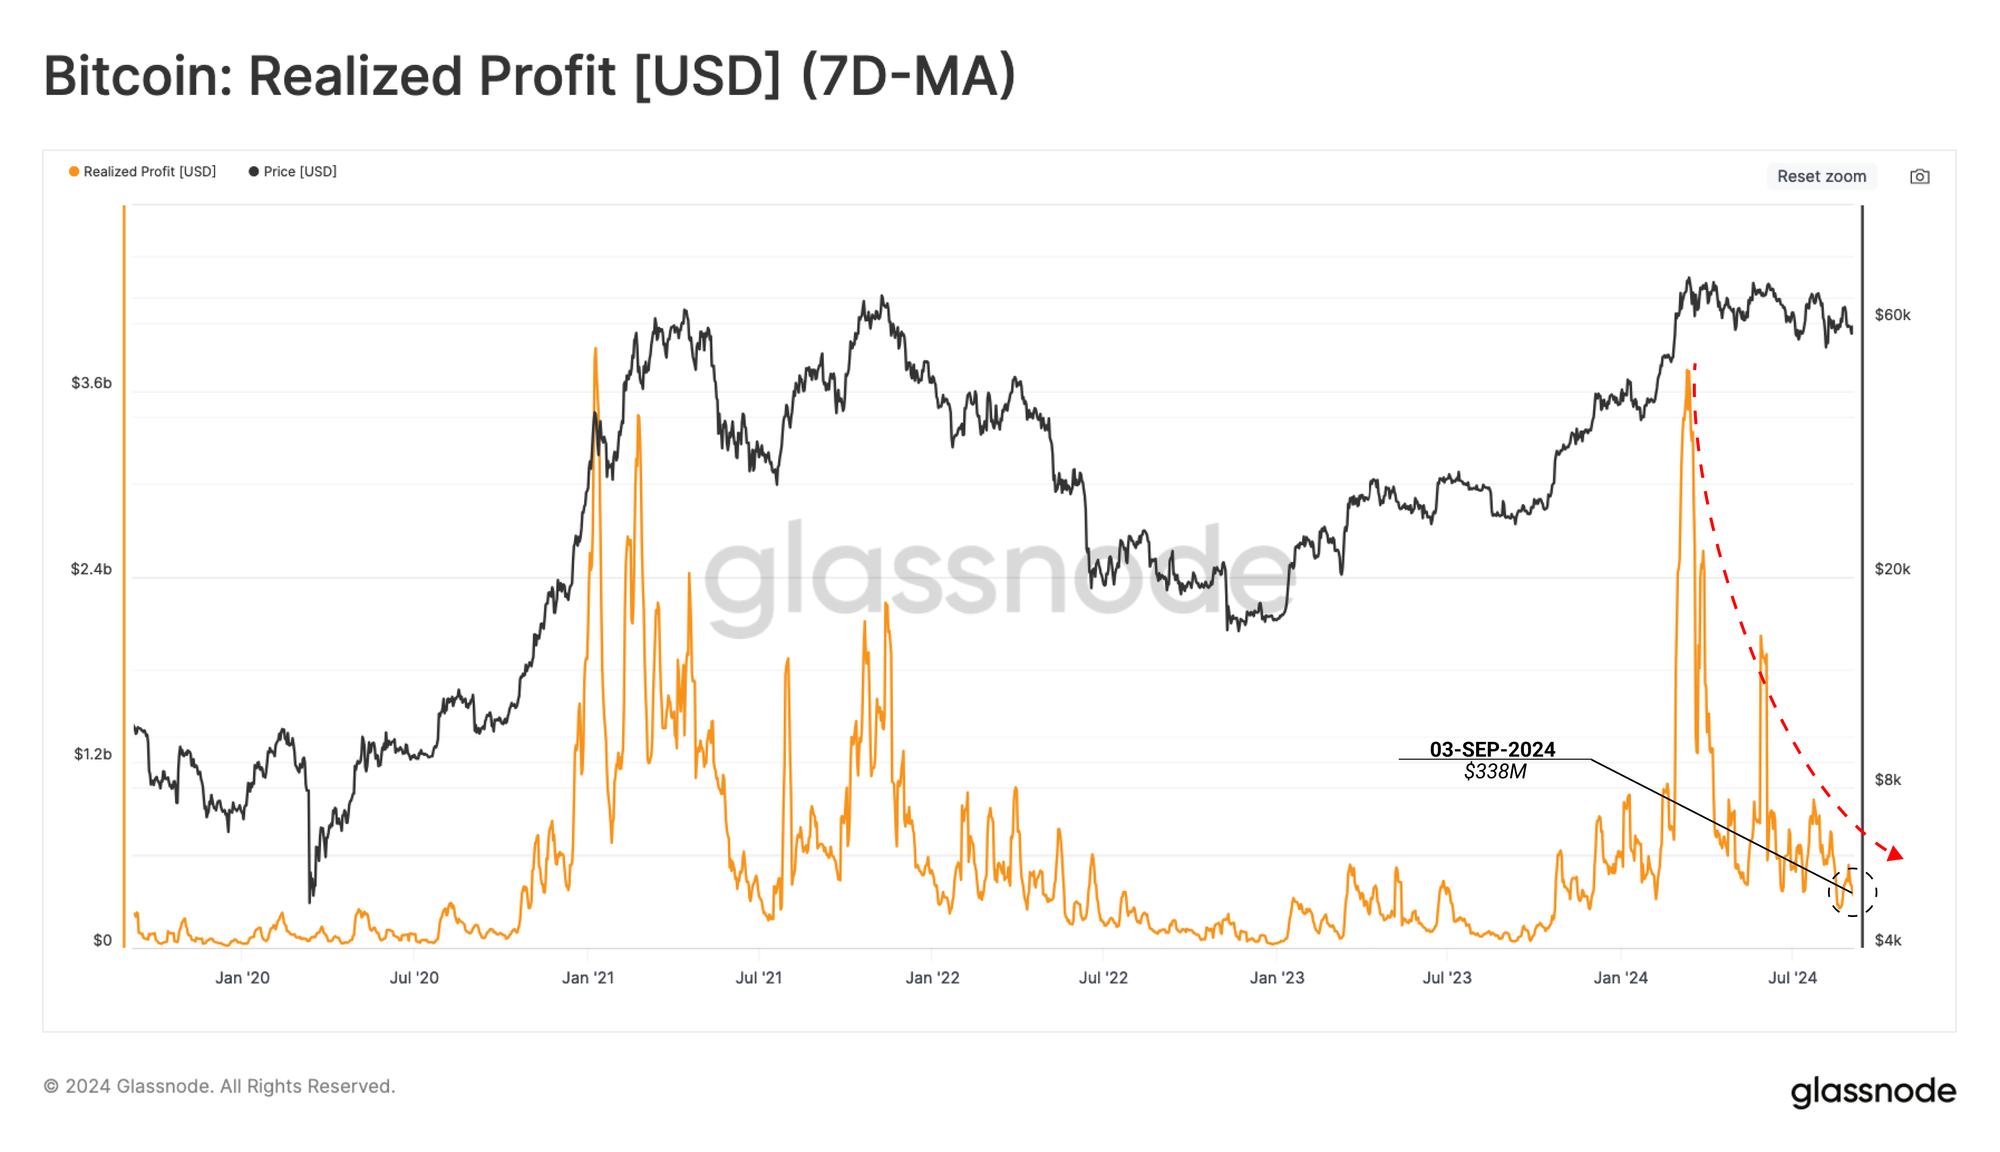
Beginning with realized profit, we can see a drastic decline following the $73k ATH, indicating that most coins spent since then have locked in increasingly small profit volumes.
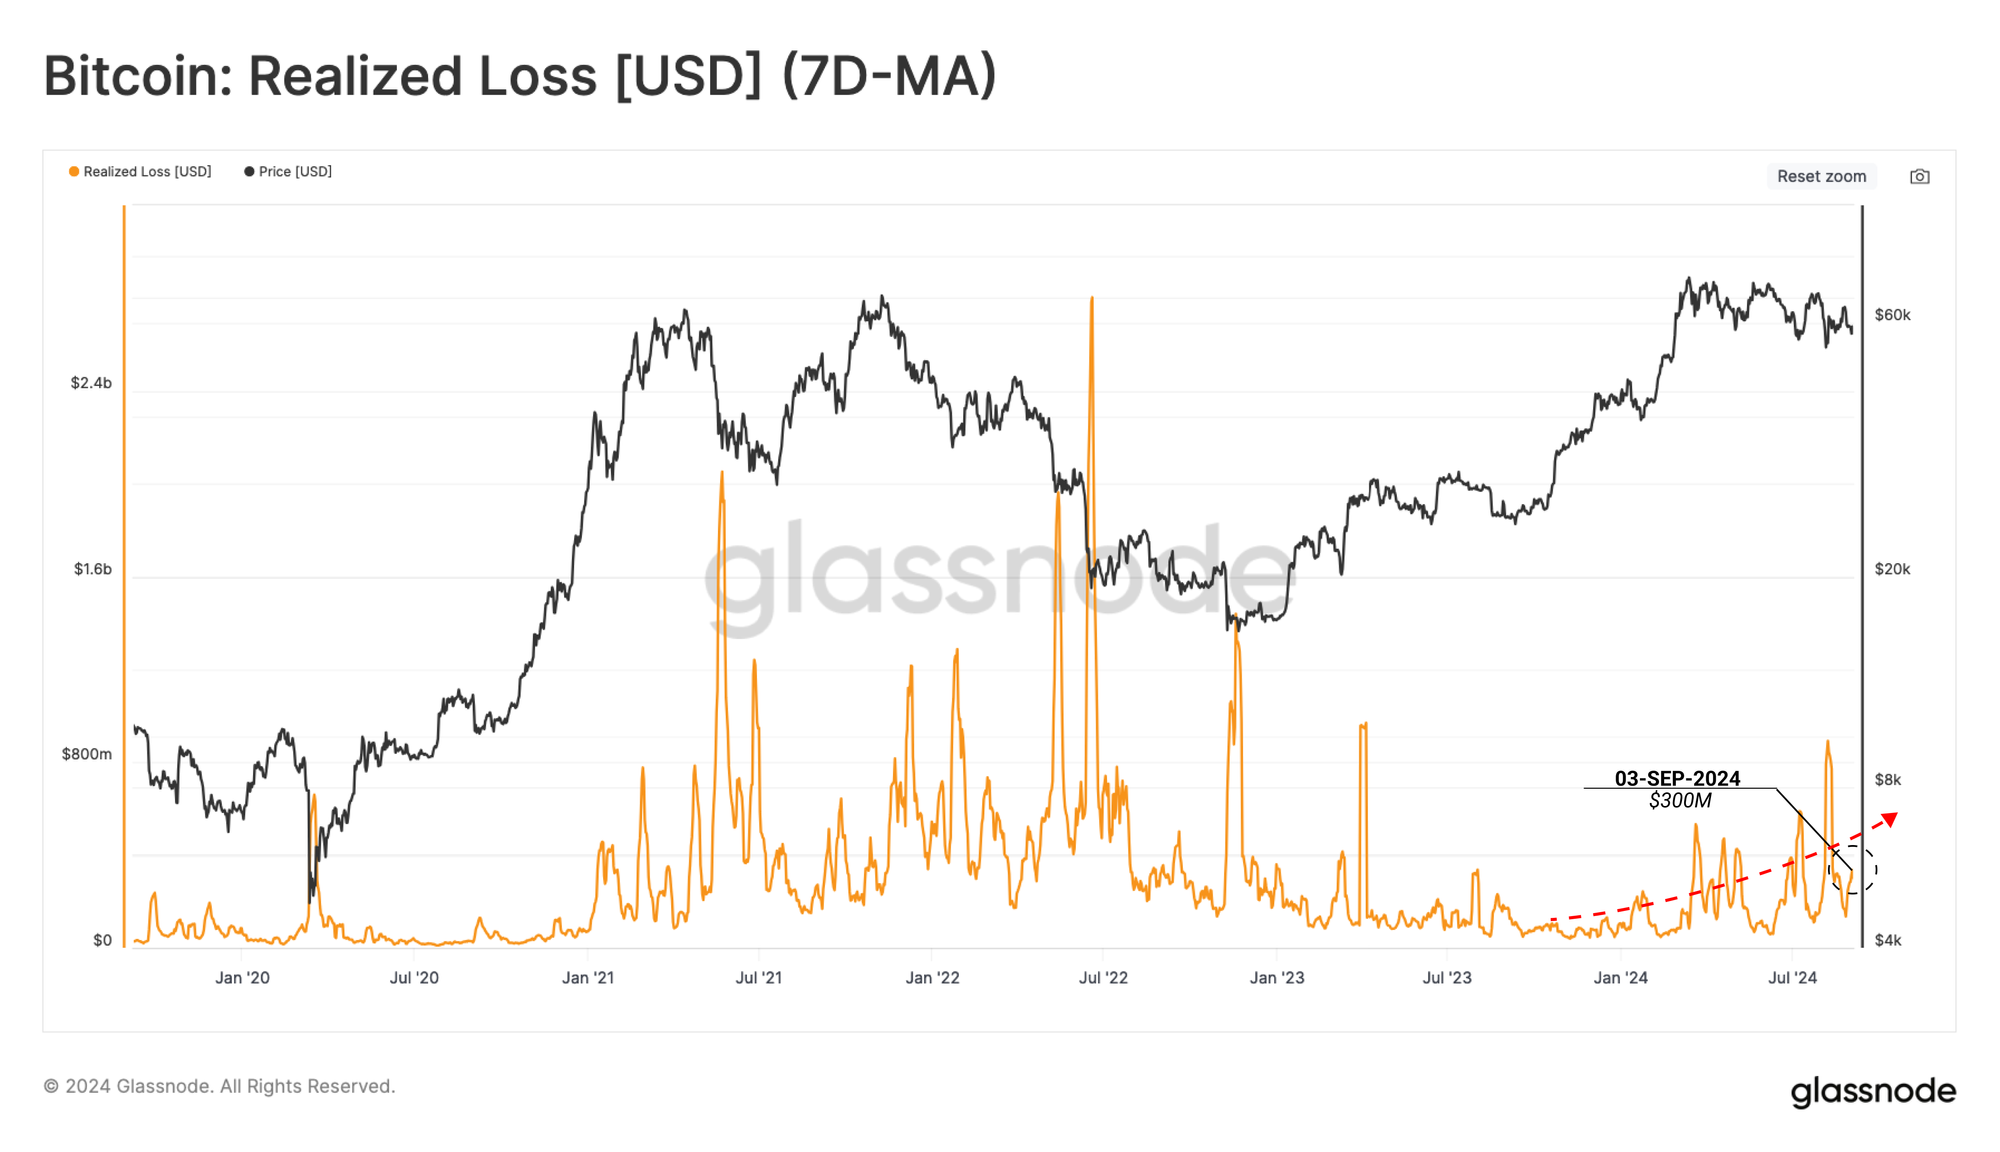
Moving toward realized losses, we note that loss-taking events are elevated, and trade is rising toward higher levels as the market downtrend progresses.
The loss-taking events are not yet at the extreme levels seen during the mid-2021 sell-off or the 2022 bear market. However, the gradual higher drift does indicate some fear creeping into investor behaviour patterns.
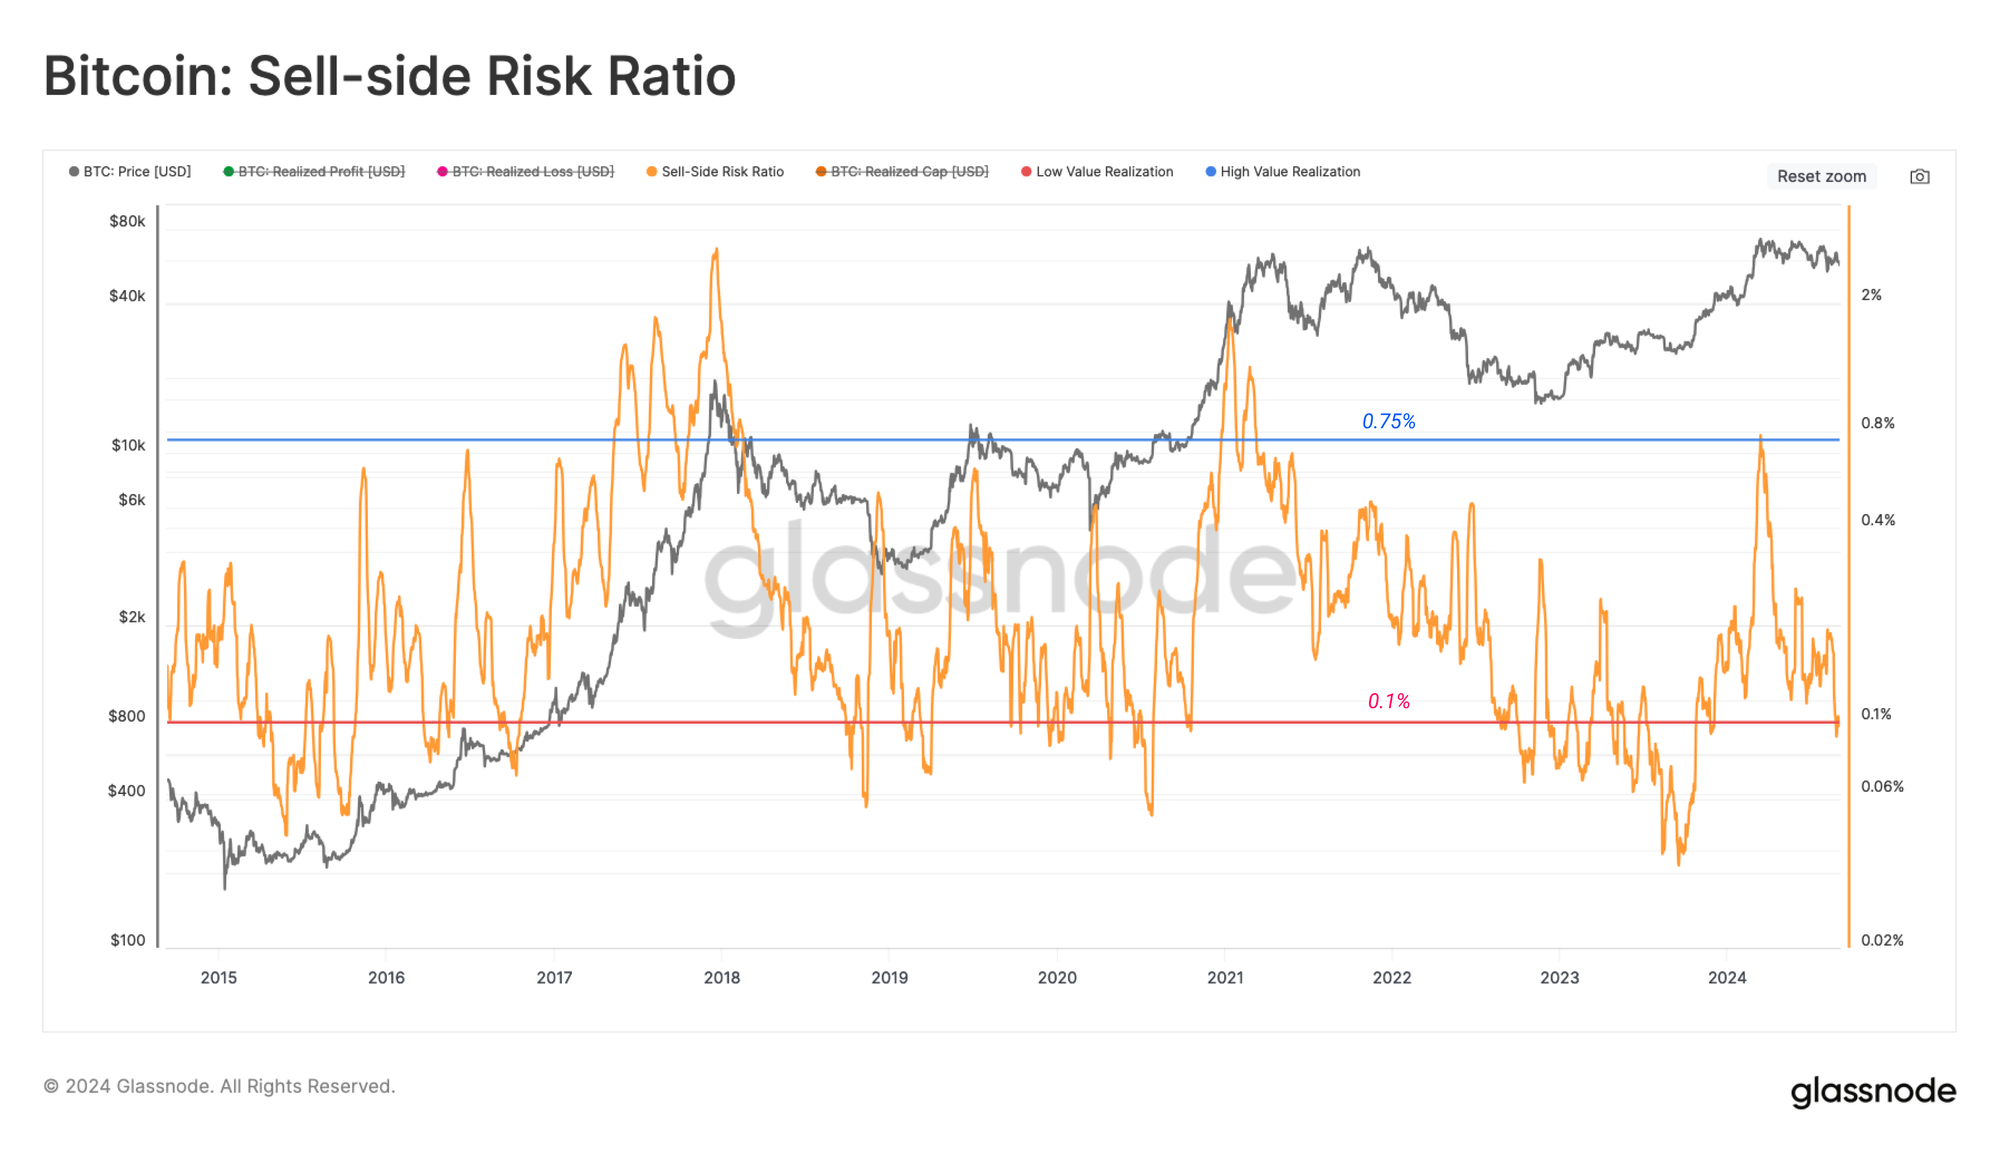
From the lens of the Sell-Side Risk Ratio, we can see that the total realized profit and loss are relatively small compared to the total market size. We can interpret this metric under the following framework:
- High values indicate that investors spend coins at a large profit or loss relative to their cost basis. This condition indicates that the market likely needs to re-find equilibrium and usually follows a high volatility price move.
- Low values indicate that most coins are being spent relatively close to their break-even cost basis, suggesting a degree of equilibrium has been reached. This condition often signifies an exhaustion of ‘profit and loss’ within the current price range and usually describes a low volatility environment.
The Sell-Side Risk Ratio has declined into the lower band, suggesting that most coins transacted on-chain are doing so close to their original acquisition price. This suggests a progressive saturation of profit and loss-taking activities within the current price range.
Historically, this alludes to an expectation for heightened volatility shortly and is similar to the 2019 period.
Navigating the Cycle
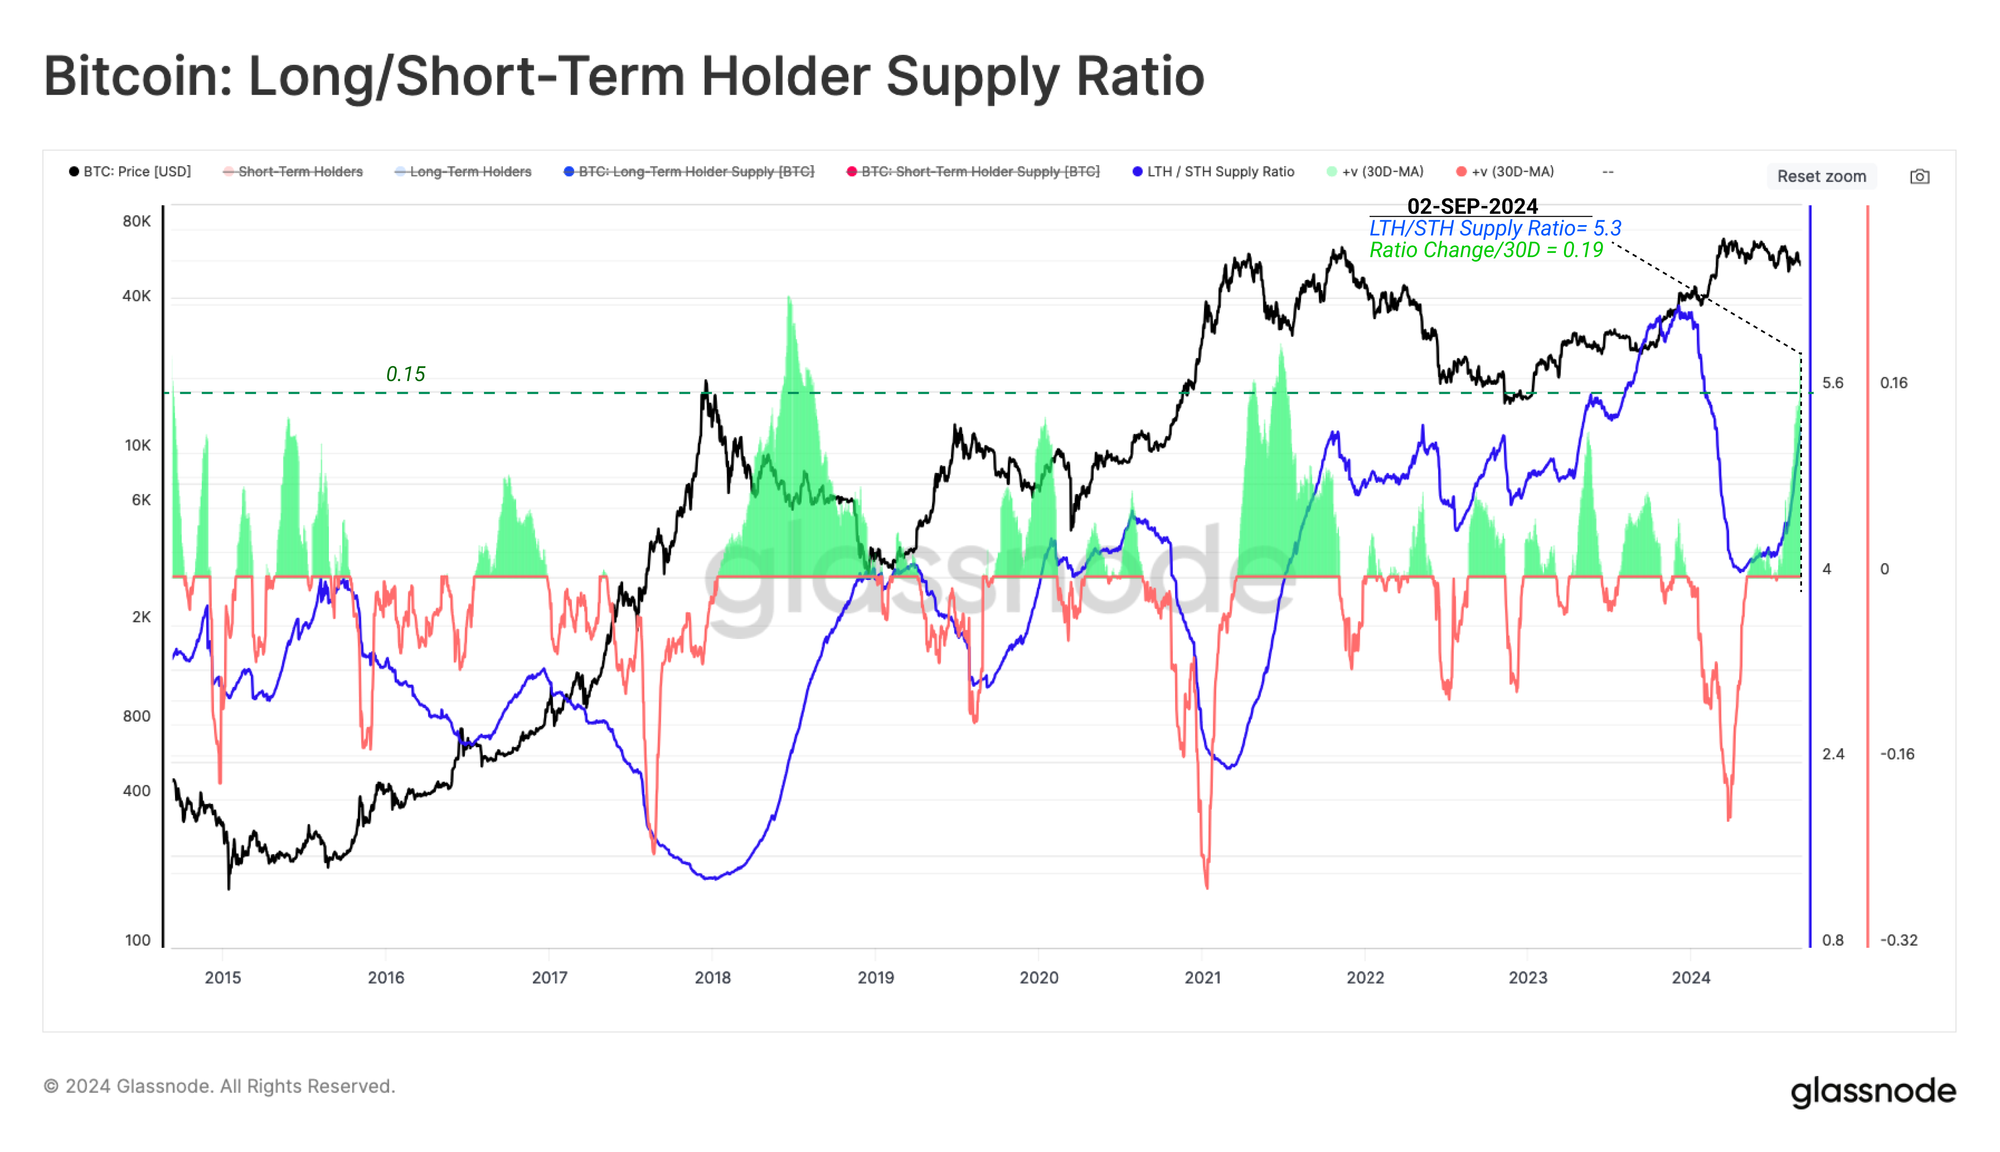
During downtrends, patience and HODLing naturally become a dominant market dynamic. A substantial amount of Long-Term Holder coins were spent for profit into the March ATH, creating a net supply overhang.
More recently, LTHs have slowed down their profit-taking, and supply accumulated during the ATH run-up is gradually maturing into Long-Term Holder status. However, historical examples of LTH supply increasing like this show that this usually occurs during the transition towards a bear market.
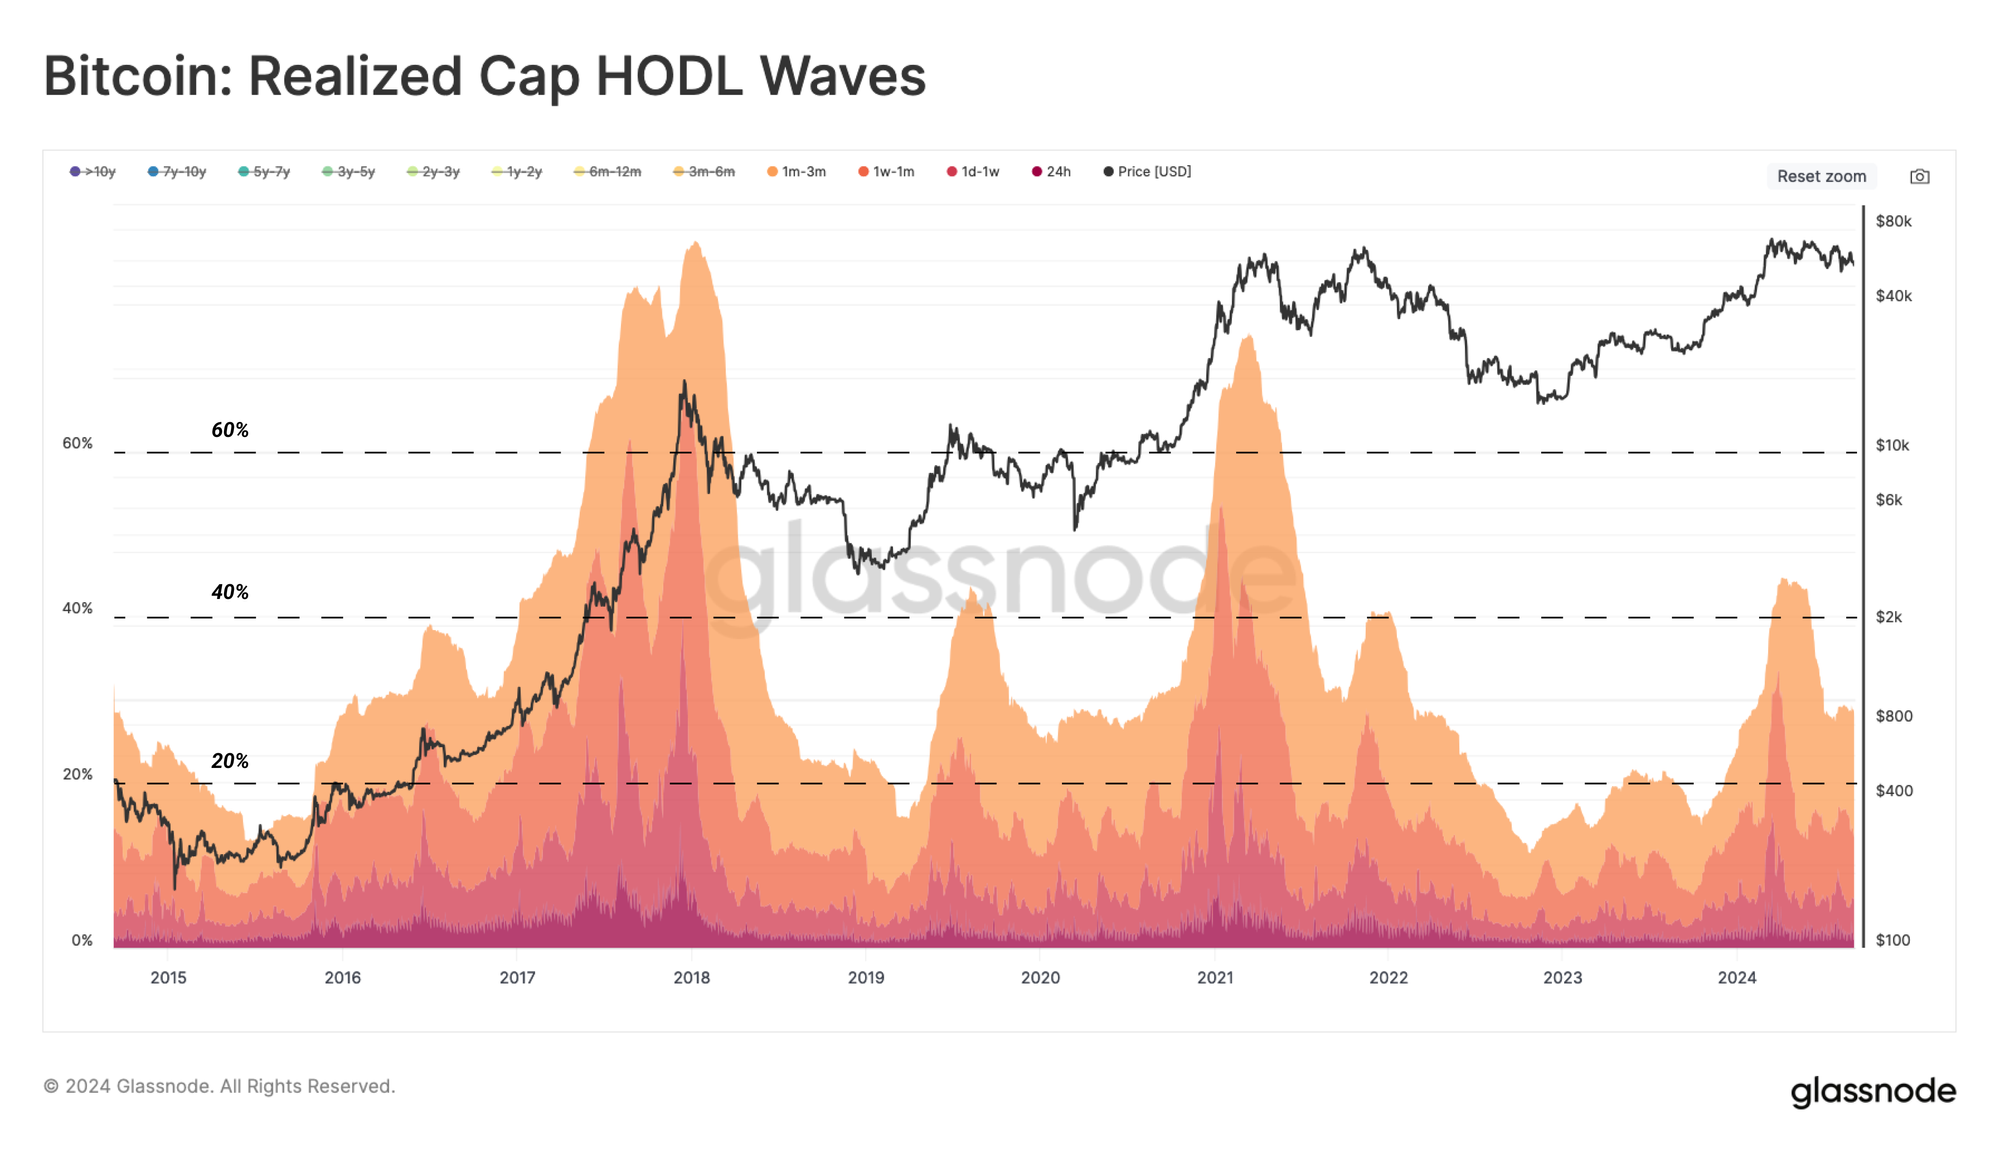
Compounding the above observation, we note that the wealth held by new-demand investors has declined over recent months as coins mature and transition into Long-Term Holder status.
The percentage of wealth held by new investors did not reach the elevated limits experienced during previous ATH distribution events. This may indicate that the 2024 peak is more aligned with the 2019 mid-cycle high rather than the macro highs seen in 2017 and 2021.
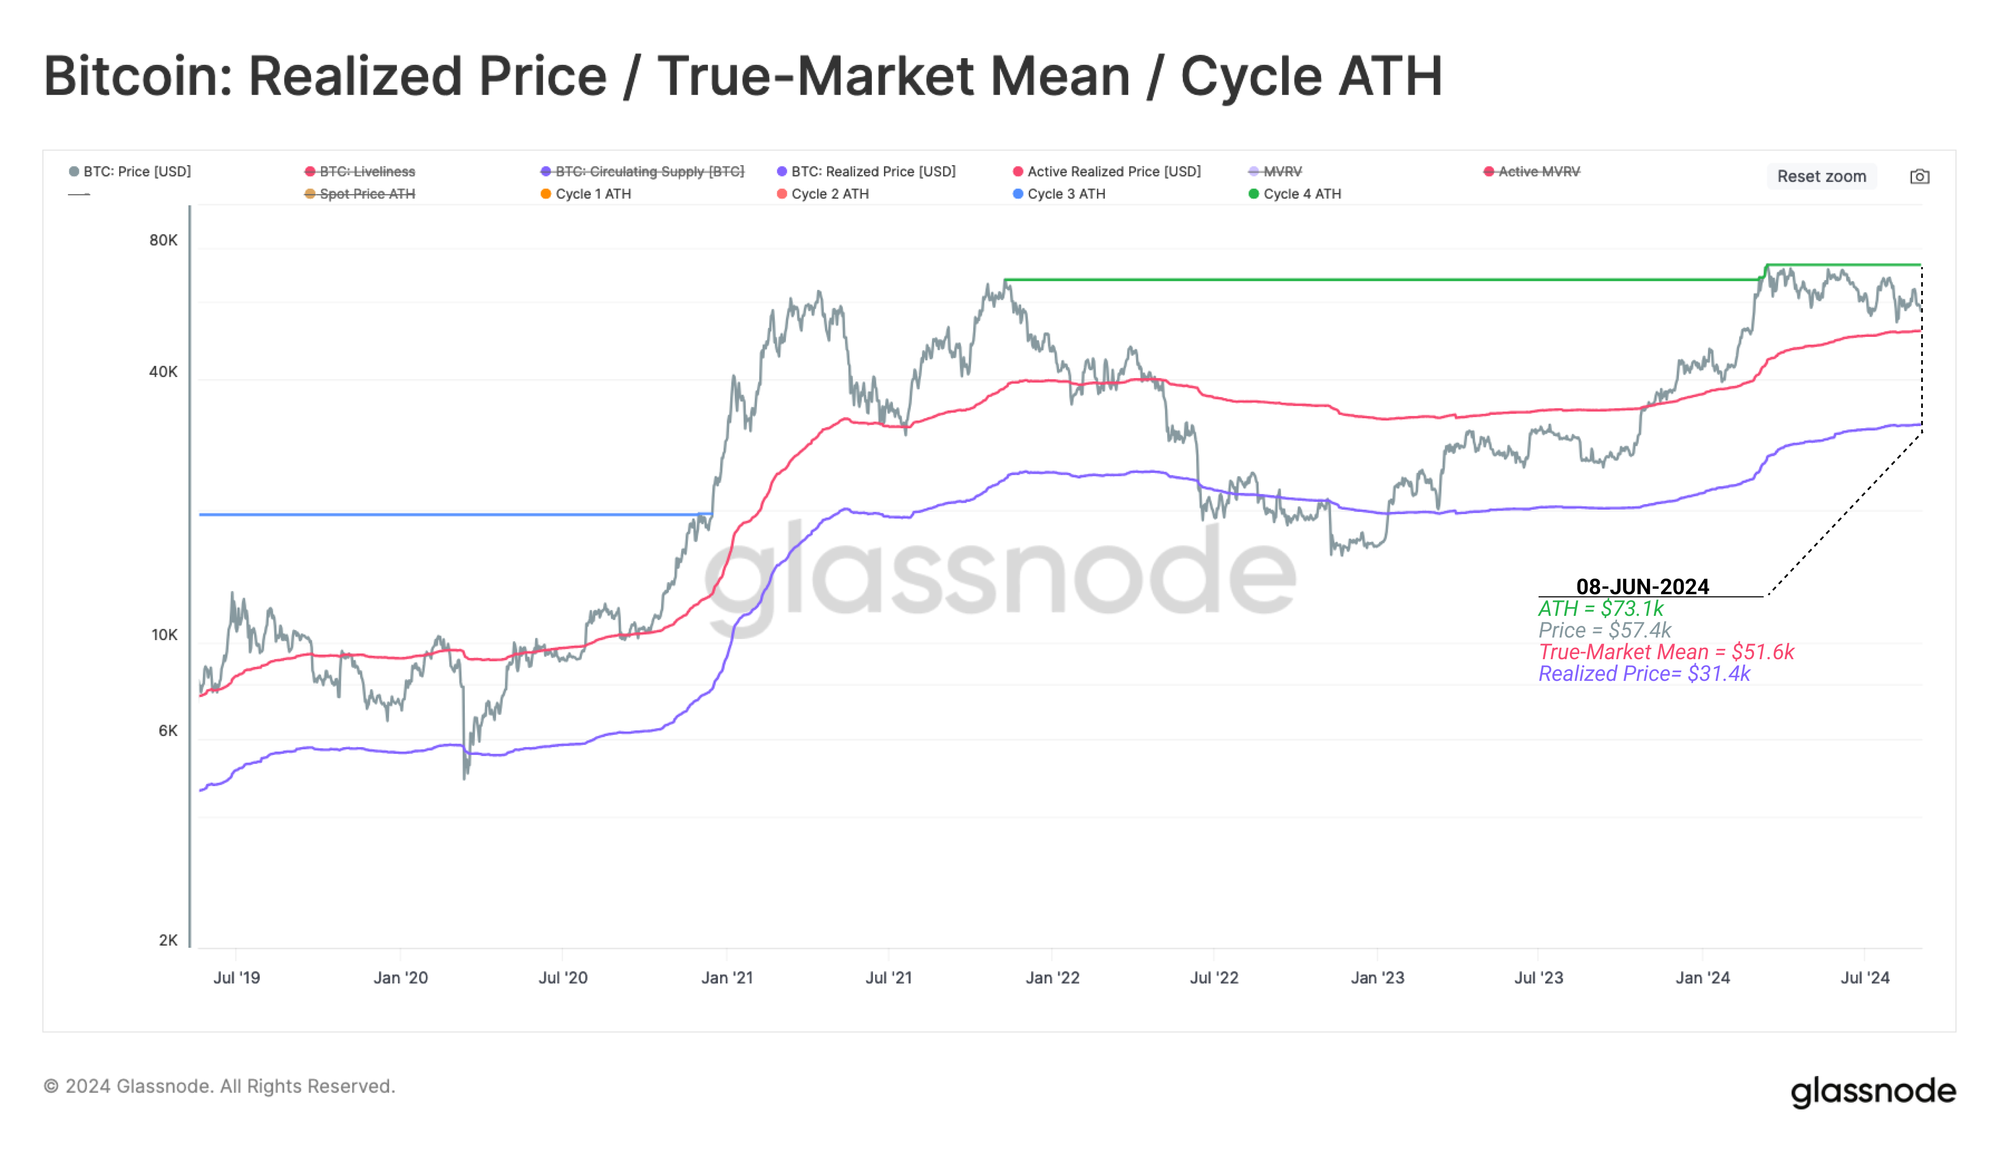
To conclude our analysis, we shall consult a simplified framework for thinking about historical Bitcoin market cycles using key onchain pricing levels:
- 🔴 Deep Bear Market: Prices trade below the Realized Price.
- 🔵 Early Bull Market: Prices trade between Realized Price and True Market Mean.
- 🟠 Enthusiastic Bull Market: Prices trade between the ATH and True Market Mean.
- 🟢 Euphoric Bull Market: Prices trade above the previous cycles ATH.
Under this framework, price action remains within the Enthusiastic Bull Market structure, which is a constructive observation. However, in the event of a local downturn, the pricing level of $51k remains a critical area of interest that must be maintained for further price appreciation.
Summary and Conclusions
With Bitcoin residing only a mere 22% drawdown from its ATH, a considerably shallower drawdown than prior cycles, the average BTC investor remains vastly profitable, highlighting the robustness of their positioning.
Nevertheless, the Short-Term Holder cohort continues to carry elevated unrealized losses, indicating they are the primary cohort at risk and the expected source of sell-side pressure in the event of a downturn.
Alongside this, profit and Loss-taking activities remain remarkably light, suggesting a saturation of our current range with critical metrics such as the sell-side risk ratio, which alludes to a potential for heightened volatility in the near future.
Disclaimer: This report does not provide any investment advice. All data is provided for information and educational purposes only. No investment decision shall be based on the information provided here and you are solely responsible for your own investment decisions.
Exchange balances presented are derived from Glassnode’s comprehensive database of address labels, which are amassed through both officially published exchange information and proprietary clustering algorithms. While we strive to ensure the utmost accuracy in representing exchange balances, it is important to note that these figures might not always encapsulate the entirety of an exchange’s reserves, particularly when exchanges refrain from disclosing their official addresses. We urge users to exercise caution and discretion when utilizing these metrics. Glassnode shall not be held responsible for any discrepancies or potential inaccuracies. Please read our Transparency Notice when using exchange data.
- Join our Telegram channel
- For on-chain metrics, dashboards, and alerts, visit Glassnode Studio