Inscriptions, Mempools and Miners
Inscriptions have been a significant buyer of Bitcoin blockspace since their introduction in Feb 2023. In this edition, we explore whether inscriptions are displacing monetary transfers, and how the increase in fees has impacted miner profitability.


Executive Summary
- Inscriptions act as a form of buyer of last resort for cheap blockspace, and appear to be sensitive to the absolute fee paid.
- Inscriptions are best thought of as a sort of 'packing filler' which is stuffed into any remaining space once the higher value monetary transfers are packed into blocks.
- Analysis of fees and volume need to consider that there can be a higher perception of 'value' assigned to the inscriptions beyond the BTC volume being transferred and held.
- Despite a meaningful uptick in fee revenue for miners, the halving event is likely to put many of them into extreme income stress unless BTC prices increase meaningfully.
Full Mempools
Inscriptions have been a major consumer of Bitcoin blockspace since their introduction in Feb 2023. In this edition, we will explore how Inscriptions have changed the landscape of on-chain activity, Mempools, and miner revenues, and what it may look like on the road ahead.
The 'Bitcoin mempool' can be thought of as a cloud of unconfirmed transactions which are all awaiting inclusion in a block by miners. Every Bitcoin node actually has its own unique mempool, defined by both the rules set by the node operator, but also by the transactions that it 'knows about' from the peer-to-peer gossip network.
The chart below shows the data size of the highest fee paying transactions in the Glassnode mempool over the last year. Of note is the significant uptick in blockspace demand which started in February, aligned with the release of Ordinals and Inscriptions. This elevated demand has been sustained ever since.
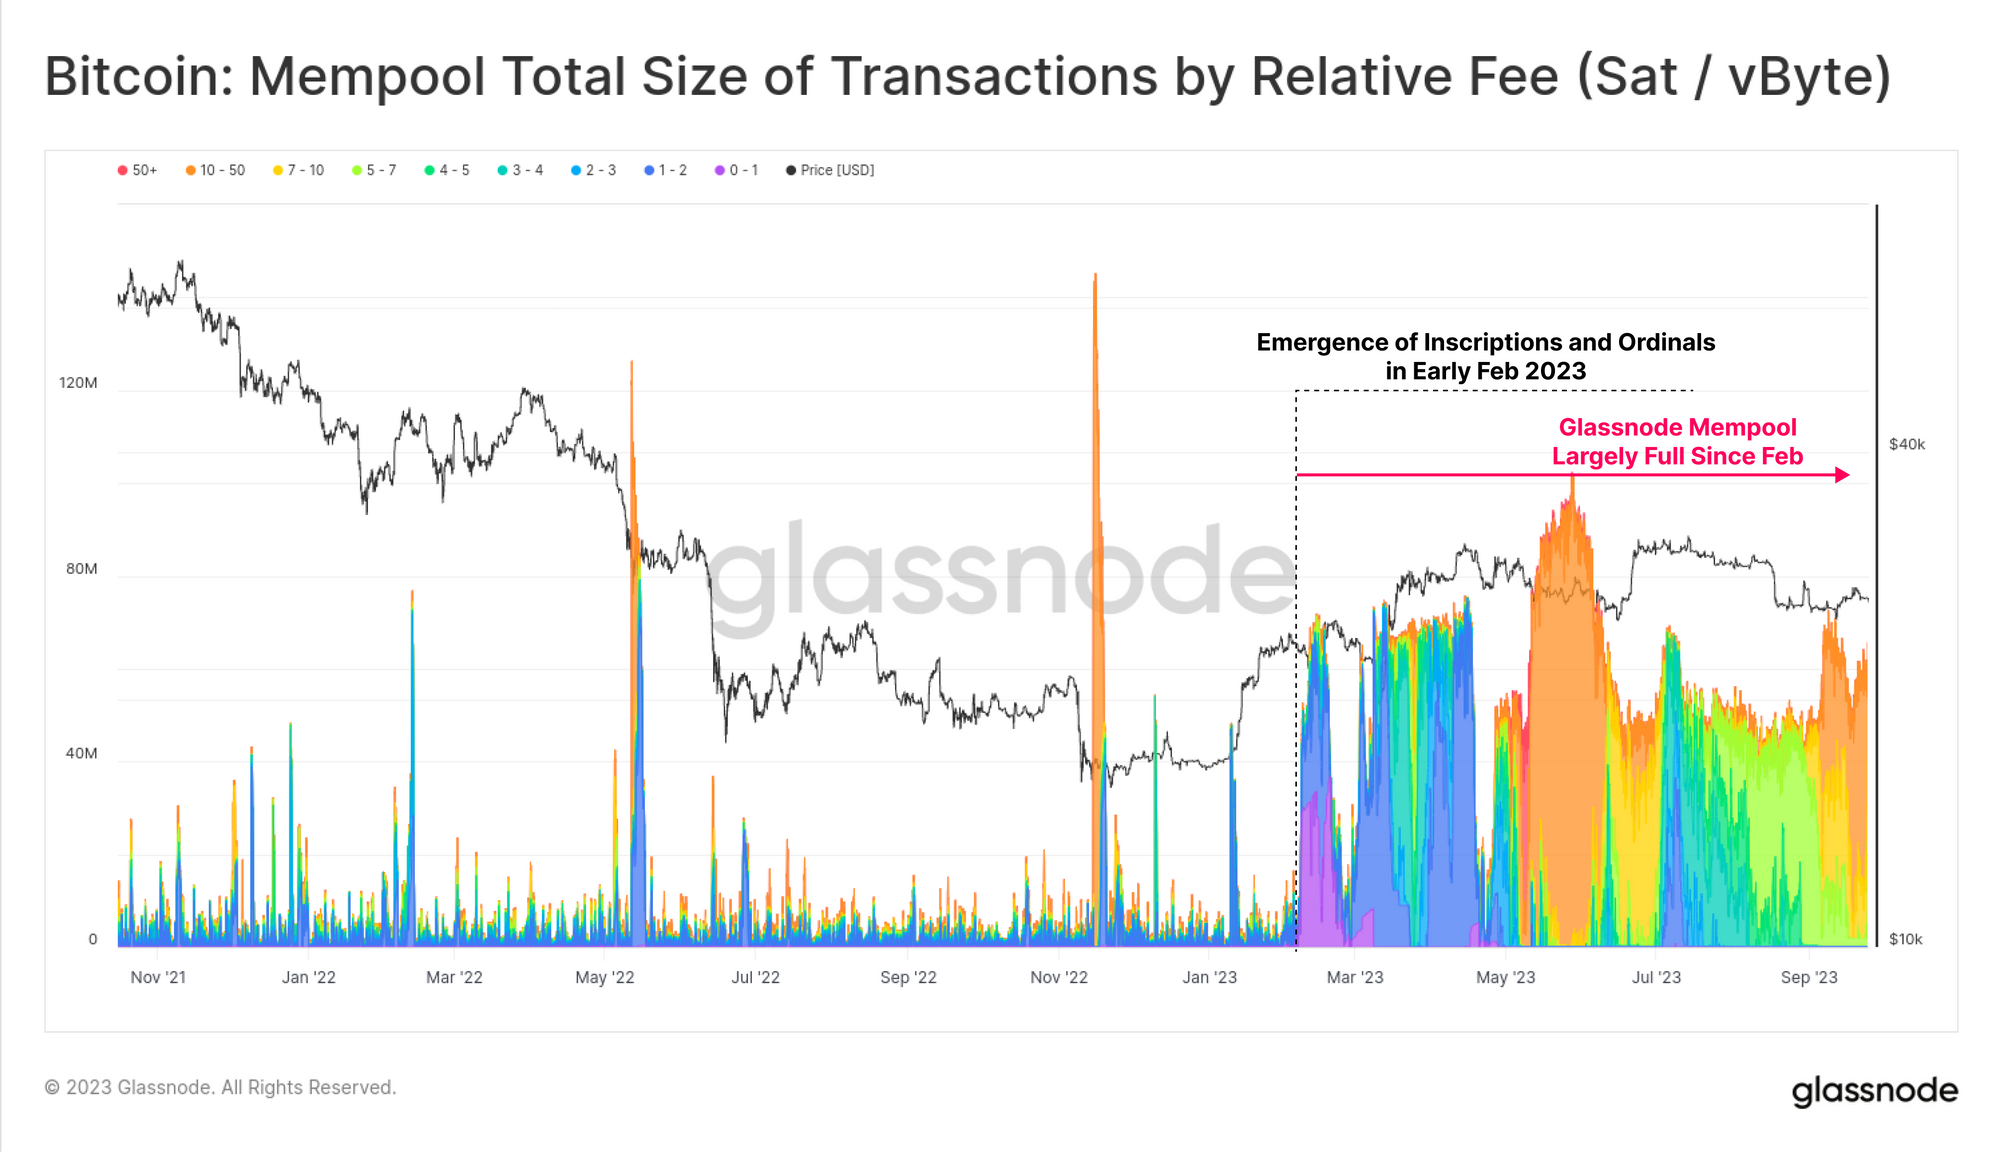
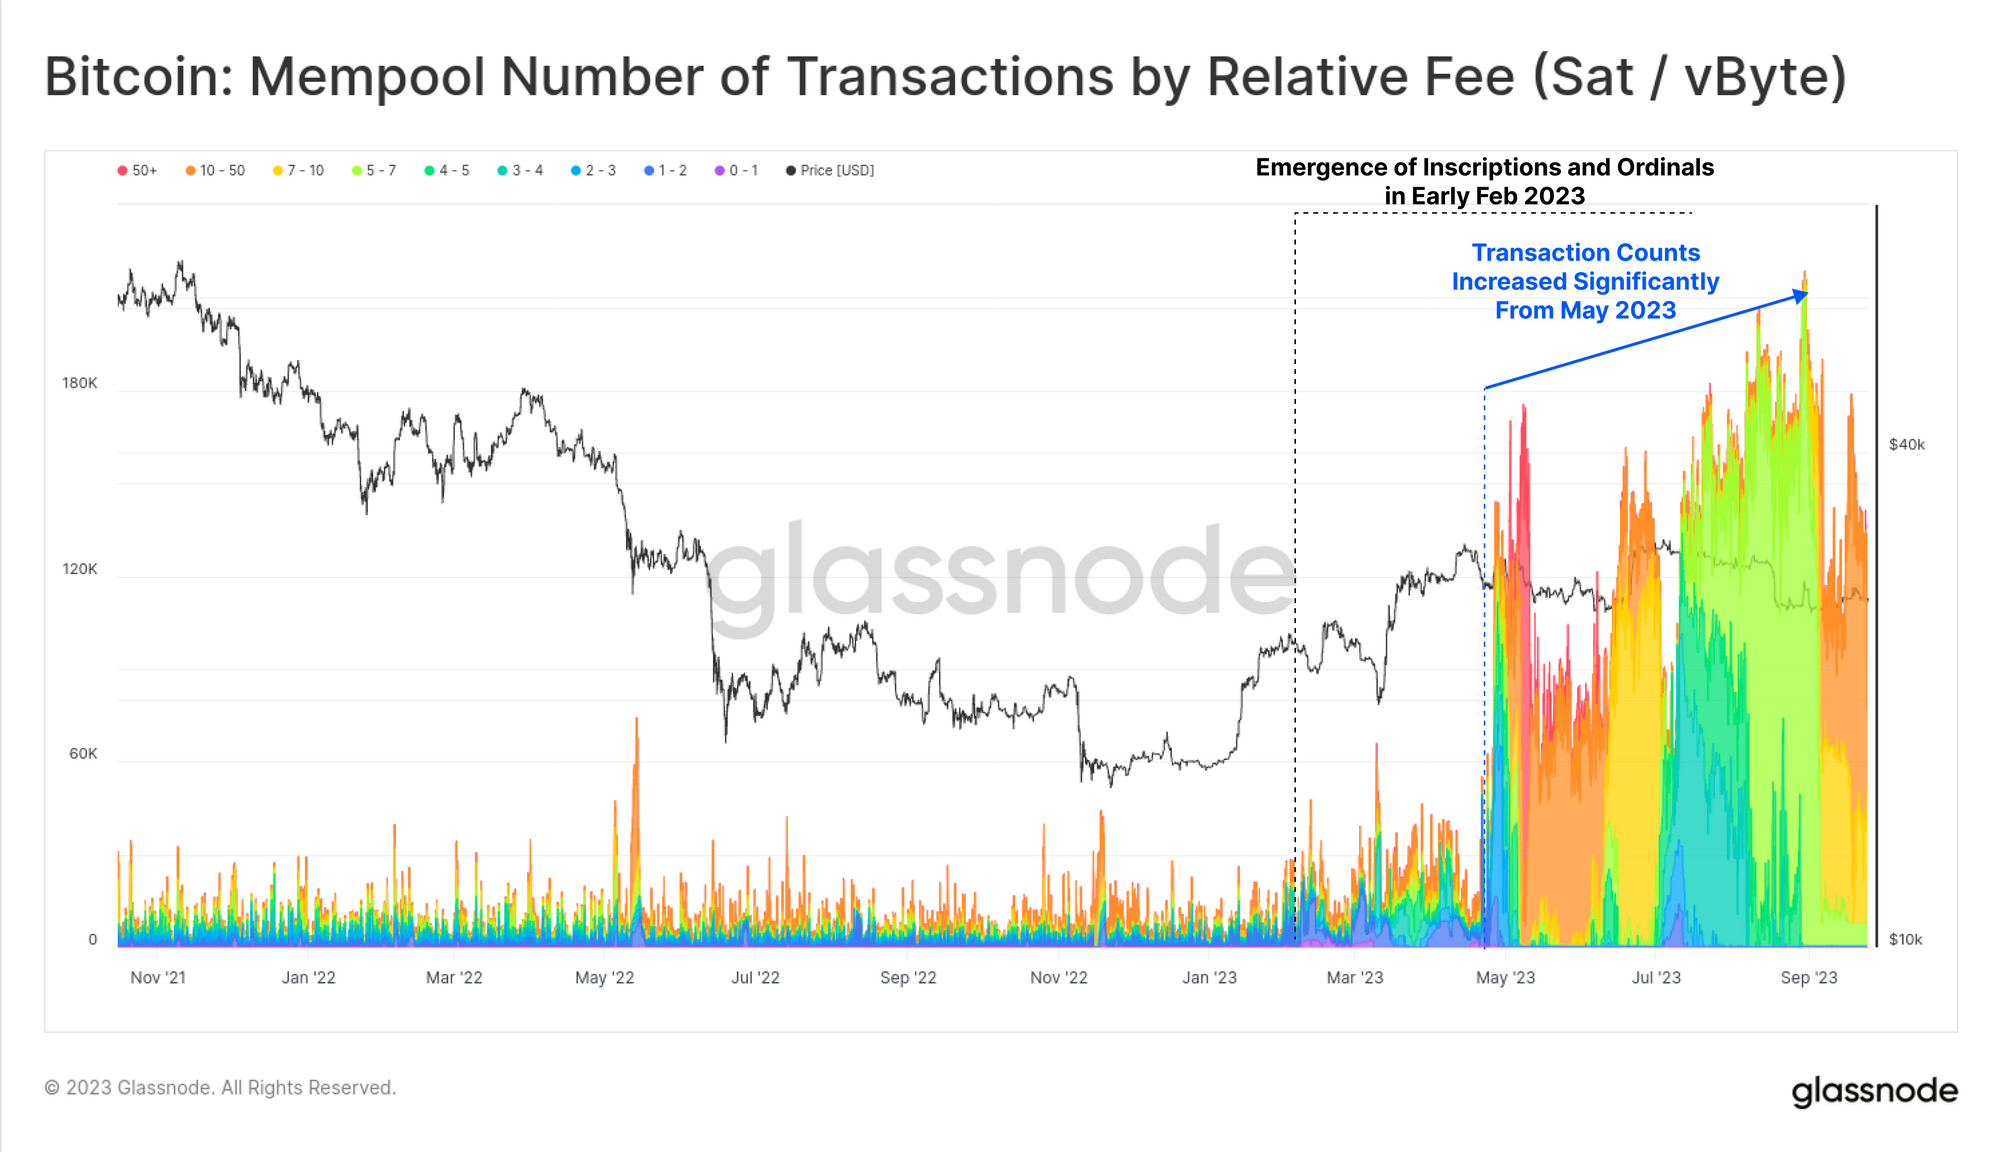
Whilst our mempool has been 'data-full' since February, we can see that the number of pending transactions has actually increased significantly since May. This indicates that a majority of these unconfirmed transactions have a very small data-footprint (more transactions fit within the 300MB capacity of the Glassnode mempool).
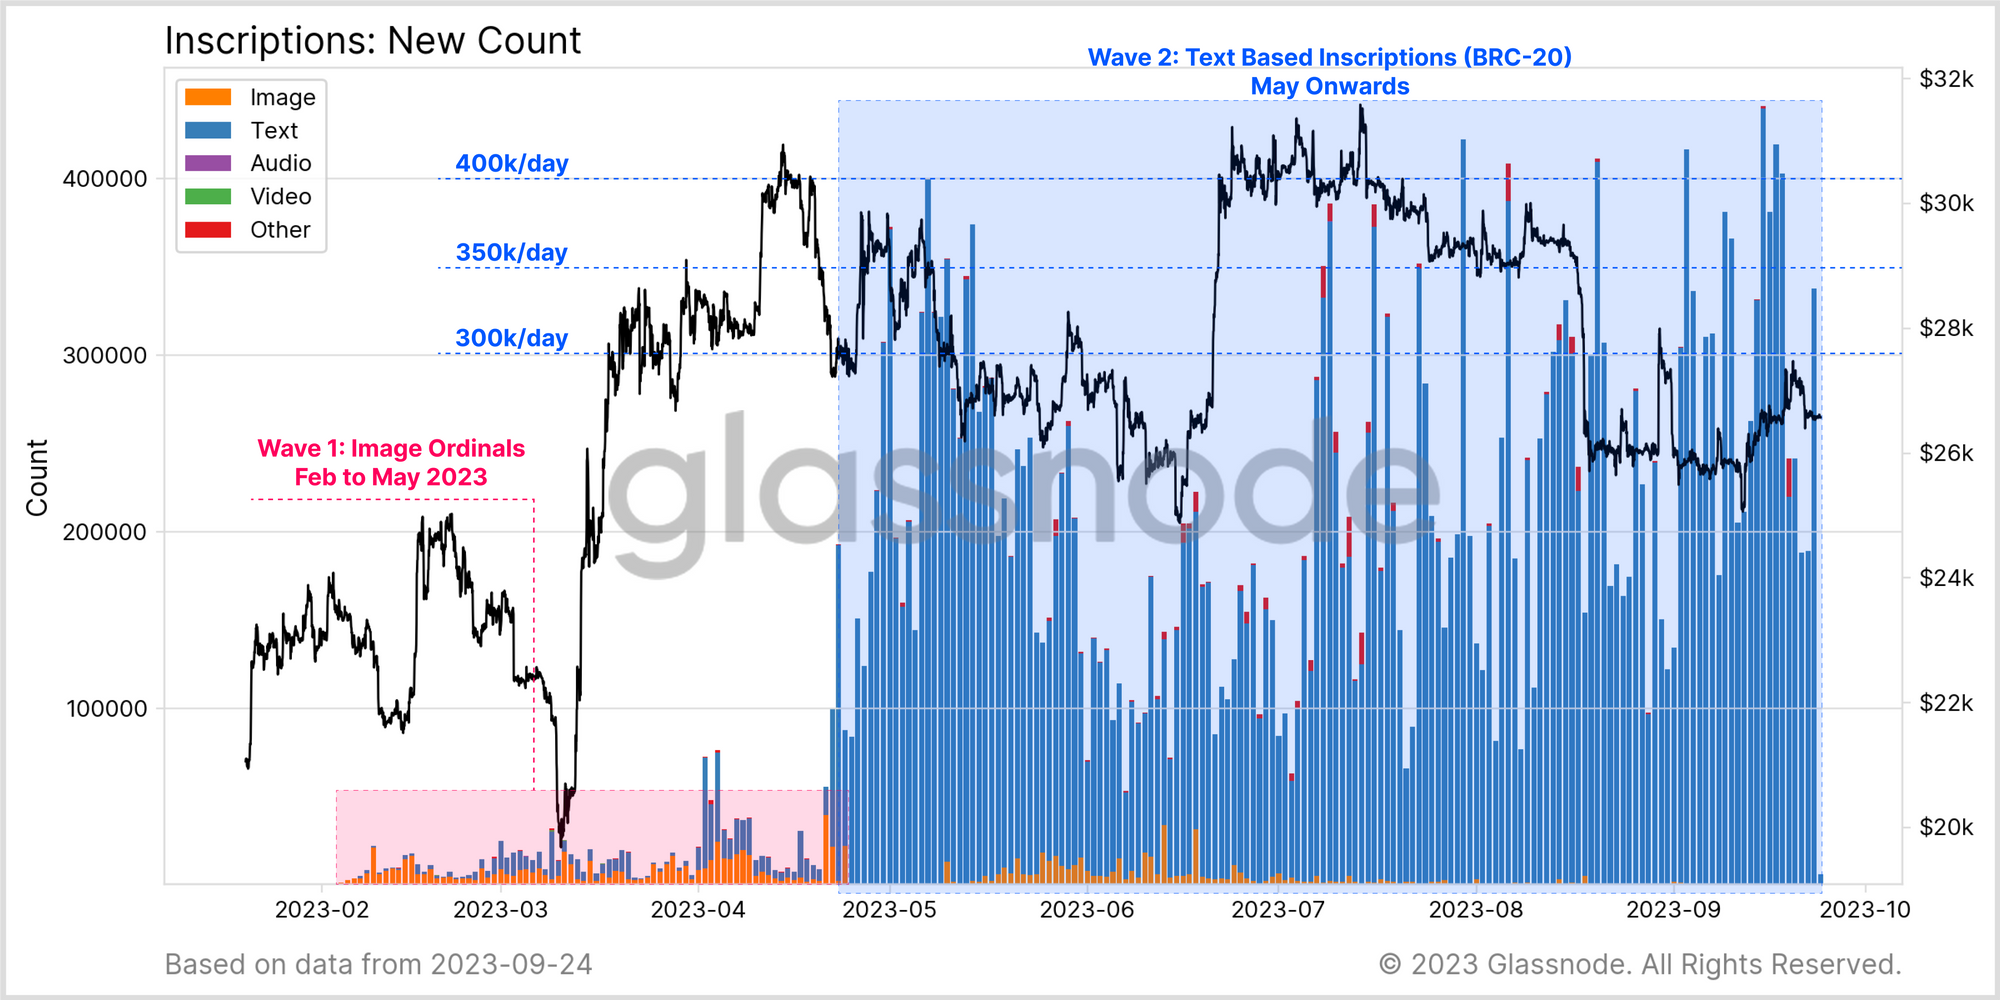
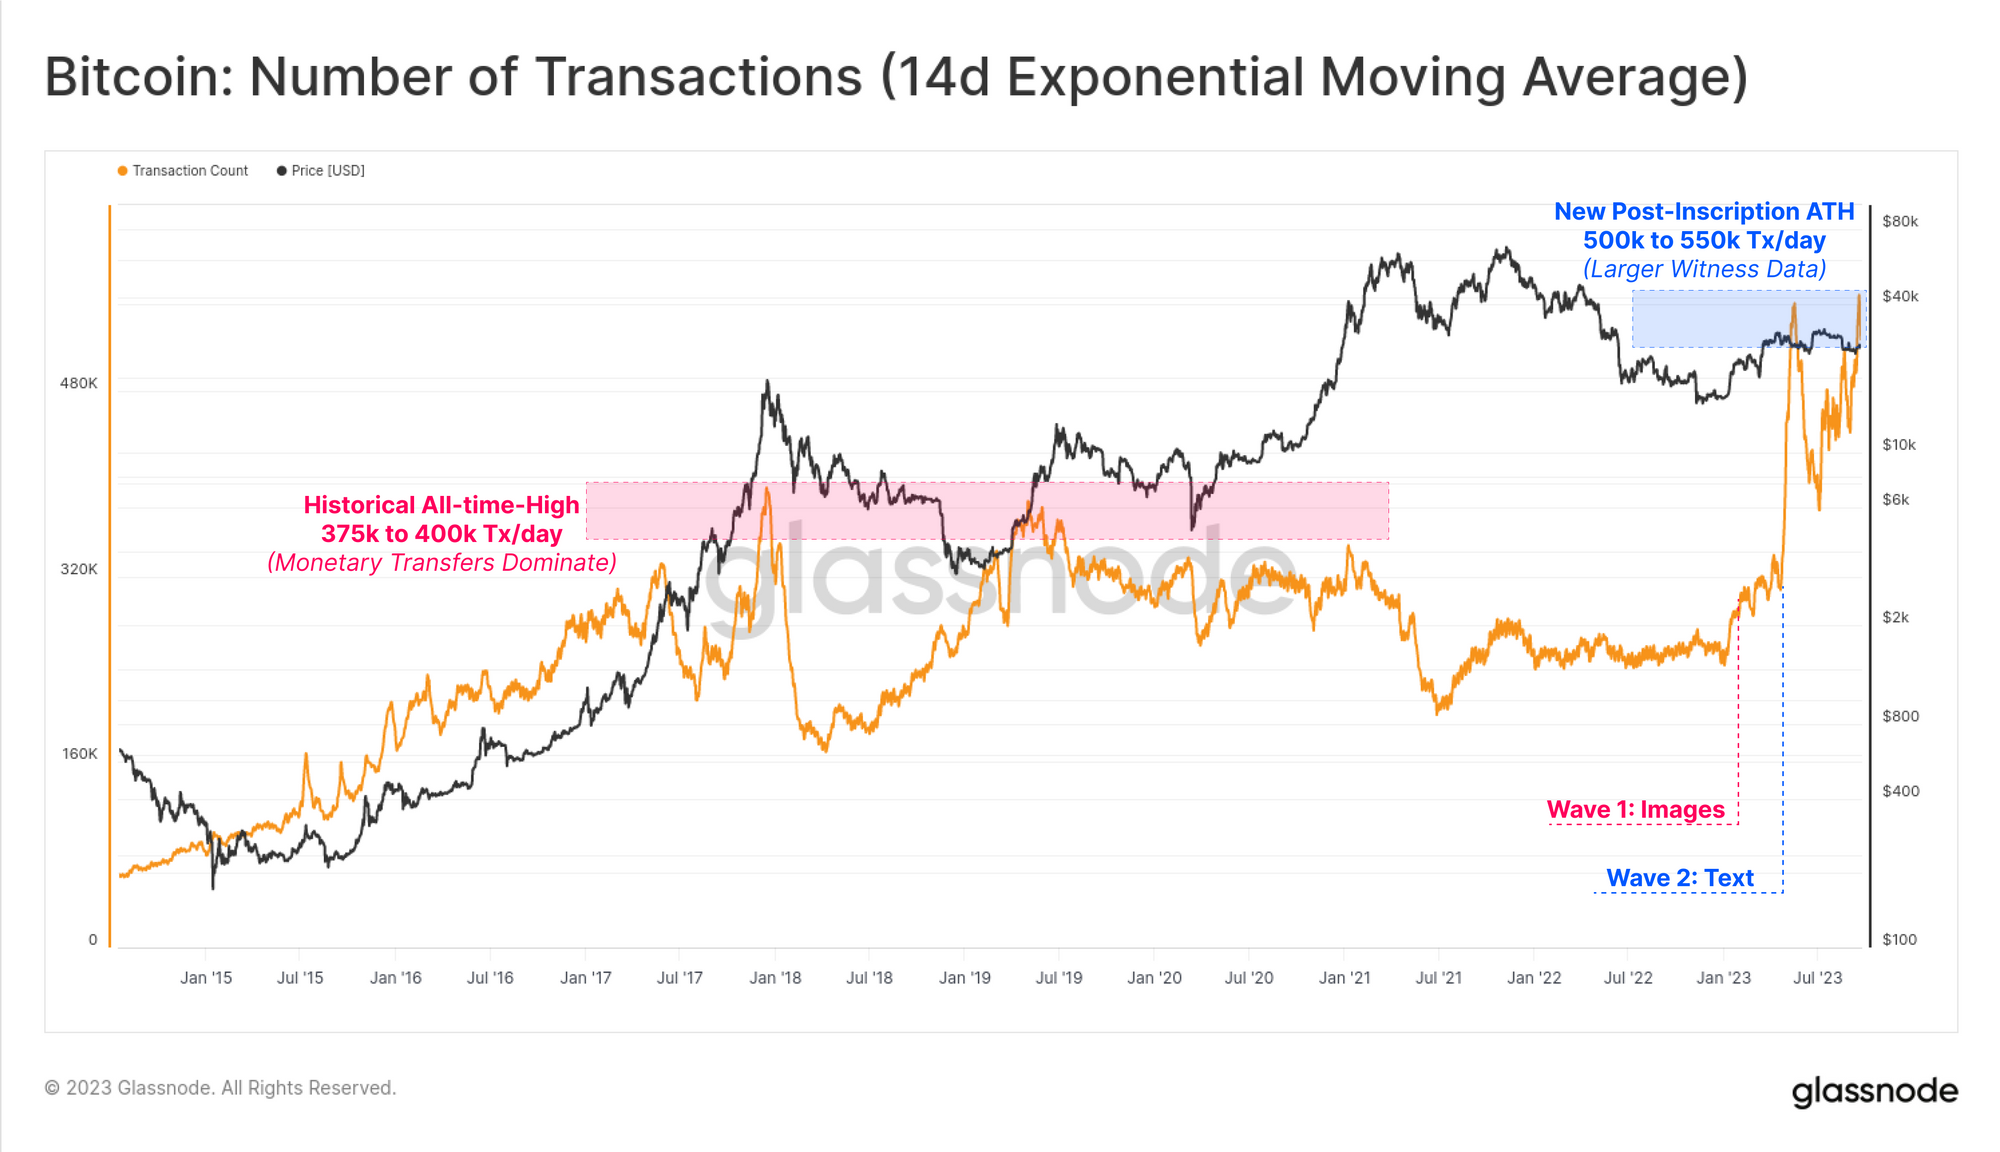
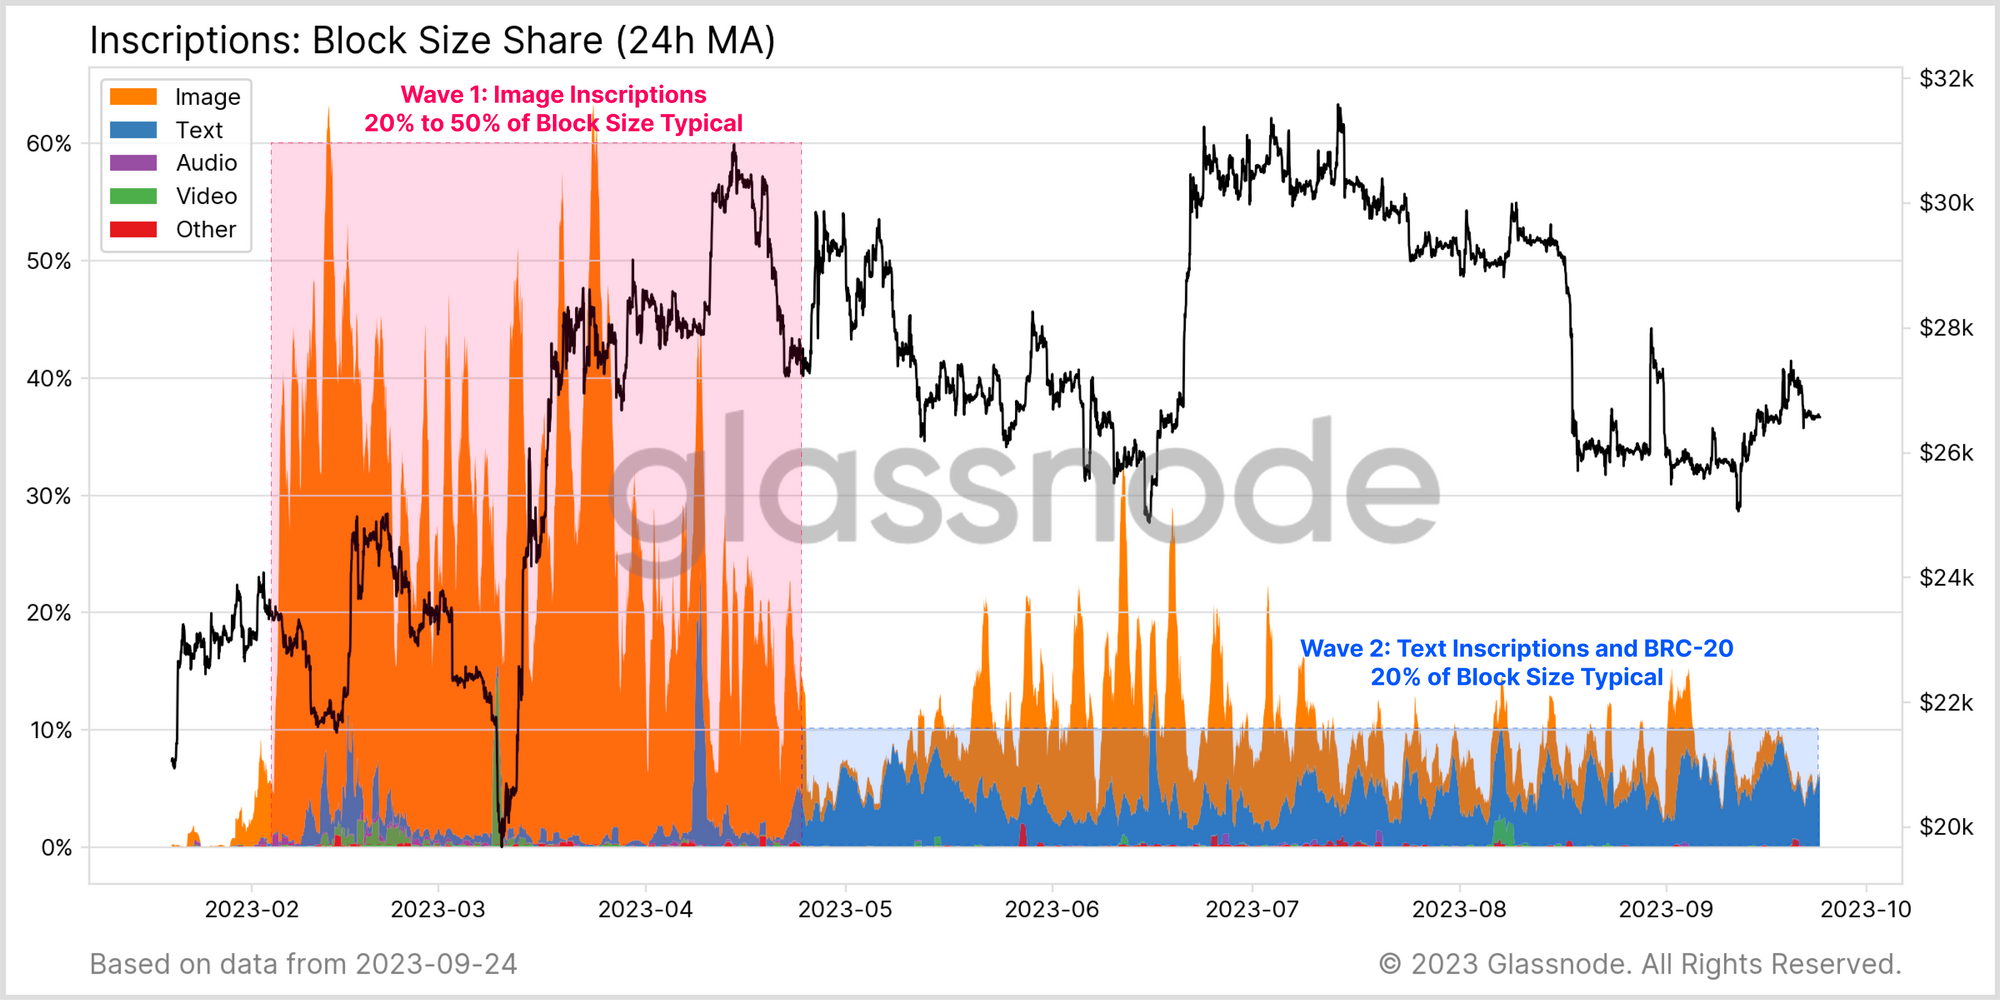
Inscriptions allow Bitcoin users to encode files into the witness portion of the transaction data structure. The chart below shows that there have been two waves of inscriptions thus far:
- 🟠 Wave 1: Images and files, dominated as users used the Ordinal protocol to create Bitcoin native NFTs, and explore the new technology.
- 🔵 Wave 2: Text dominated, as the experimental BRC-20 token emerged using text based JSON files to define asset minting and transfers.
The explosion of text based inscriptions aligns clearly with the uptick in pending transactions within our mempool. This confirms that these small size text inscriptions have become a significant source of demand for blockspace.
Inscriptions take advantage of the split data structure introduced with SegWit, making it possible fit more transactions in the same 4M Wu capped blocksize. Until inscriptions gained popularity, the maximum number of (mainly monetary) transactions which could be fit into a block tended to peak at around 375k to 400k/day, usually hit in bull markets.
2023 however saw and incredible uptick in daily confirmed transaction counts, breaching 550k per day both in May, and again this week.
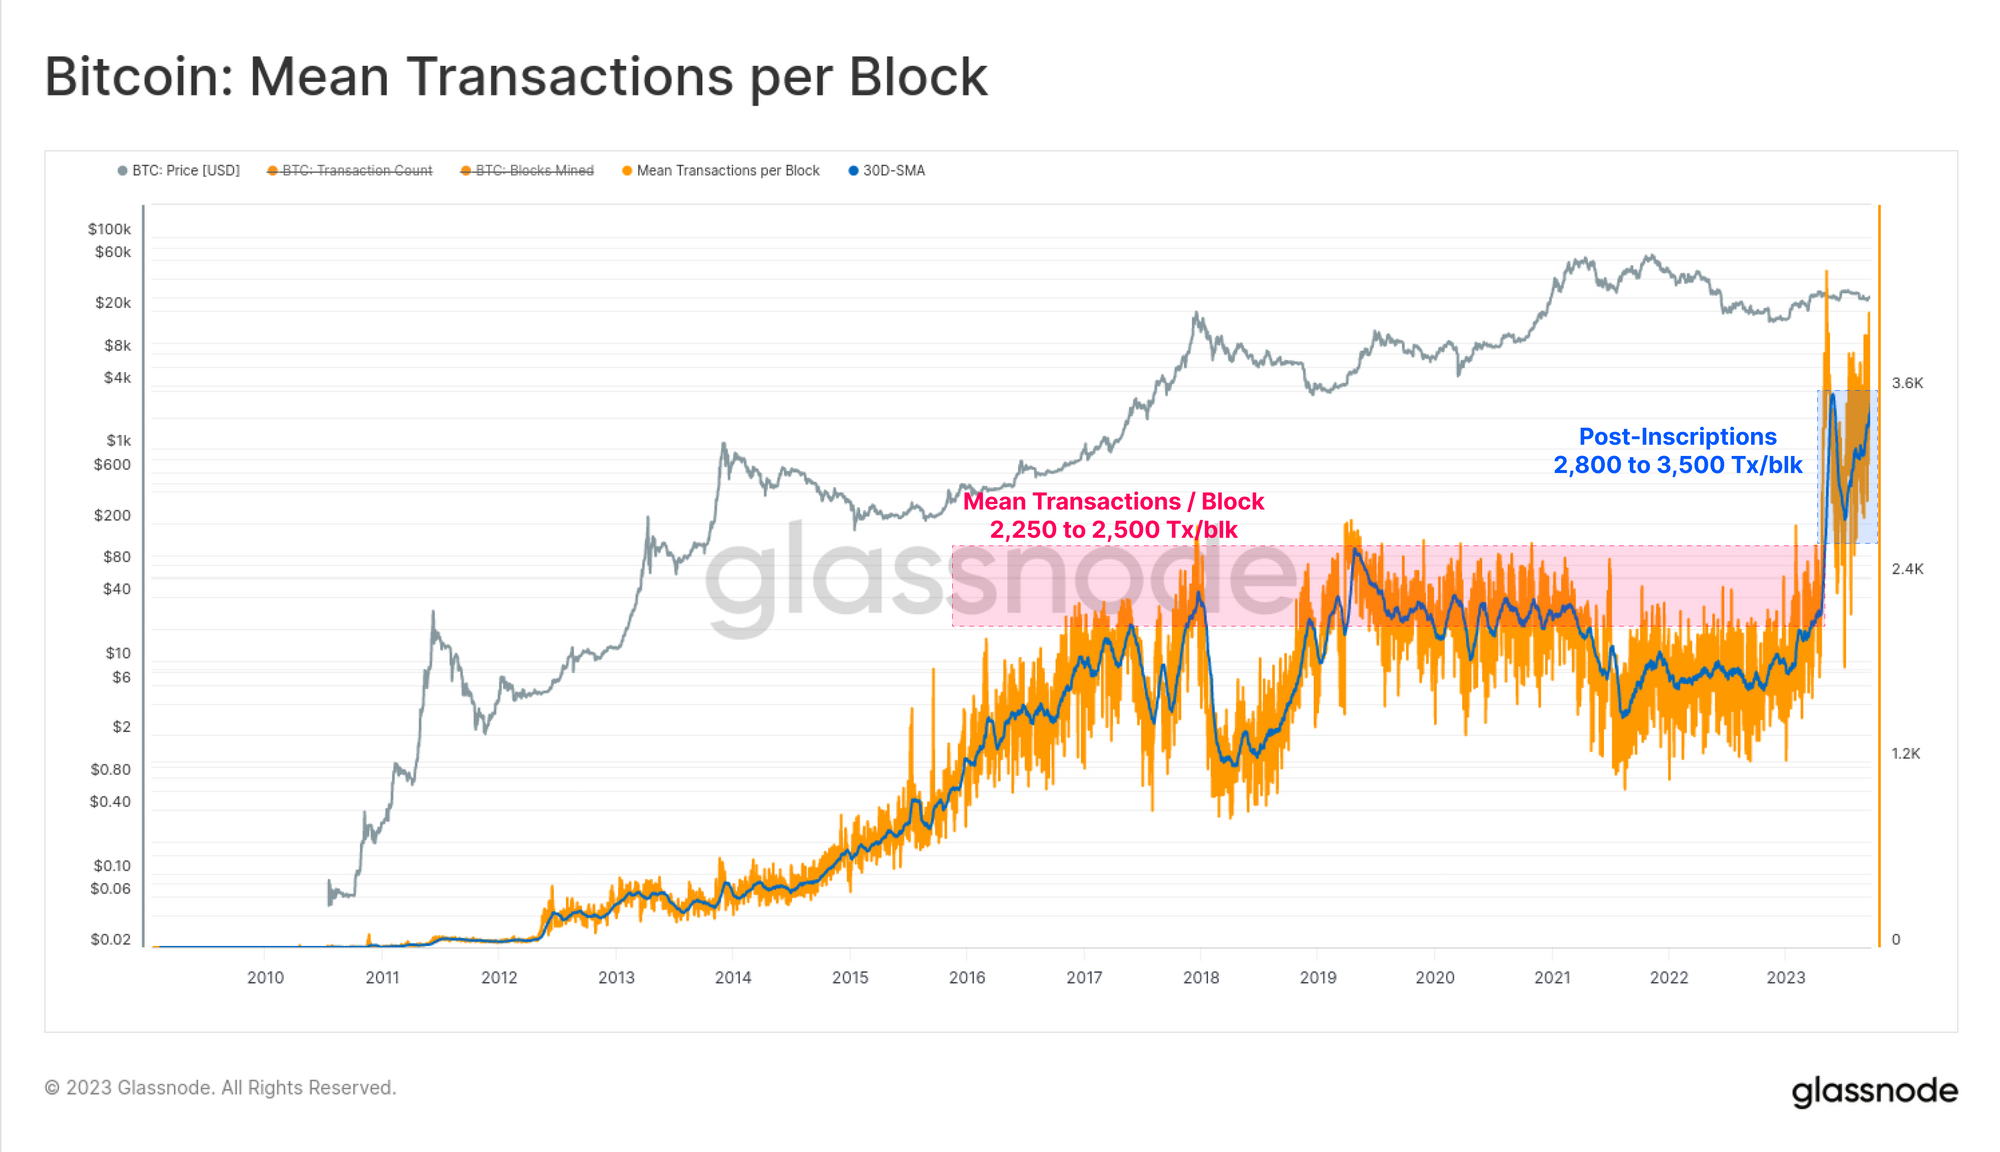
A similar pattern can be seen in the average number of confirmed transactions per block. In prior years where monetary transfers were the primary use of Bitcoin blockspace, full blocks typically contained between 2.25k and 2.50k transactions.
In 2023 however, that ceiling has been taken out, with the additional space available in the witness data allowing for the average block to contain between 2.80k and 3.50k transactions (with daily spikes even reaching over 4.0k per block).
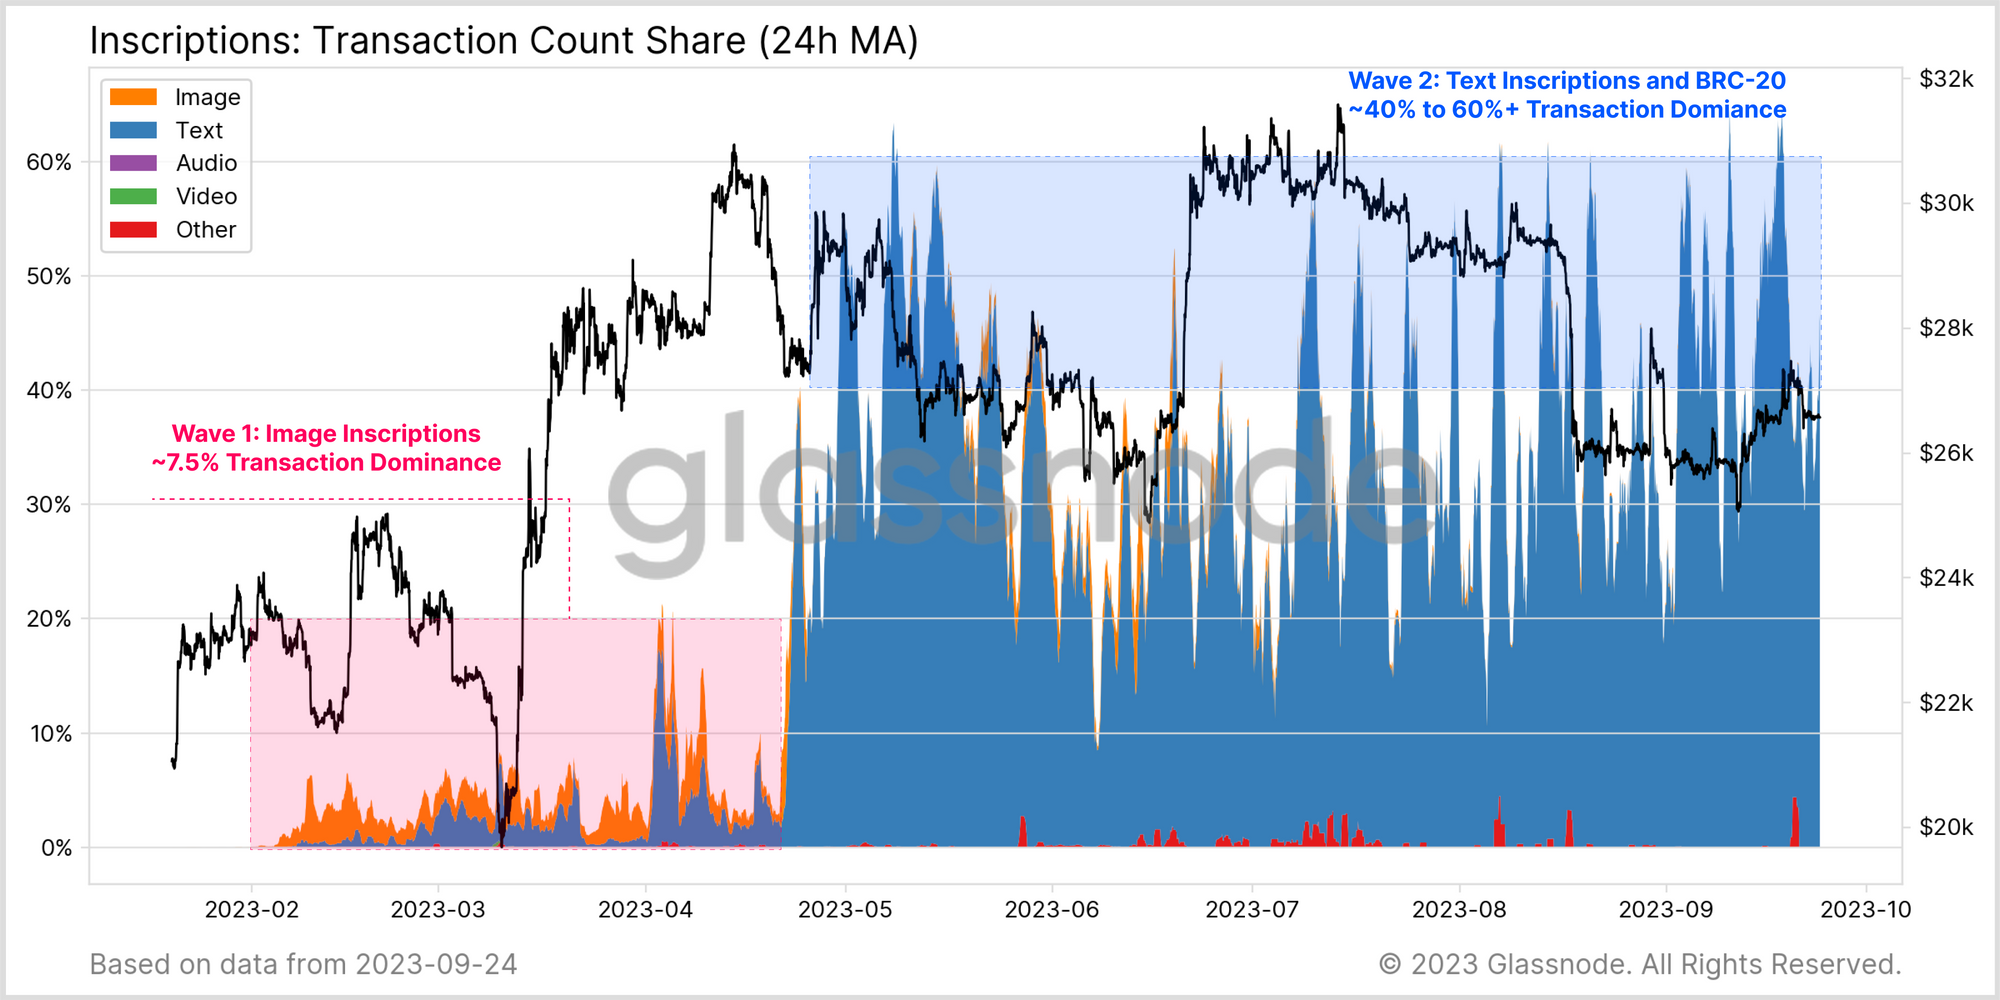
Out of all confined transactions, text based inscriptions account for between 40% and up to 60% of all transactions since May. This dwarfs the first wave of image dominant inscriptions which typically represented just 7.5% of all transactions.
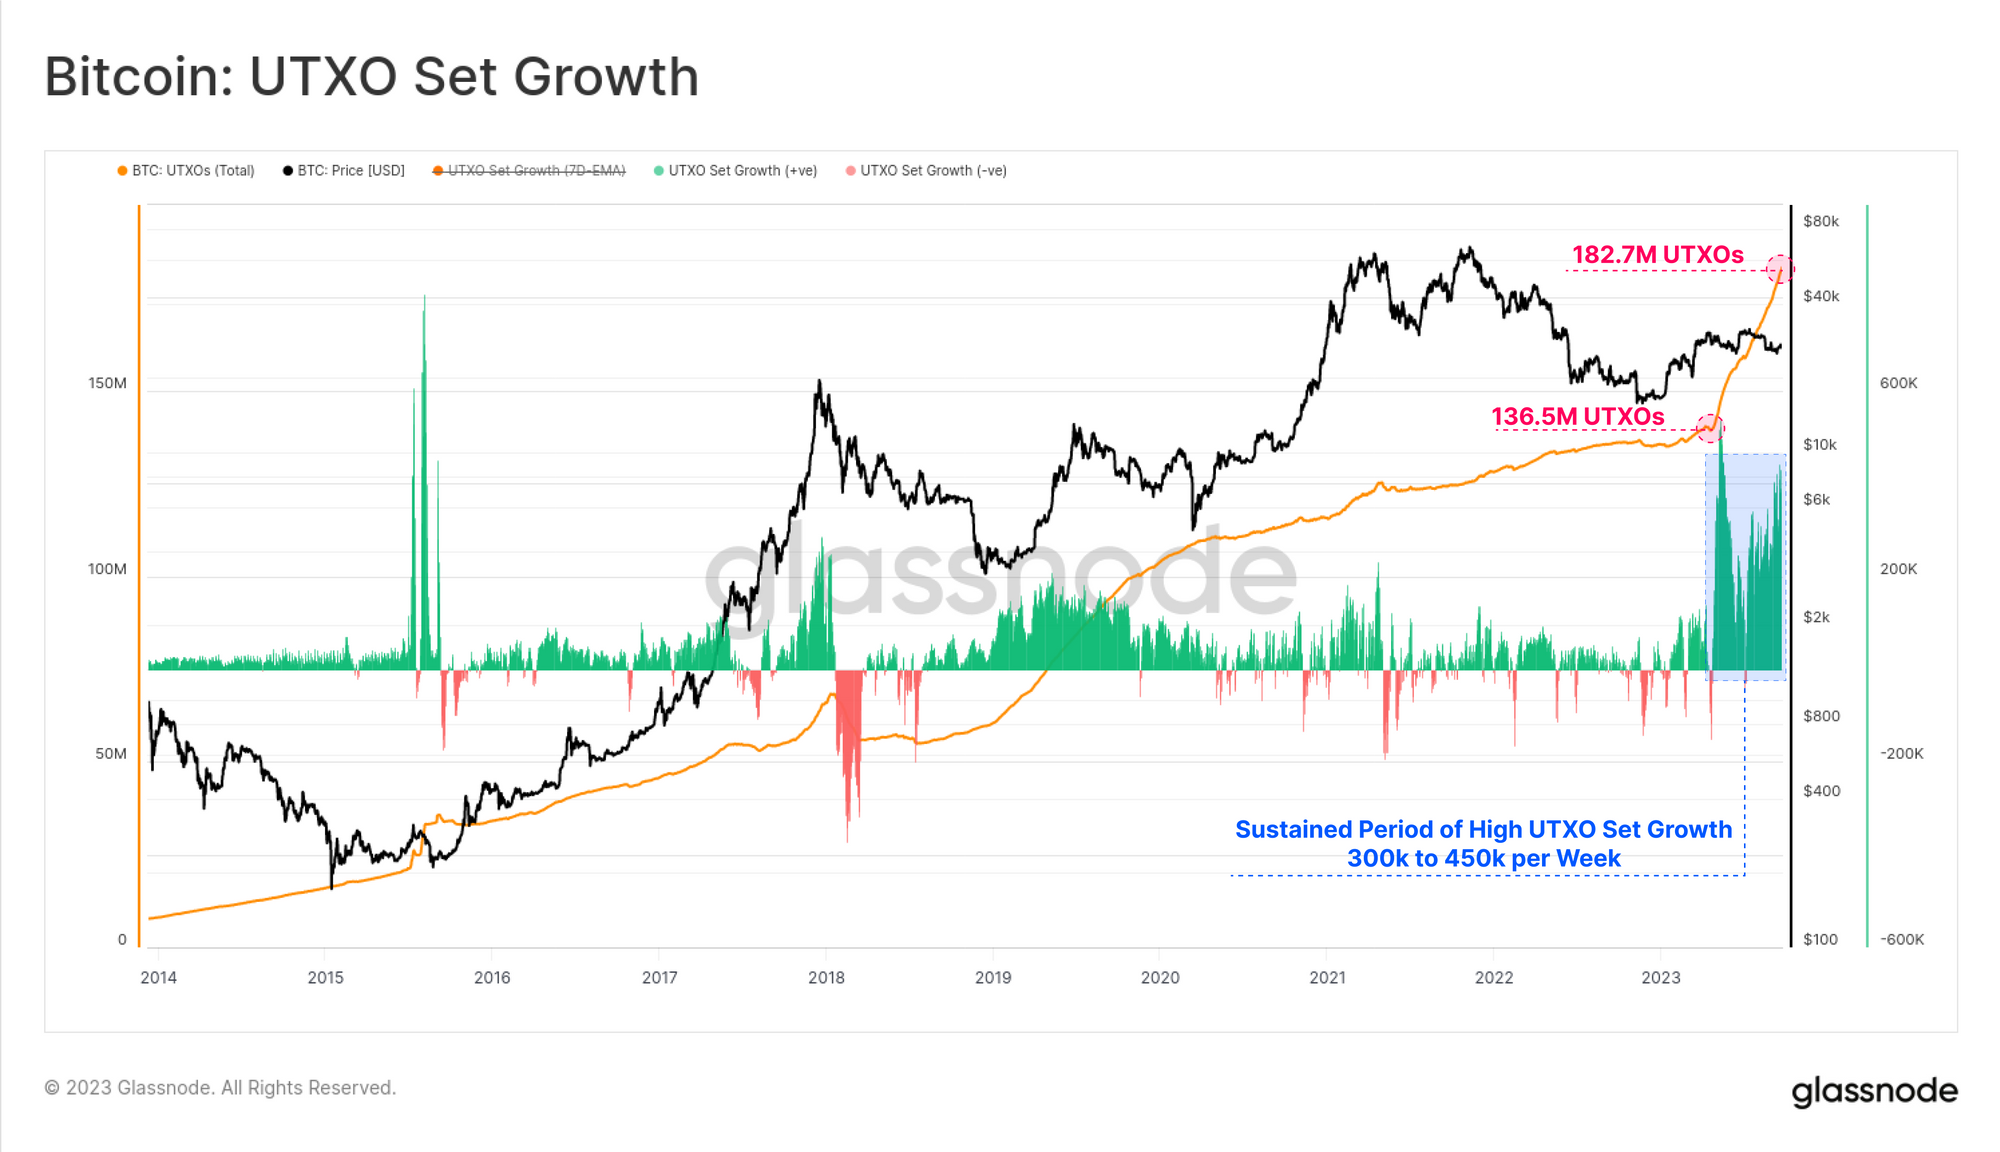
One notable impact of inscriptions is a rapidly expanding UTXO set. Since February, the total number of UTXOs in the set has increased by +46.2M (+33.8%). This is the largest rate of weekly increase in history, sustaining levels between 300k to 450k UTXOs/wk for the over six months.
Of note is the BRC-20 token called SATS, which was launched in March, but only finished minting out this week. This token alone is responsible for at least 21M new UTXOs, around 45.5% of the increase. It remains to be seen whether mempools start to clear now that this multi-month token mint has completed.
Inscriptions Are Buyers of Last Resort
The percent of blockspace consumed by Image vs Text based inscriptions is almost the exact inverse of the share of transactions. The first wave of Image inscriptions routinely consumed a fairly large 40%+ of the available blockspace. The second wave of text inscriptions and BRC-20 tokens on the other hand has consumed a relatively stable 20% or less, reflecting their smaller data footprint.
This is quite an interesting observation, as it suggests that these text based inscriptions are acting somewhat like 'filler' for blocks.
By way of analogy, think about a Bitcoin block as a moving crate:
- Monetary transfers and Image inscriptions represent the the contents of the crate and are fewer in number, but consume the majority of the crate volume and value.
- Text inscriptions on the other hand represent a soft newspaper packing which can be stuffed into any remaining space, but on the whole consumes relatively little volume and value.
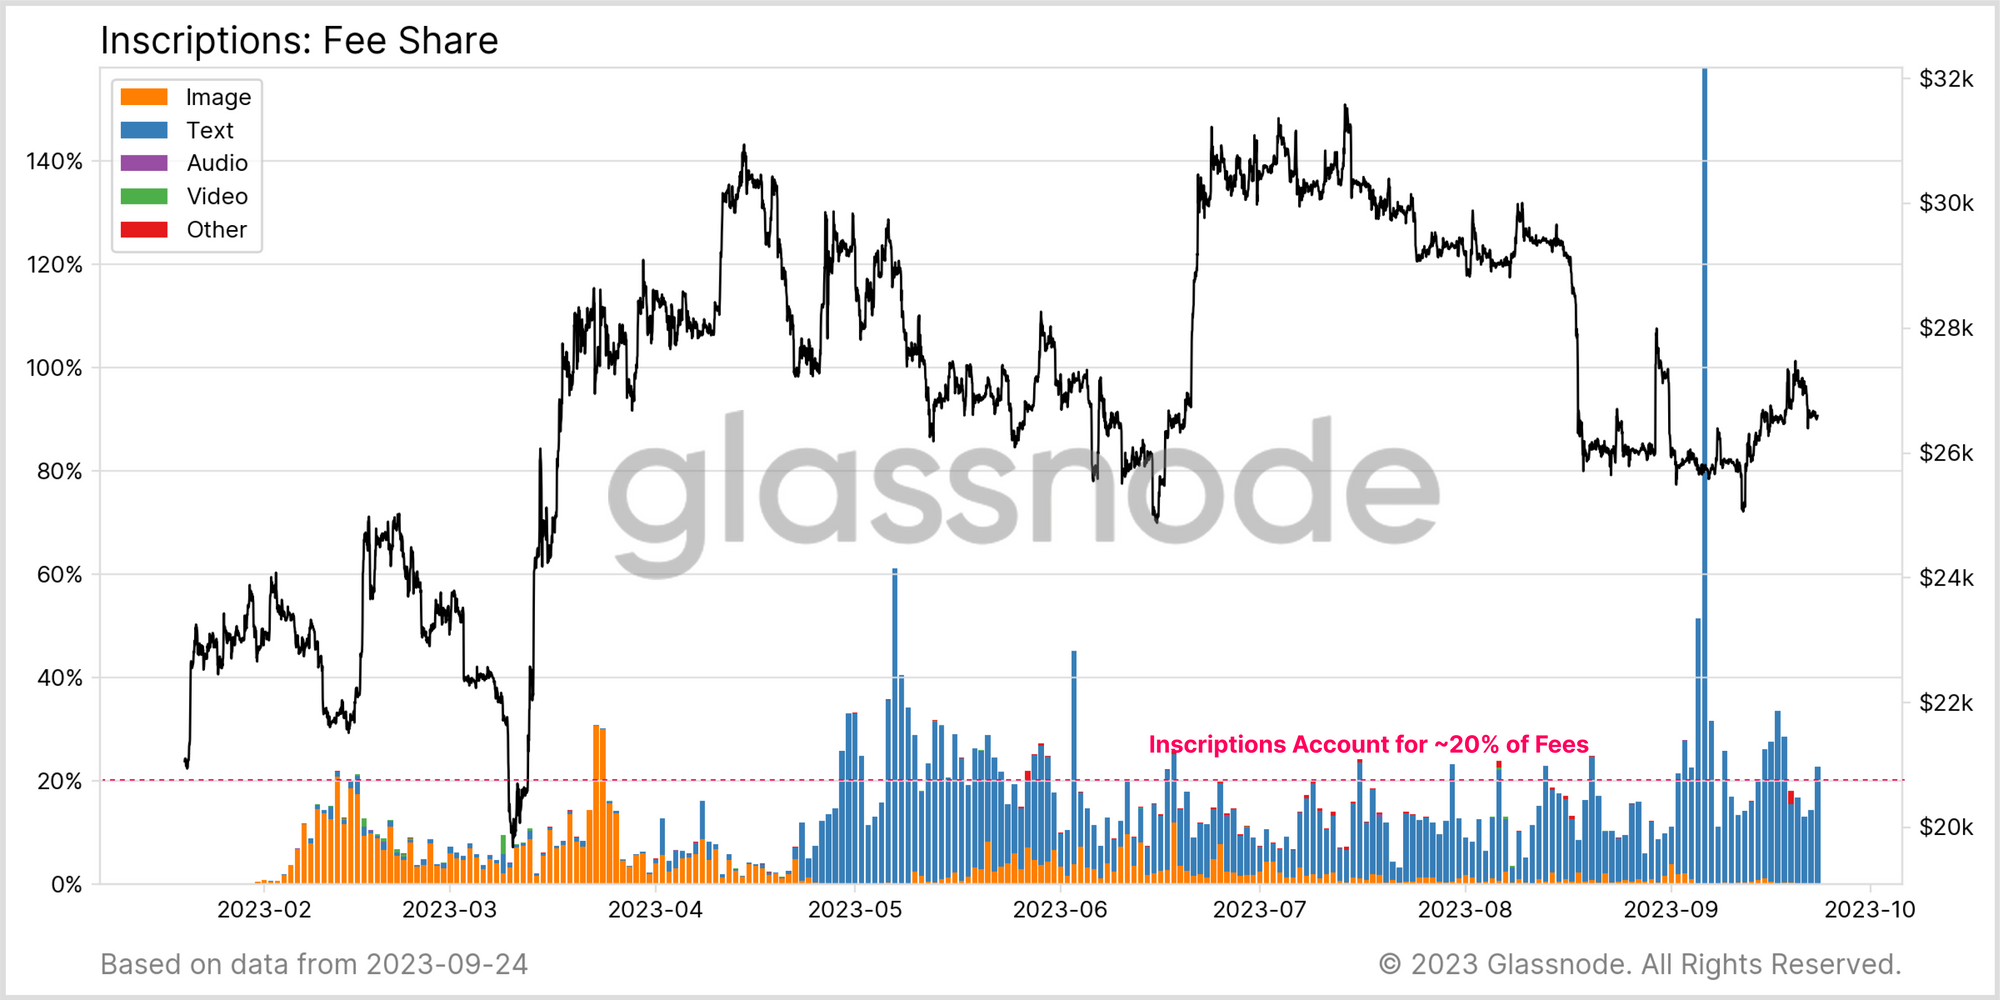
This analogy is further reinforced by the share of fees paid by Inscriptions. Here we can see that both waves hit a ceiling of around 20% of transaction fees being attributed to inscriptions.
Since Bitcoin transaction fees are paid on a per-data basis (fee per byte), inscriptions tend to be relatively sensitive to the size of the absolute fee. As such, inscription users have tended to set relatively low fee rates, expressing a willingness to wait longer periods of time for confirmation.
Inscriptions appear to be buying and consuming the cheapest available blockspace, and are readily displaced by more urgent monetary transfers.
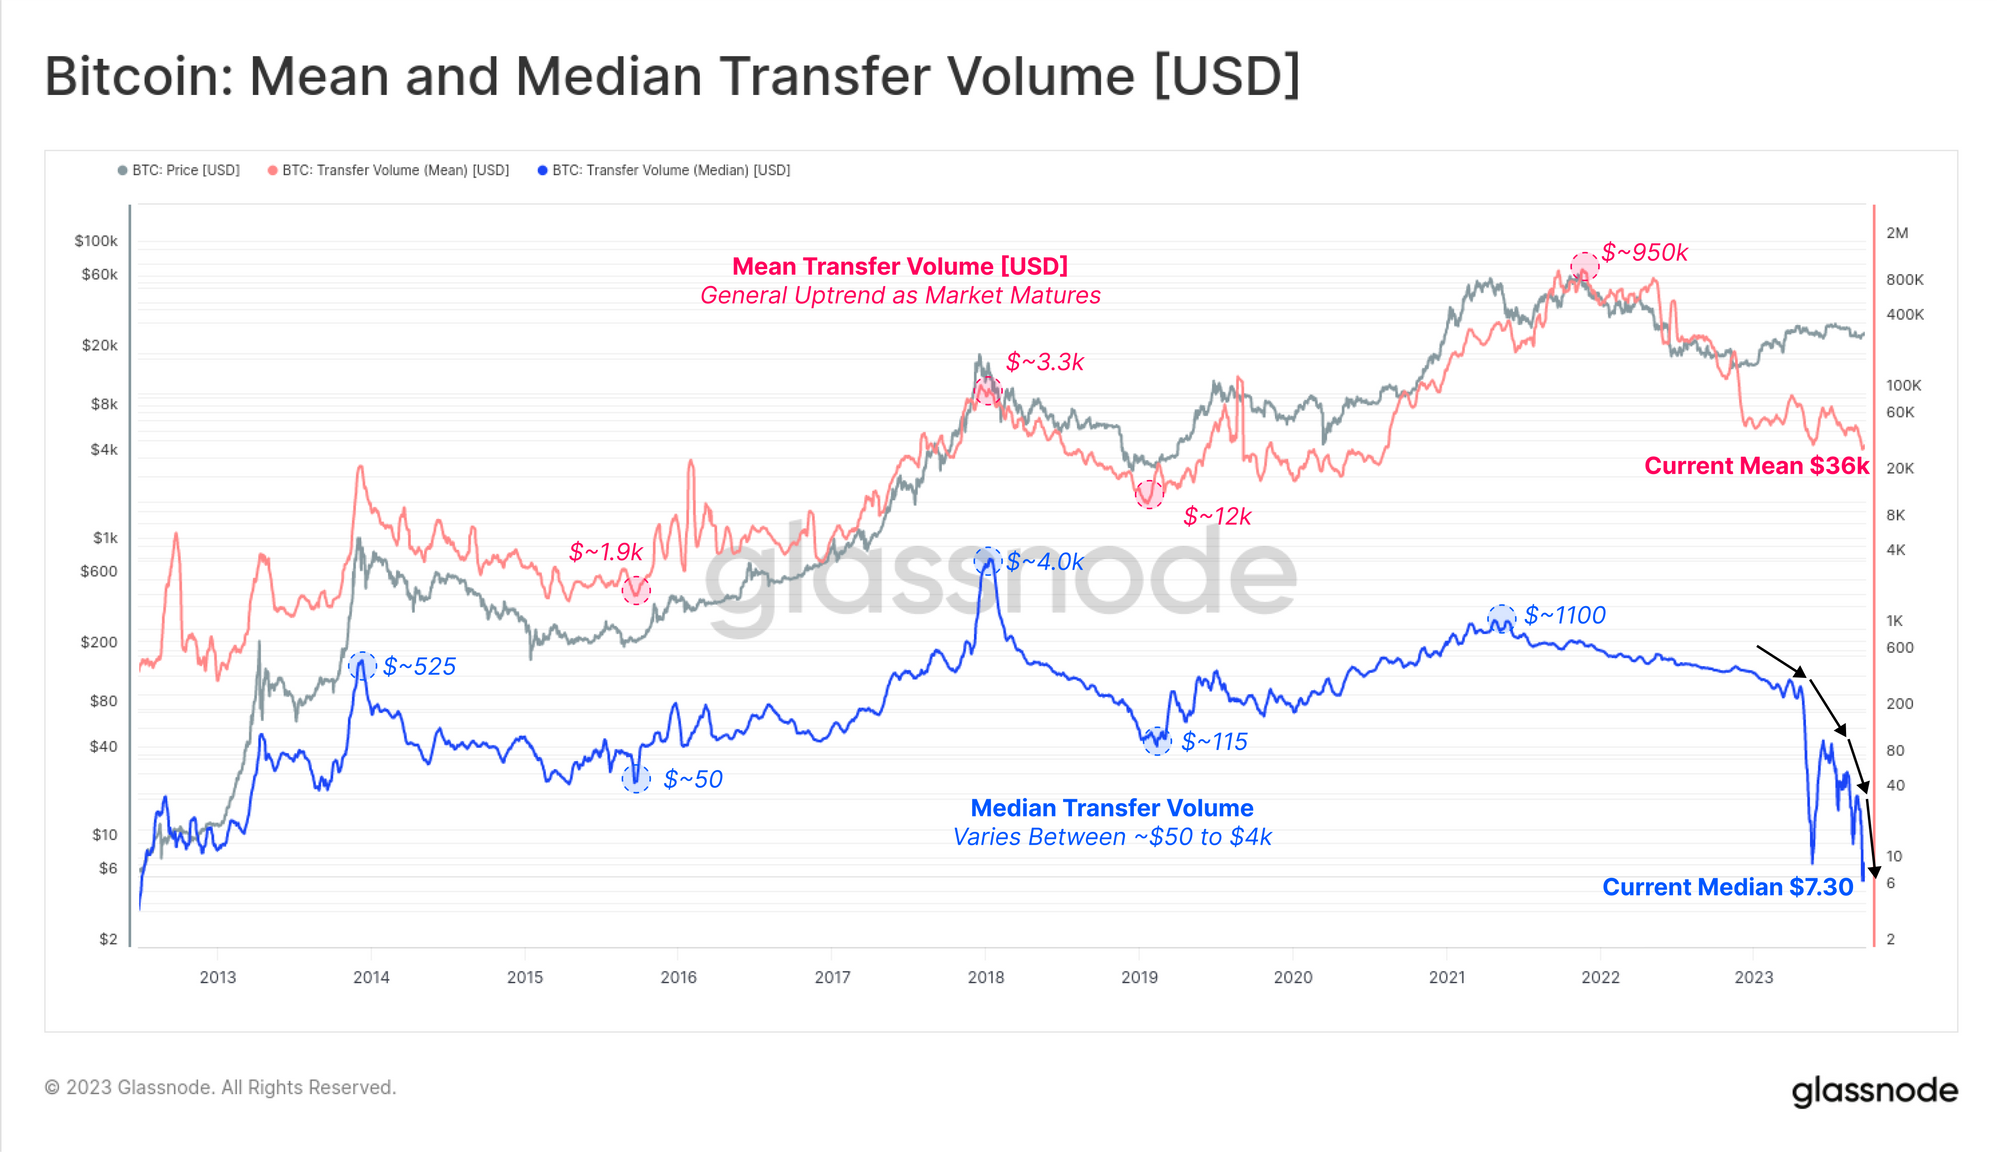
We can see this by comparing the Mean and Median transfer volumes:
- 🔴 Mean Transfer Volumes are more representative of monetary transfers. We can see that the average tends to follow bull and bear cycles, with consistently higher peaks and troughs over time (currently at $36k).
- 🔵 Median Transfer Volumes are more representative of smaller investors (historically) and in more recent times, inscriptions (in 2023).
Note how the median transfer volume have waterfall collapsed to just $7.30 this year. This is a direct result of inscriptions becoming a dominant transaction type, which are numerous (hence affecting ther median), and transported on a very small BTC volume of just a few hundred to thousand sats (usually less than 0.0001000 BTC ~ $2.60) .
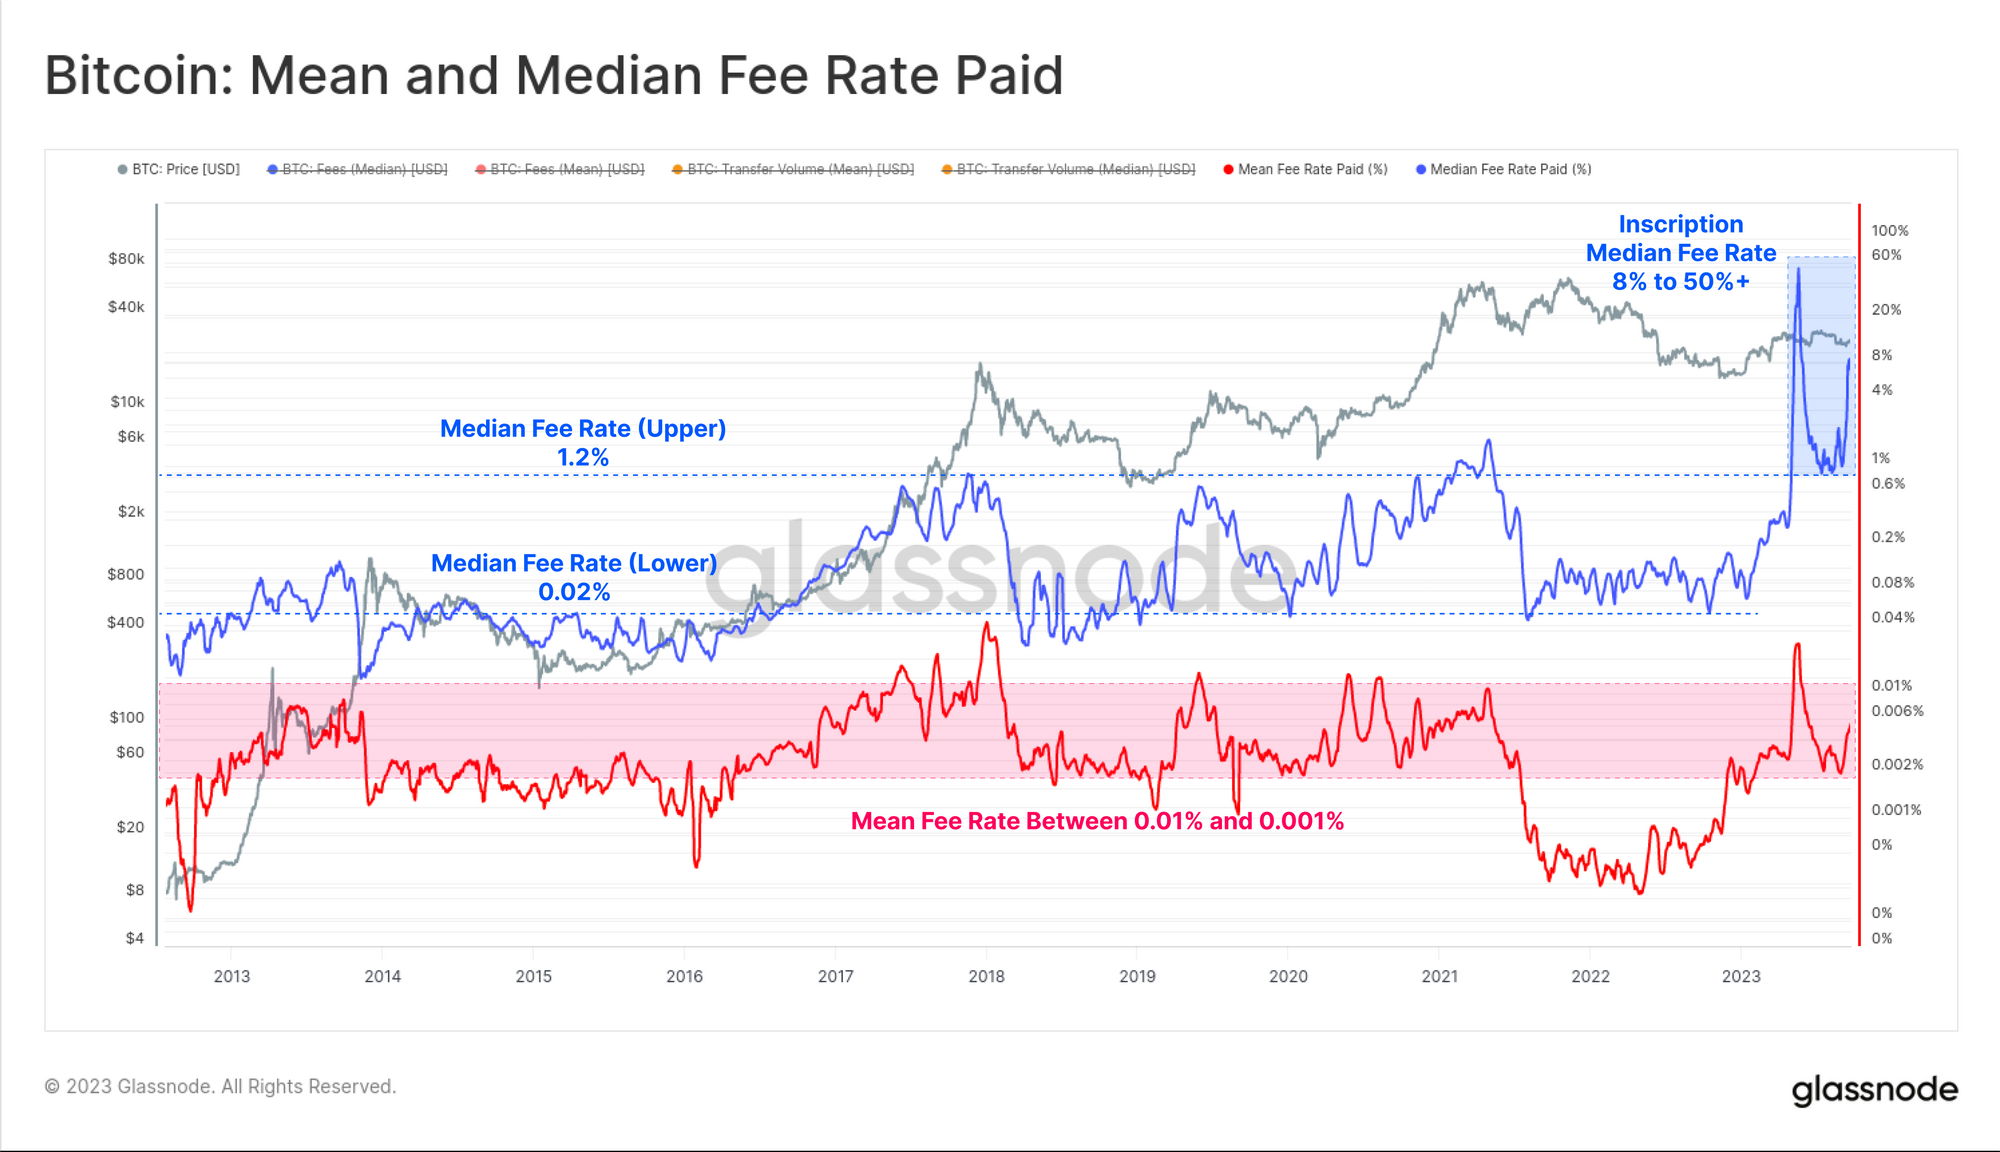
We can also see this dynamic through the lens of Fee Paid per Unit Transferred. The average transaction fee is typically between 0.001% and 0.01% of the volume spent, which is an intuitive and expected result.
For Median fee rates however, we see that high urgency transactions have been willing to pay up to 1.2% fees during bull market peaks, as the market entered a state of euphoria. In 2023, we have seen this translate across to inscriptions, where fees as high as 10% and even over 50%+ of the value transferred becoming increasingly common.
This reflects a willingness to pay a priority fee based on the perceived value of the inscription, and less so relative to the small ~10k sats in value which is transferred.
Do Inscriptions Impact Miner Incomes?
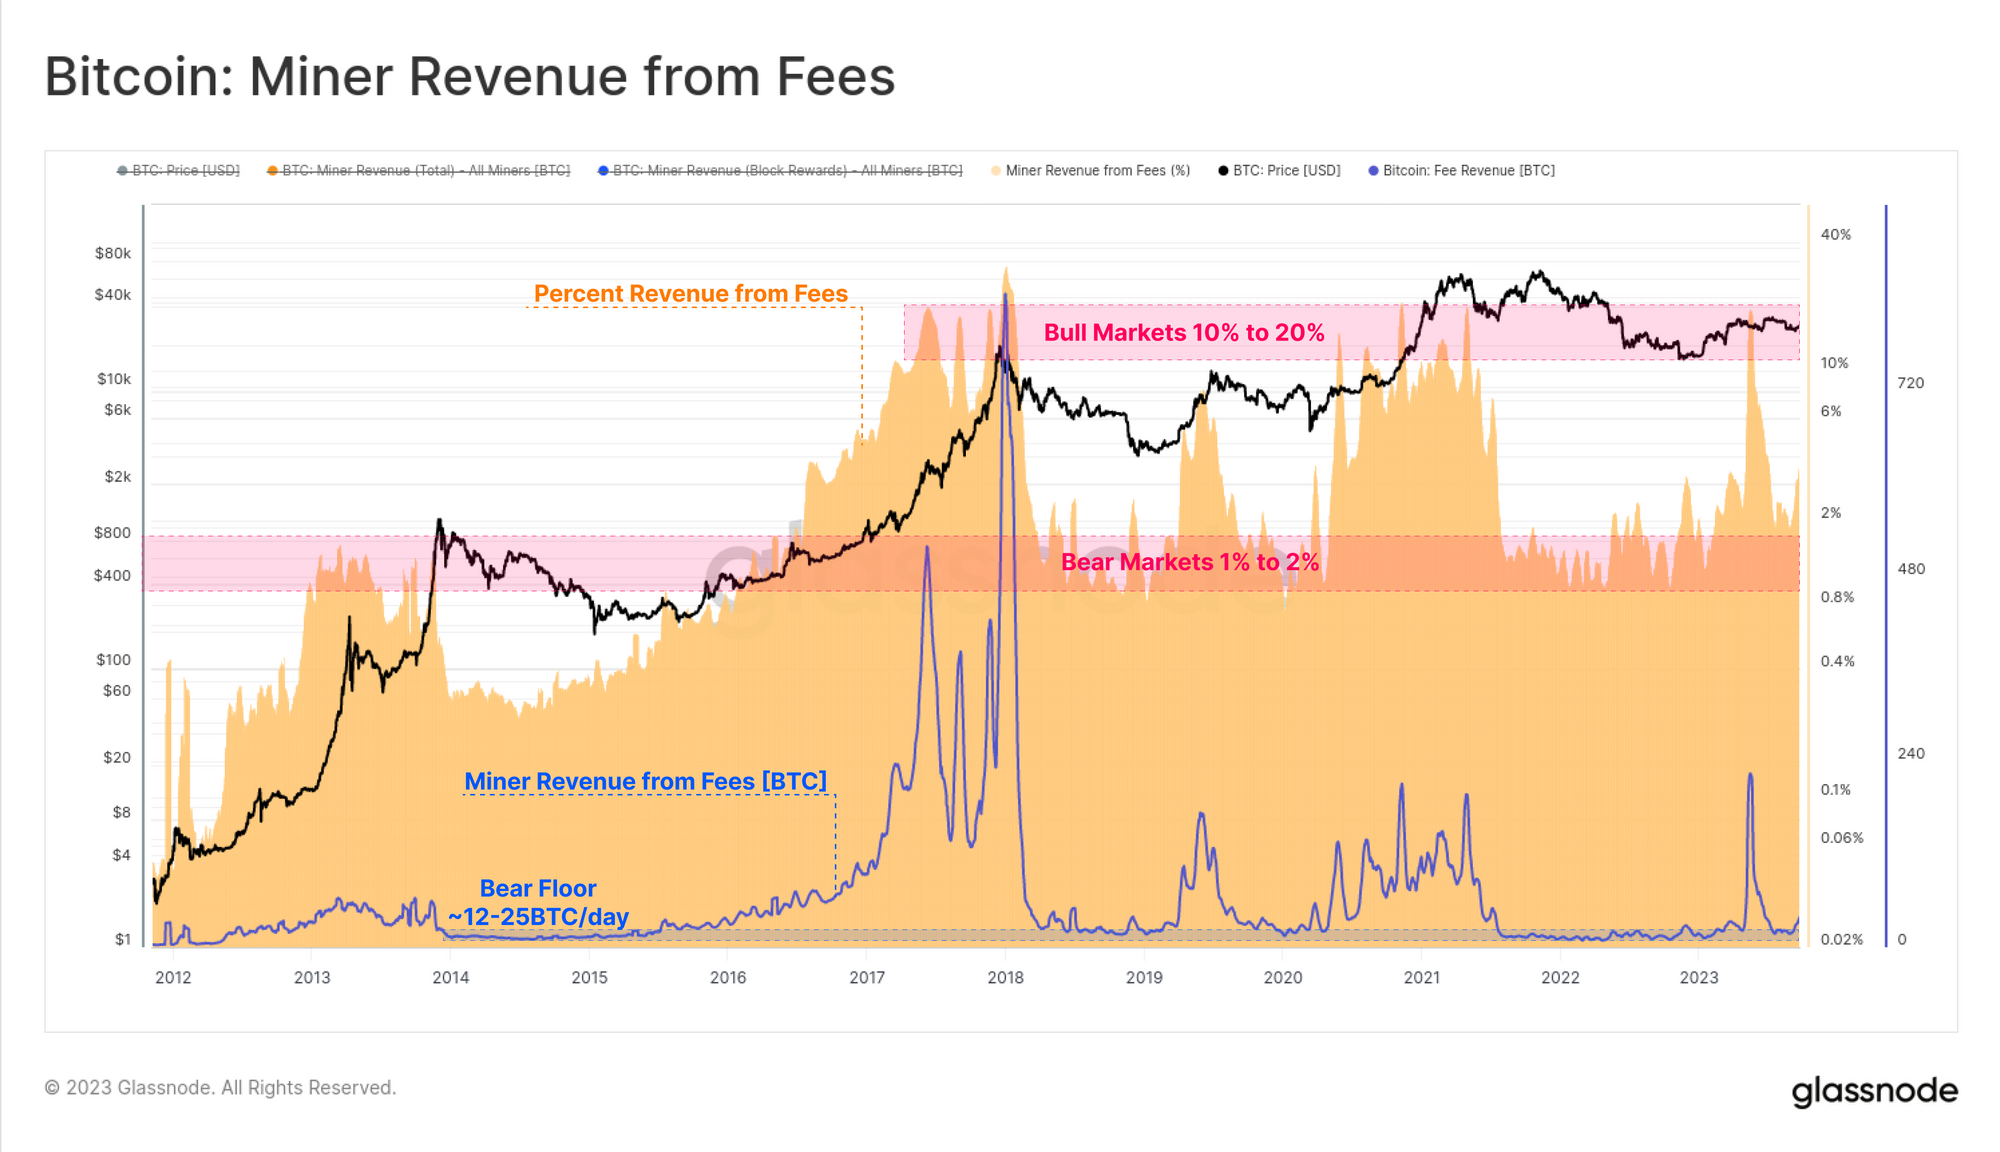
Naturally, as blockspace demand increases, miner revenues will be positively affected. Whilst the fee spike in May was historically large, it has since cooled off, and both total fees and their relative share of miner income remain relatively low.
Both metrics have lifted above their typical 'bear market' levels; total fees have increased by 216% from ~12 BTC/day to 38 BTC/day, and the the proportion of the miner income from fees has increased from 1% to 4%. Both are meaningful increases, however are still small in an absolute and historical context.
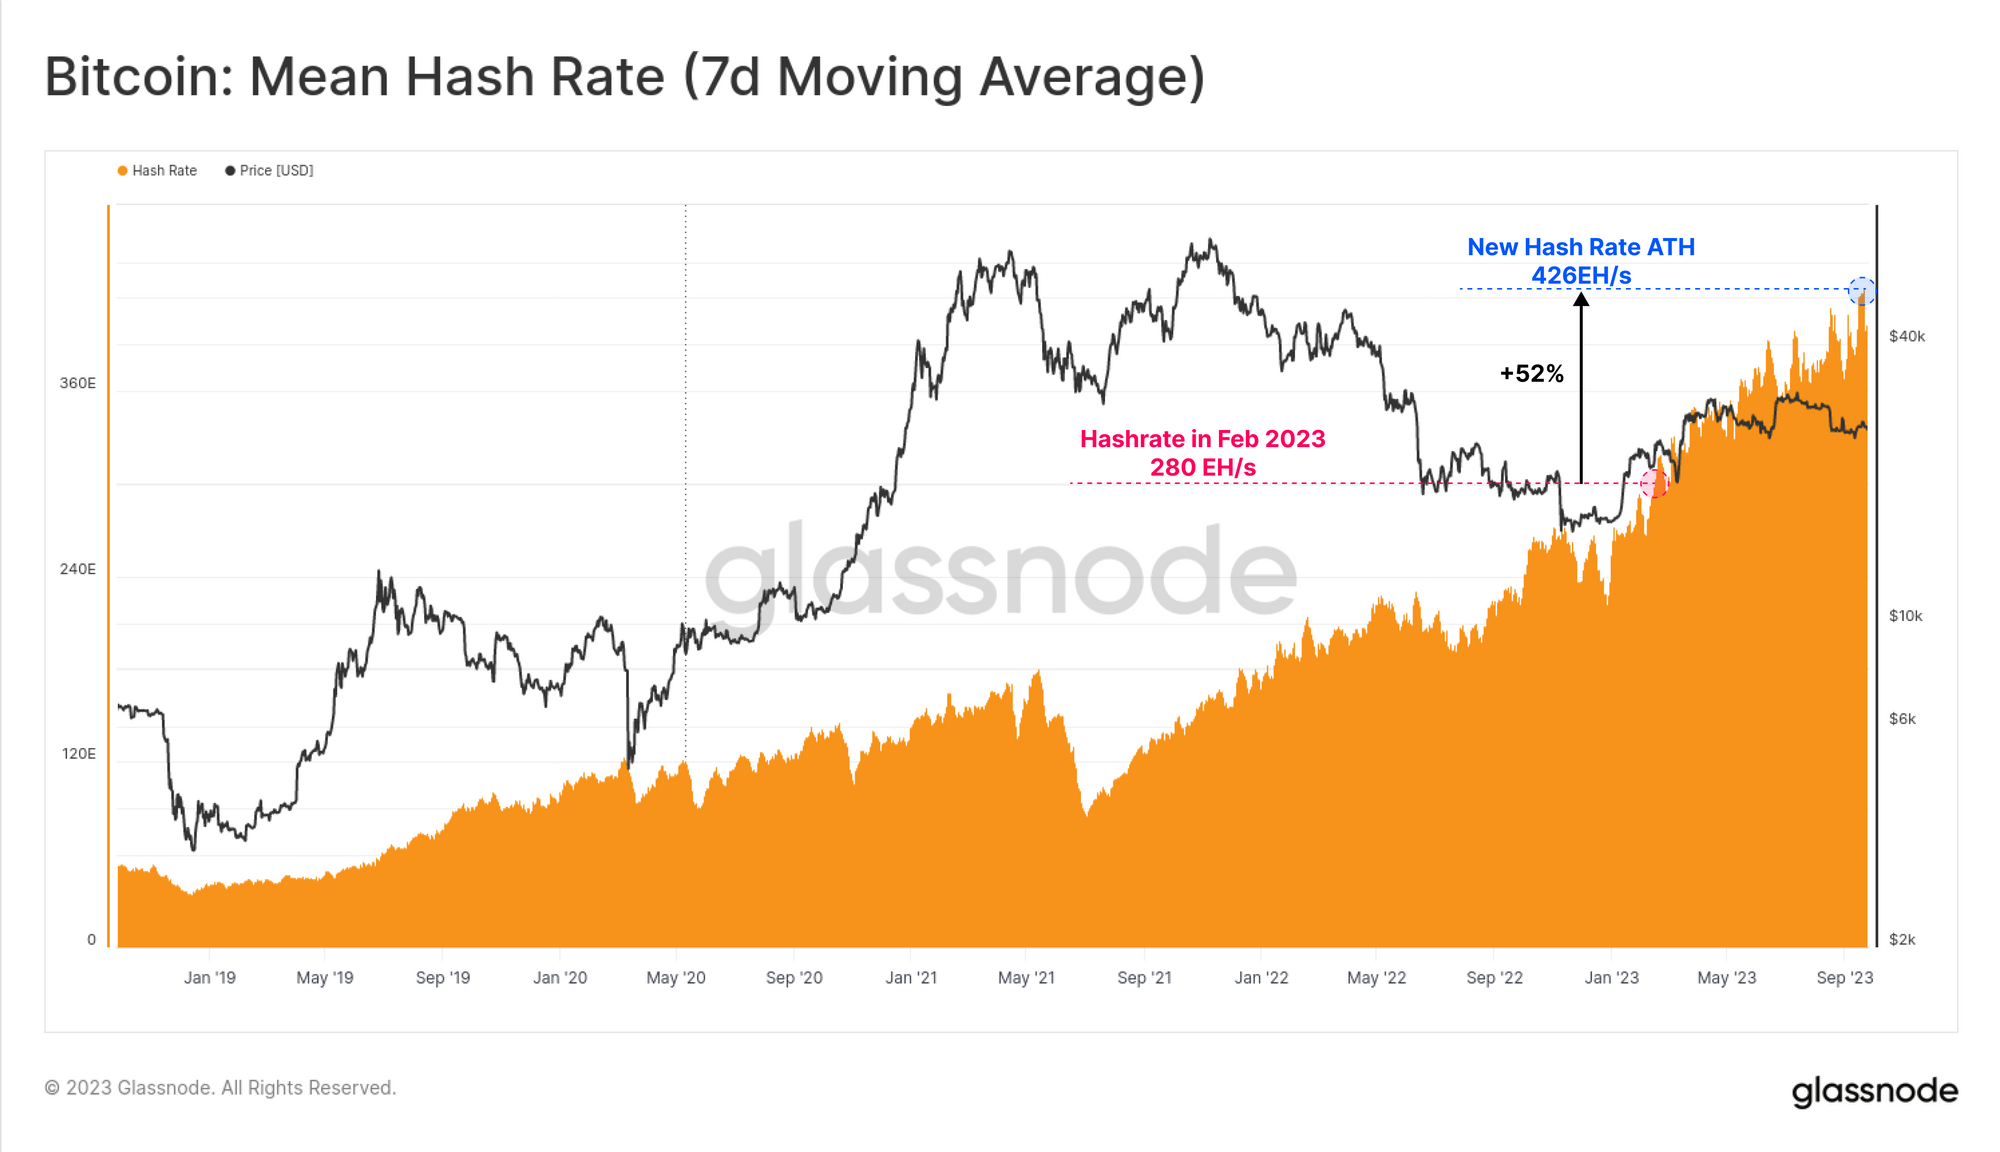
Meanwhile, the amount of hashrate competing for these rewards has increased by 50% since February, as more miners, and newer ASIC rigs are established and come online.
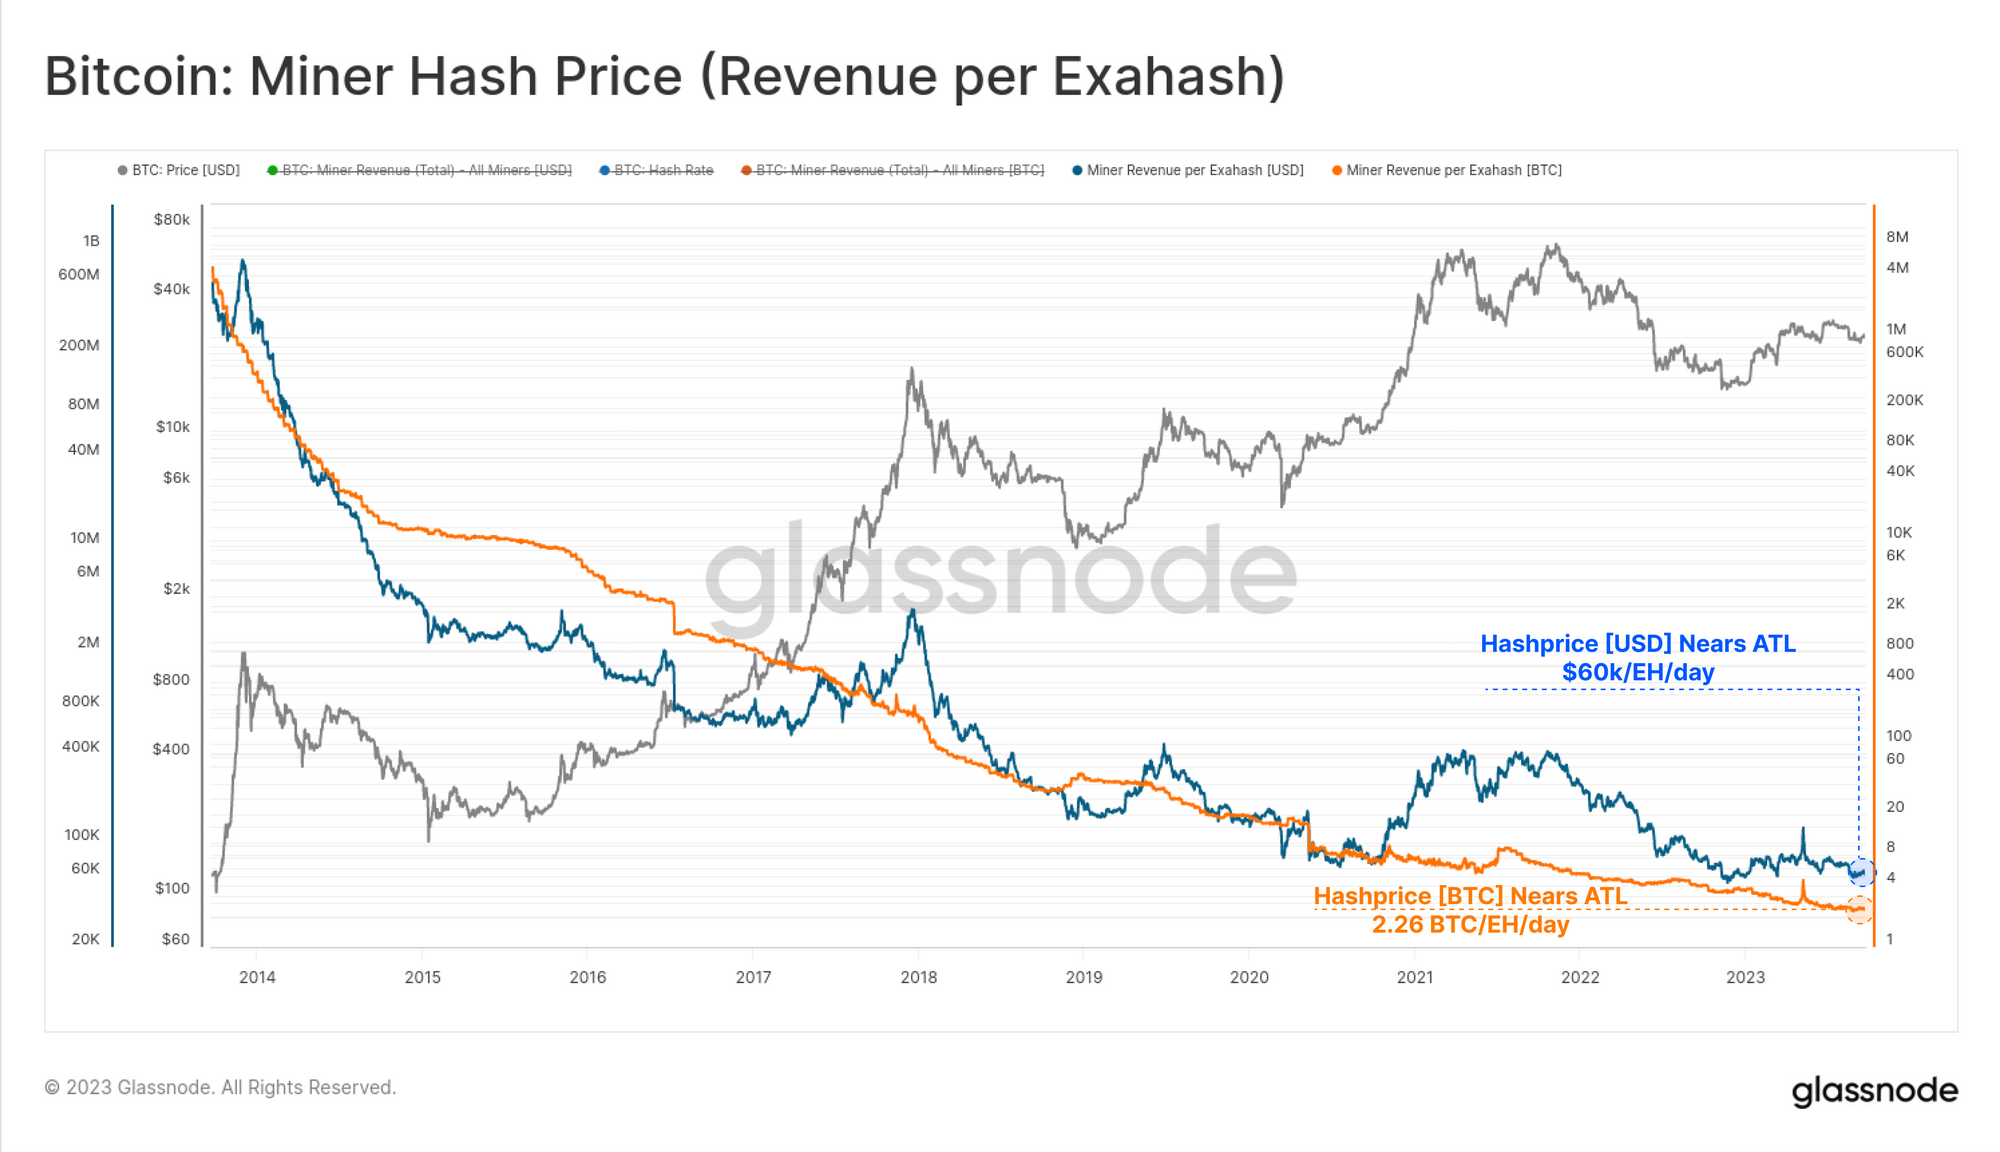
This has driven the hashprice, being the BTC or USD reward earned per Exahash, towards new all-time-lows. Miners will now earn just 2.26 BTC (~$60k) per Exahash active on the network.
The endless logarithmic descent of hashprice shows just how cut-throat and unforgiving the mining industry is.
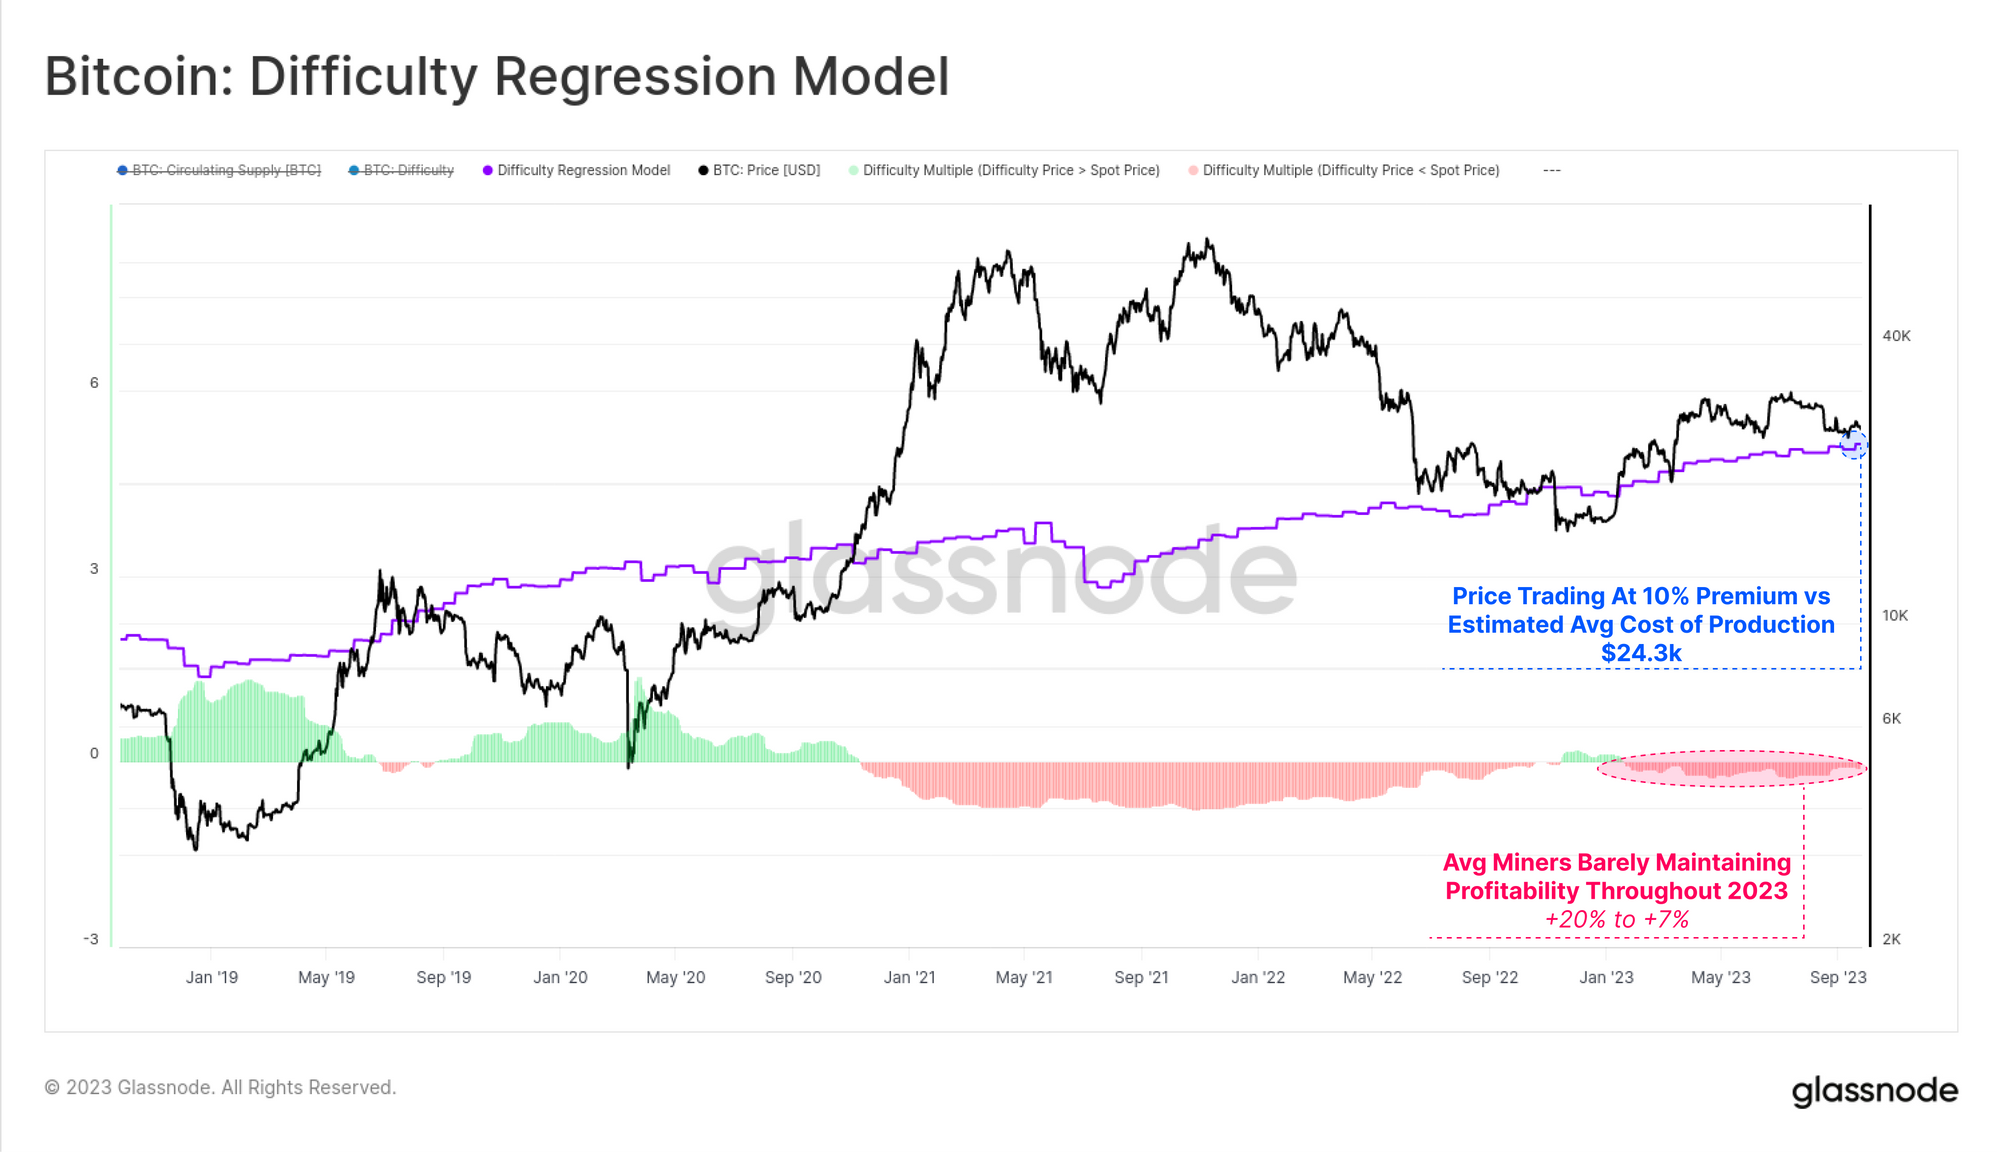
In a prior study, we attempted to estimate the average all-in cost of production for BTC via a regression model between Market Cap and difficulty. Based on this model, the average miner acquisition price is around $24.3k, which is less than a 10% premium to the current spot price.
This suggests that miners may be on the brink of becoming unprofitable, especially with the halving event now an estimated 206-days away.
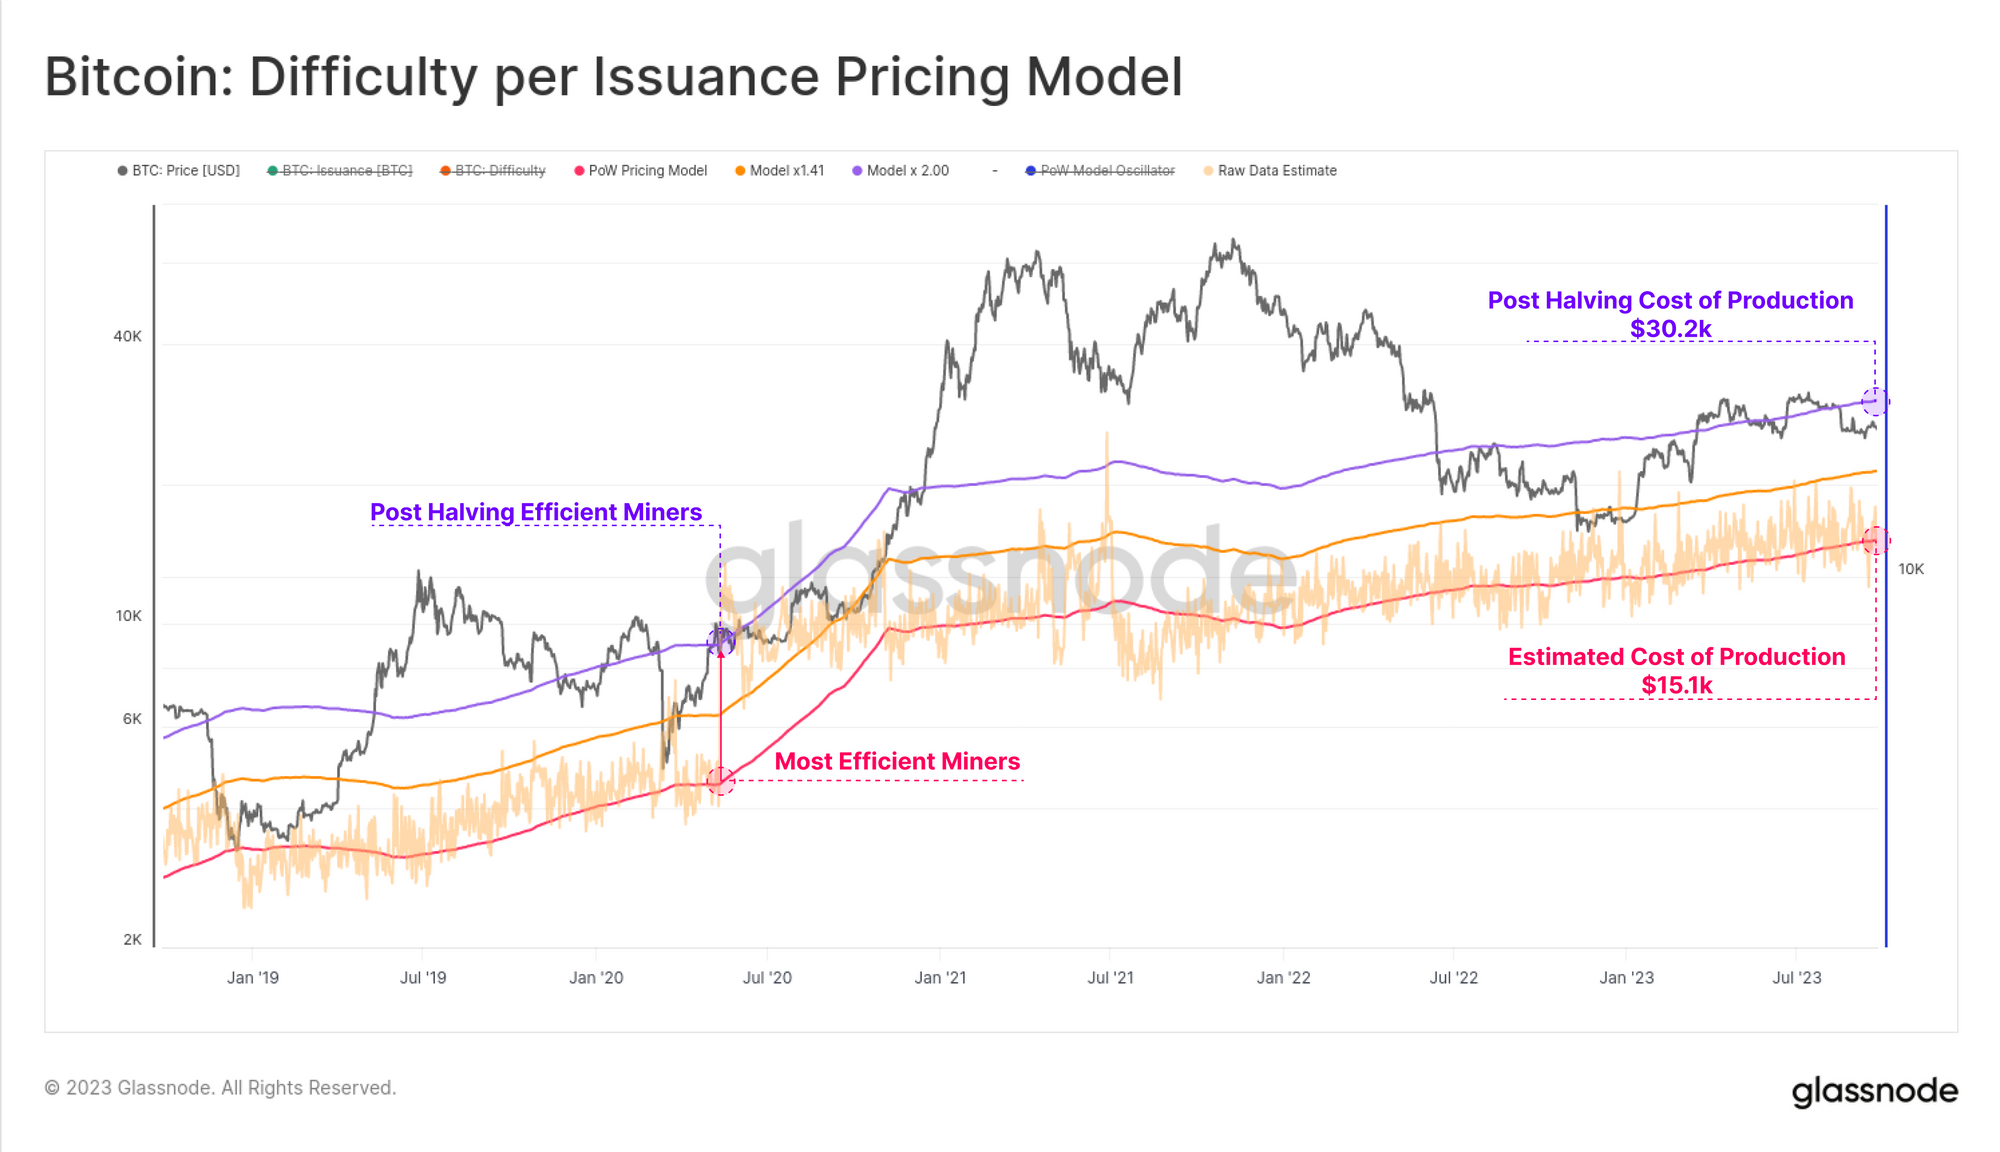
Another approach to estimating the cost of BTC production is via relative issuance to difficulty. By this model, we estimate that the most efficient miners on the network have an acquisition price of around $15.1k.
However, the purple curve shows the post-halving 'doubling' of this level to $30.2k, which would likely put the majority oif the mining market into severe income stress.
Summary and Conclusions
With inscriptions now having several months of history to study, we find that they act as a sort of 'packing-filler' for blocks. There is minimal evidence that inscriptions are displacing monetary transfers, instead acting as a buyer of last resort for cheap blockspace.
Whilst this has improved the base-load demand for blockspace, and increased fee revenue meaningfully, the hashrate competing for it is also up over 50% since February. With extreme miner competition in play, and the halving event looming, it is likely that miners are on the edge of income stress, with their profitability to be tested unless BTC prices increase in the near term.