Tracing Capital Flows
In the wake of the Federal Reserve's 0.5% interest rate cut, Bitcoin has reclaimed the Short-Term Holder cost basis of ~$61.9k. This rally could achieve technical significance if the price also holds above the 200-day moving average at $63.9k.


Executive Summary
- Bitcoin has reclaimed the Short-Term Holder cost basis ($61.9k) and 200DMA ($63.9k) following a 0.50% interest rate cut by the Federal Reserve.
- Short-term holders are under marginally less pressure as prices rise above their cost basis, after a period of net capital outflows.
- New investors show a degree of resilience, seen in realized losses being of a relatively small magnitude, suggesting confidence in the overall uptrend.
- The perpetual futures market displays a cautious recovery in sentiment, with gradually increasing demand but still below levels seen during strong bull markets.
A Shift in Market Gradient
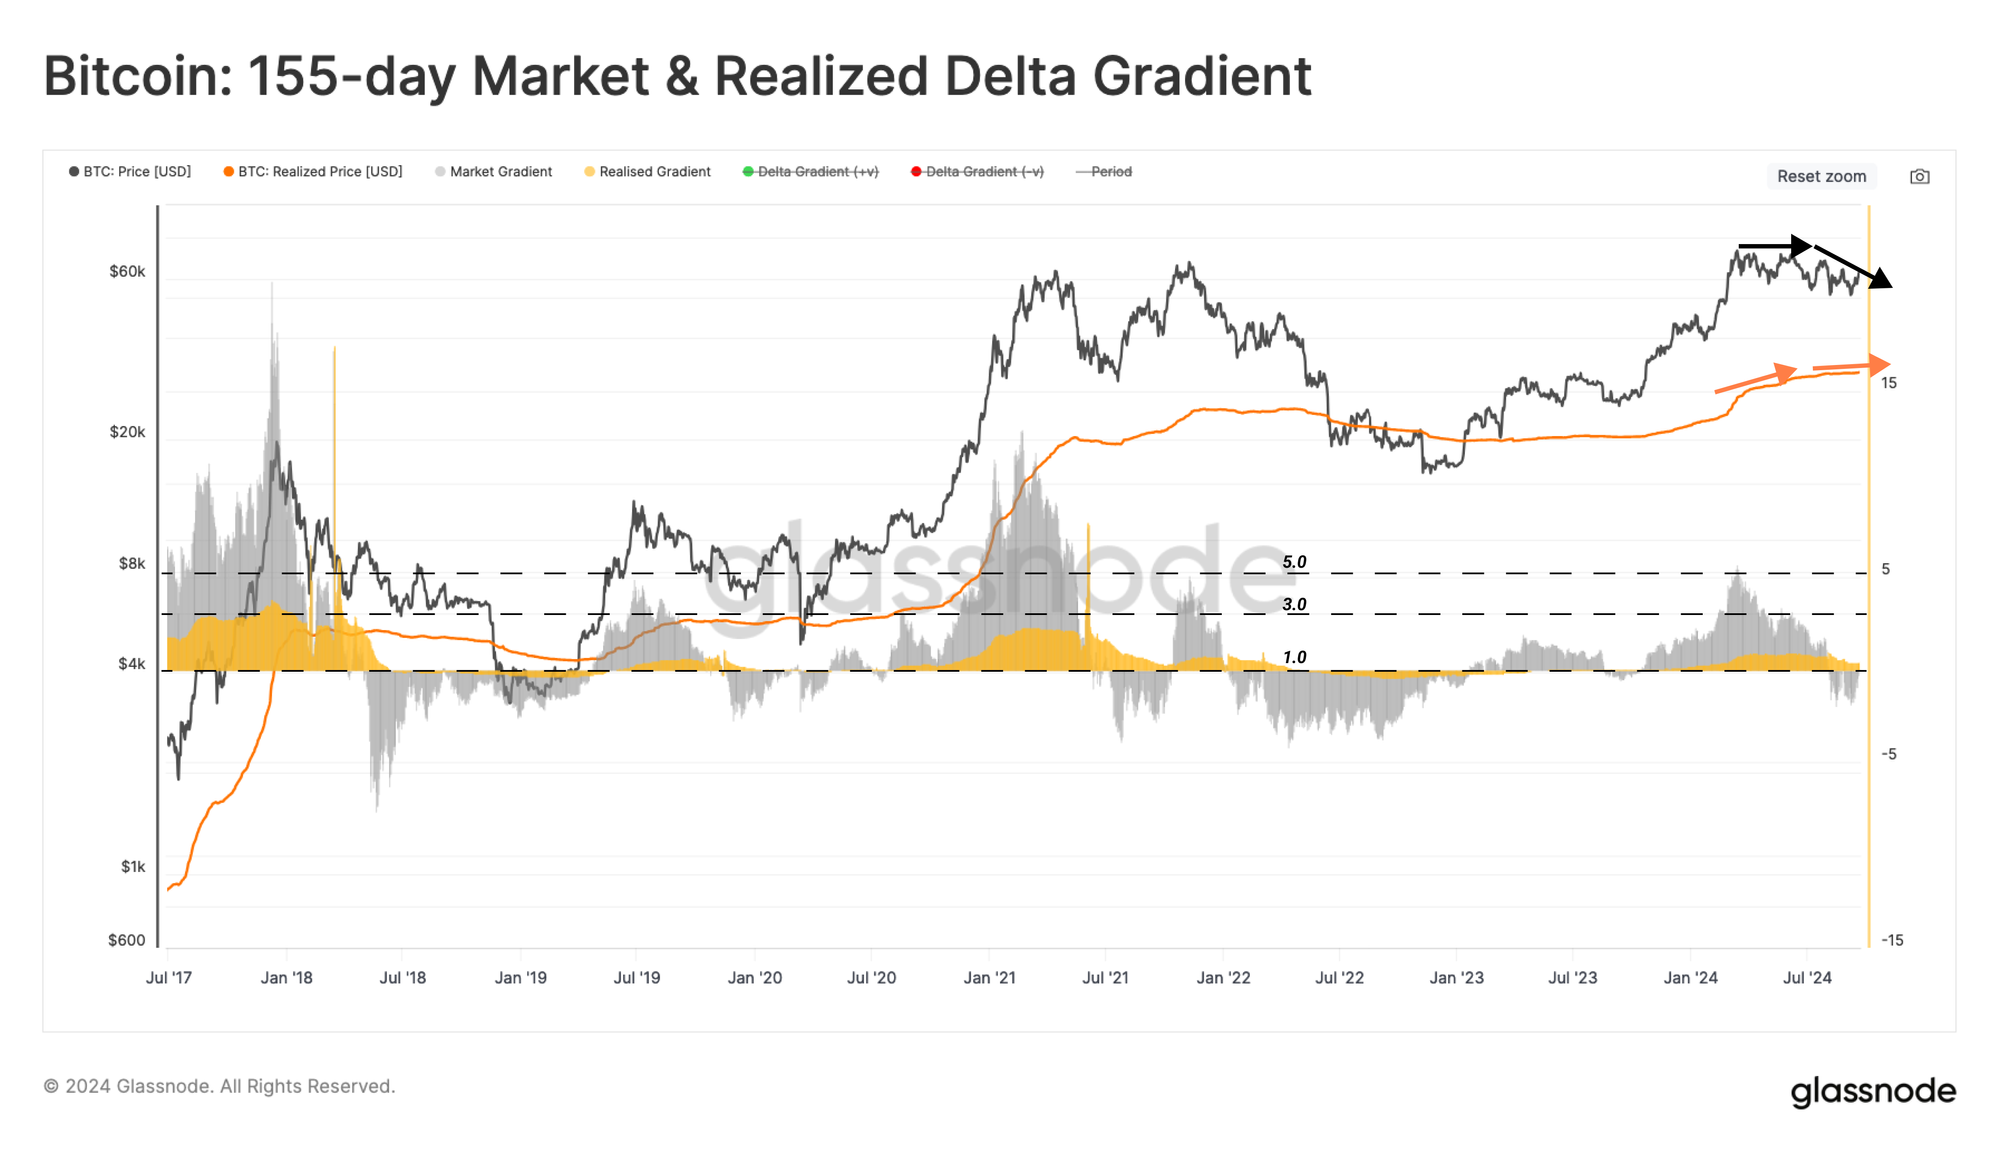
The capital inflow into the Bitcoin network slowed down after the market reached the March ATH, resulting in diminishing price momentum. This can be confirmed by comparing the smoothed 155-day gradient of Price ⬛ against that of the Realized Price 🟧.
The market gradient had fallen into negative values over recent weeks, with the realized price gradient being positive, but trending lower. This indicates that the downside in the spot price was more aggressive than the intensity of capital outflows.
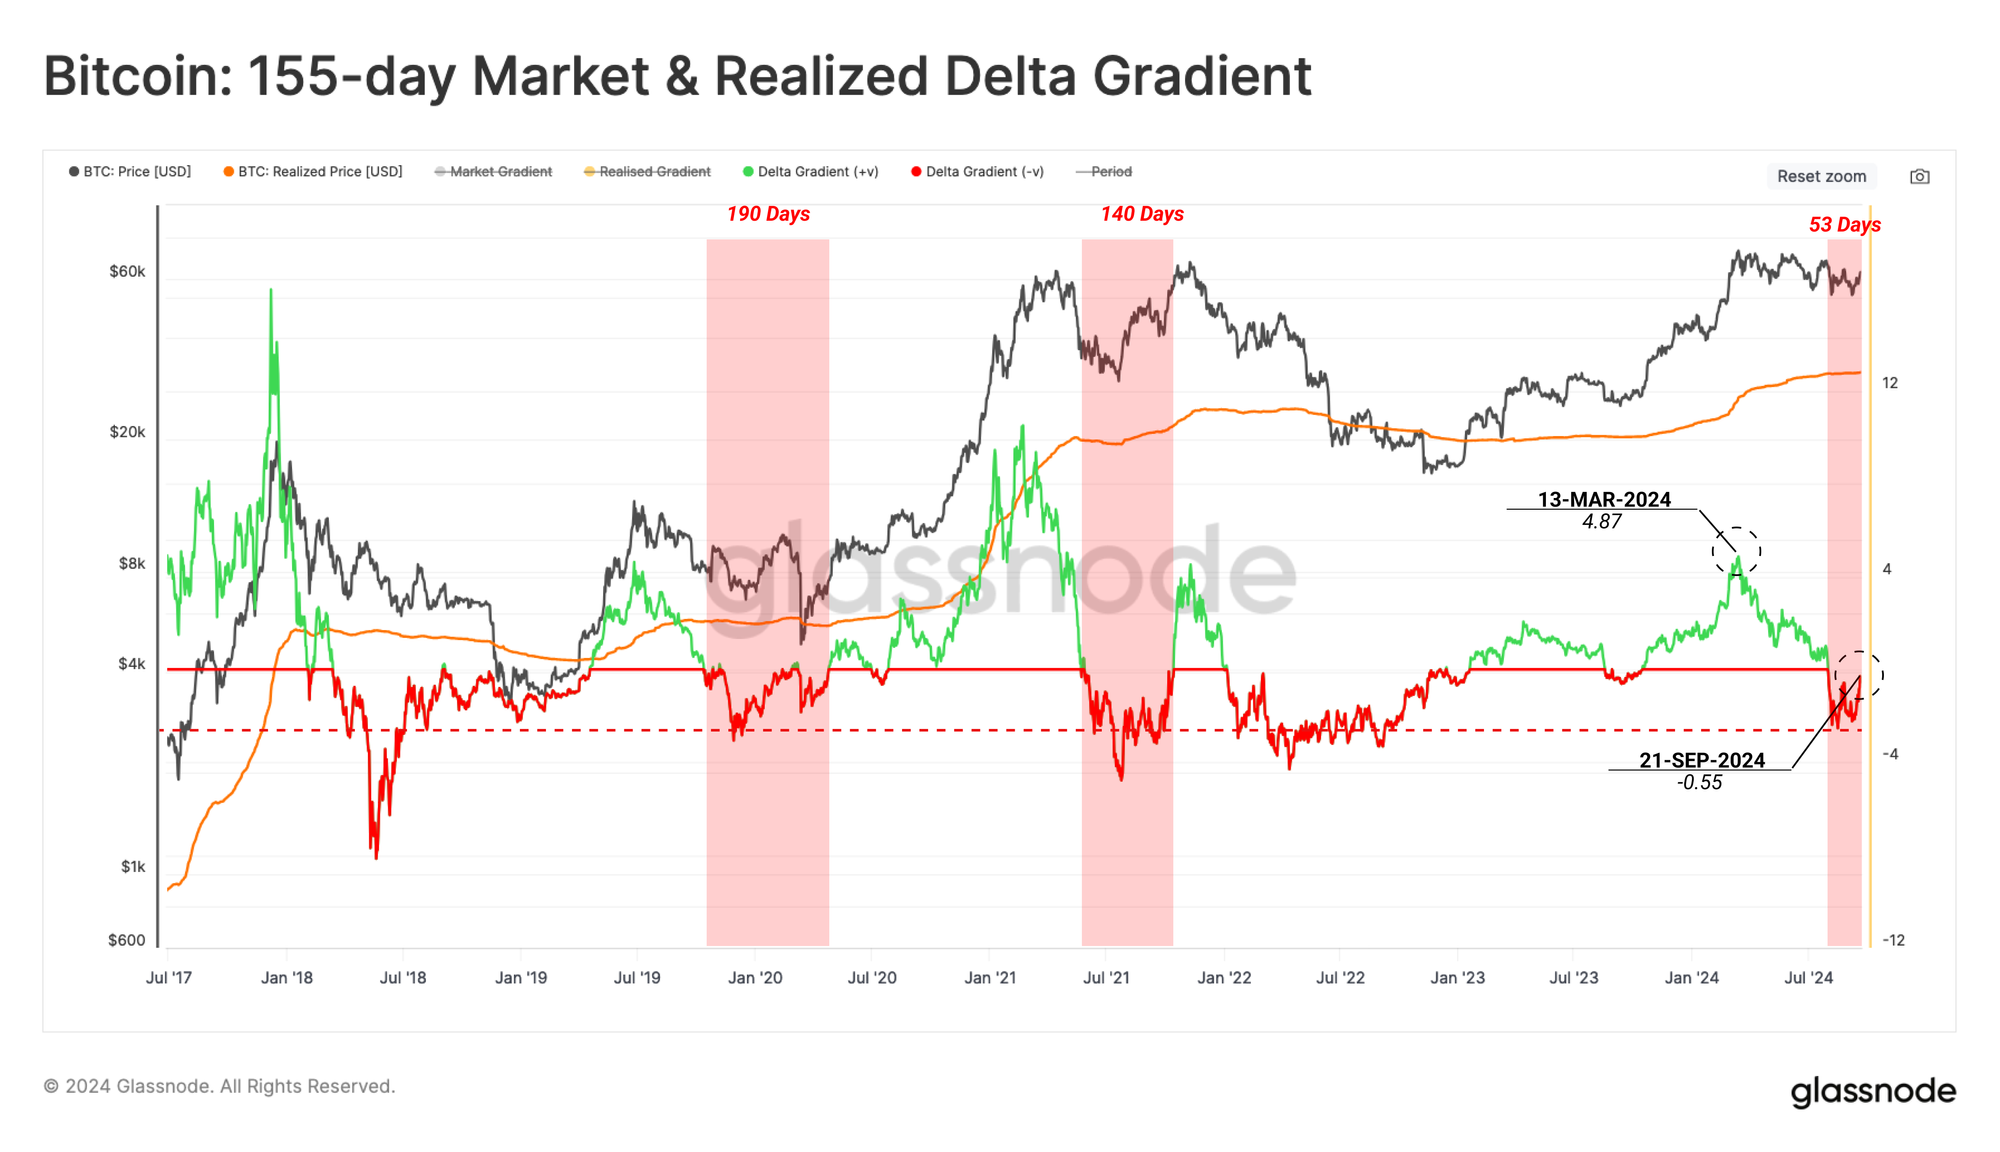
The next chart measures the z-score of these two gradients. Negative values can be interpreted as periods of relatively weak demand, resulting in a sustained contraction of prices.
Using this metric, we can see that the current structure is very similar to the 2019-20 period, where the market experienced an extended consolidation range after a strong rally in Q2-2019.
New Capital Flow Direction
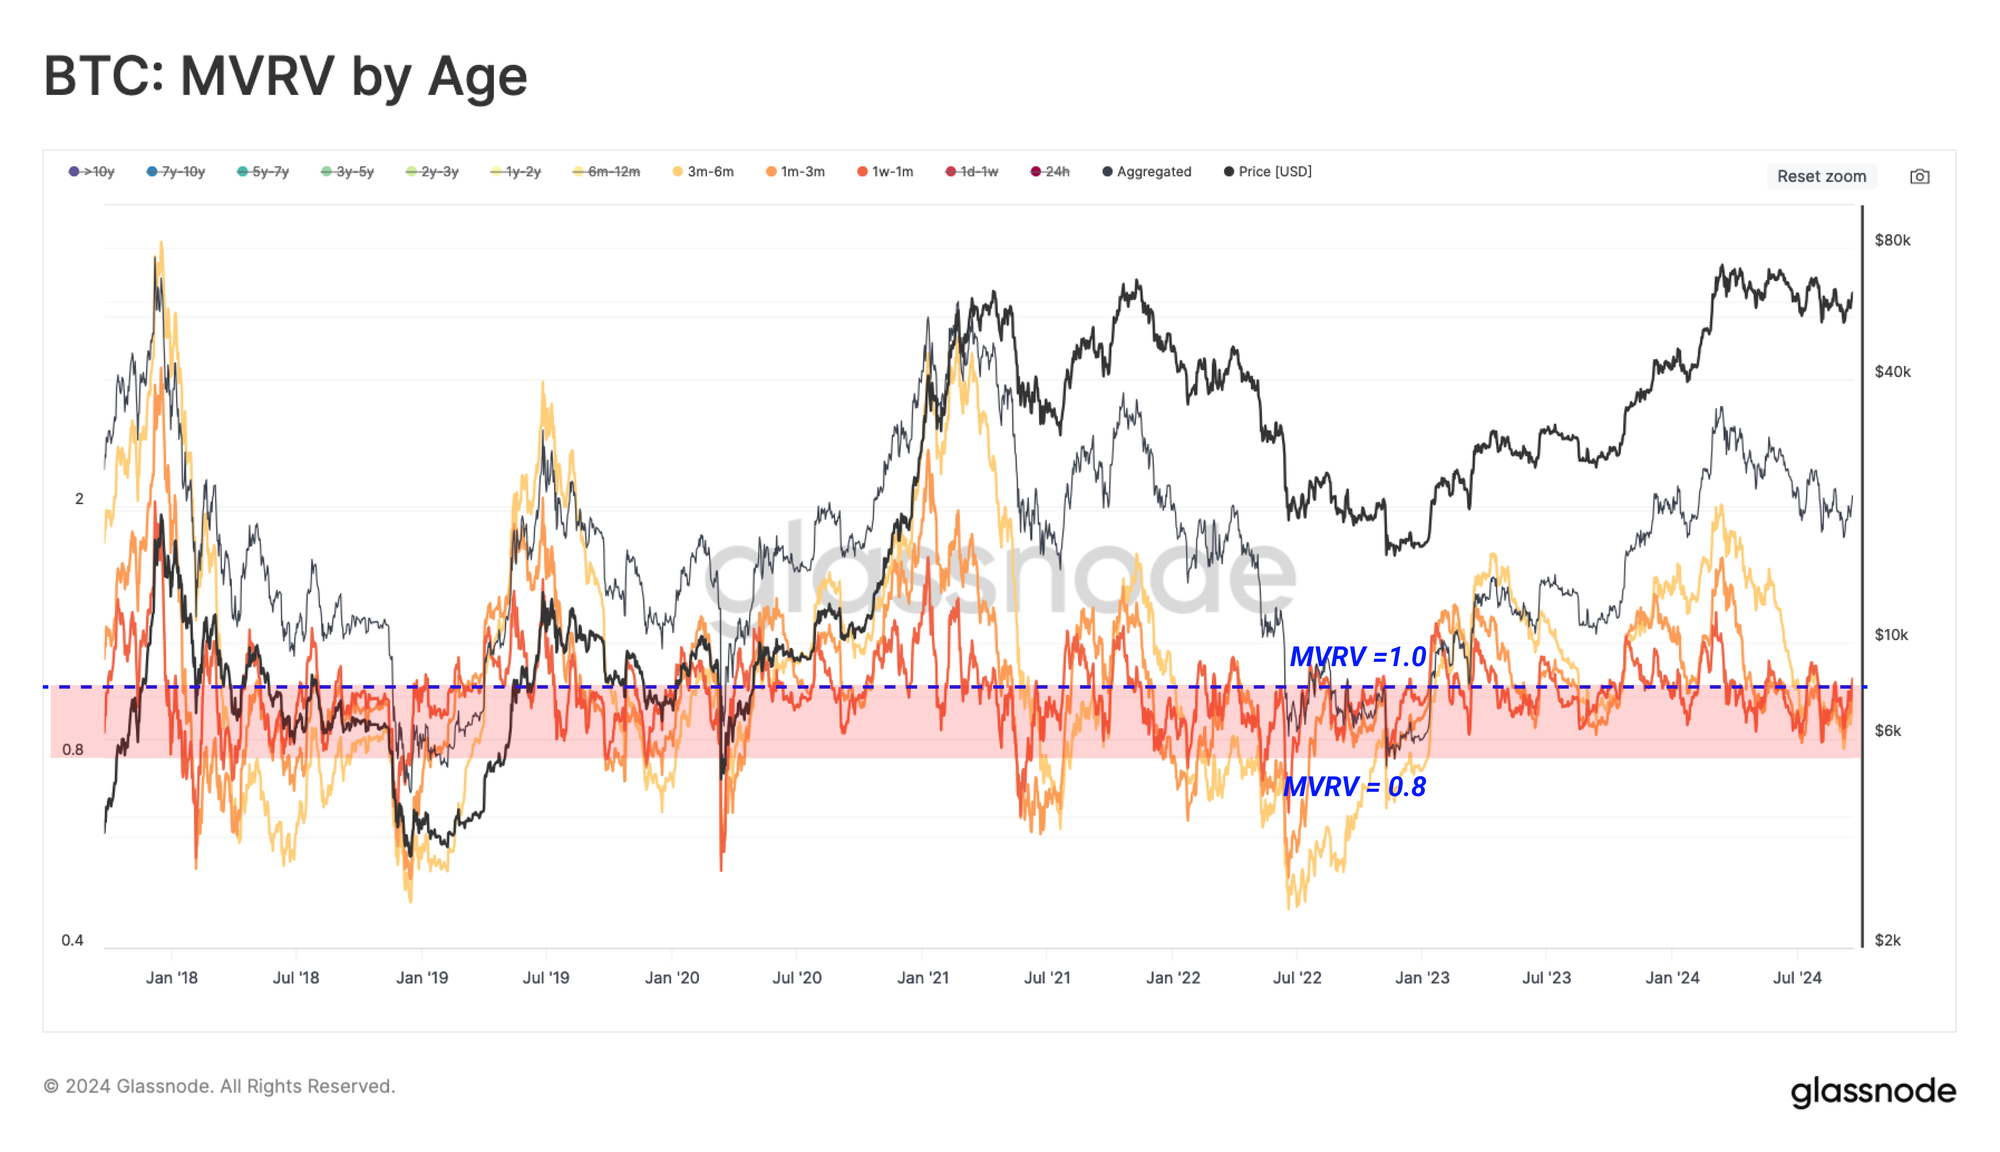
The current consolidation phase has pushed the spot price below the cost-basis of several short-term holder sub-cohorts since late Jun 2024 (MVRV Ratio <1). This highlights how recent investors have been under financial pressure, nursing increasingly larger unrealized losses.
However, despite many new investors being underwater on their holdings, the magnitude of their unrealized losses are notably less severe than the mid-2021 sell-off, and the March 2020 COVID crash.
When the market enters a prolonged regime of contraction, diminishing returns motivate investors to cash out at lower prices, cutting their losses. Thus, the cost basis of a relatively young supply tails the spot price lower. The repricing of short-term holder supply to lower price values can be characterized as a net capital outflow from the Bitcoin ecosystem.
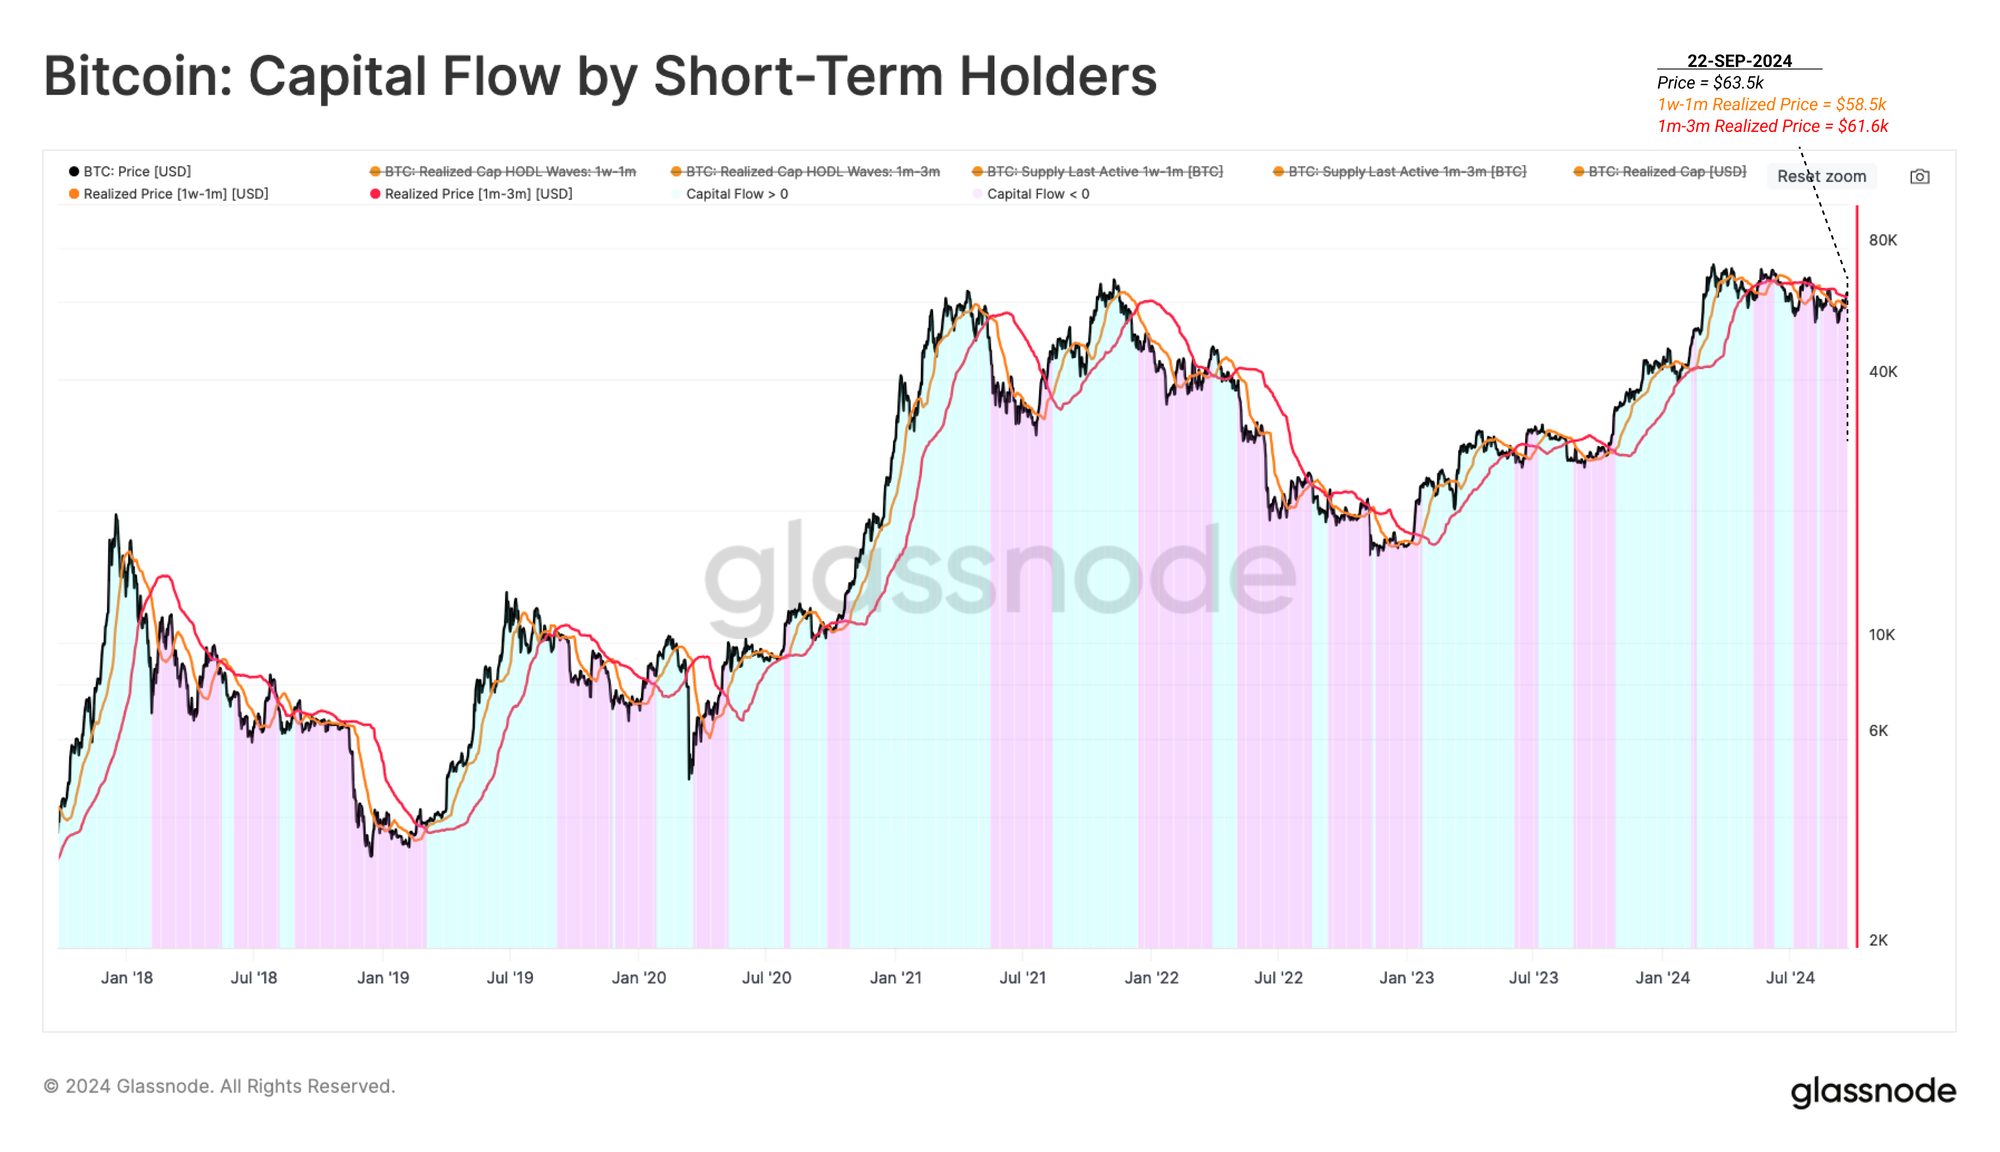
To gauge the direction and intensity of capital flows from the perspective of new investors, we have constructed an indicator that compares the cost basis of two sub-groups (1w-1m as the fast trace, and 1m-3m as the slow trace).
- Capital Outflows 🟪 During downwards trending markets, the cost basis of the youngest coins (1w-1m 🟠) declines faster than the older age cohort (1m-3m 🔴). This structure indicates that the overall direction of capital flows is negative, and the intensity of this outflow is proportional to the deviation between these traces.
- Capital Inflow 🟦 During market up-trends, the cost basis of younger coins expands faster than that of the older age band. This indicates that capital is flowing in at a rate proportional to the divergence between these traces.
The cost basis of younger coins is currently trading below that of older coins, suggesting the market is experiencing a net outflow regime. Utilizing this indicator, a sustainable market reversal may be in its early stages of developing positive momentum.
Confidence of New Investors
As the unrealized losses held by new investors grow during a market correction, their tendency to capitulate at a loss tends to increase accordingly. Short-term holders have been statistically shown to be more sensitive to volatility, making their behavior useful to track around market inflection points.
When checked alongside MVRV by Age, the SOPR by Age indicators show almost identical behavior. This confirms that new investors have both been underwater on their holdings and experienced sufficient stress to crystallize those losses.
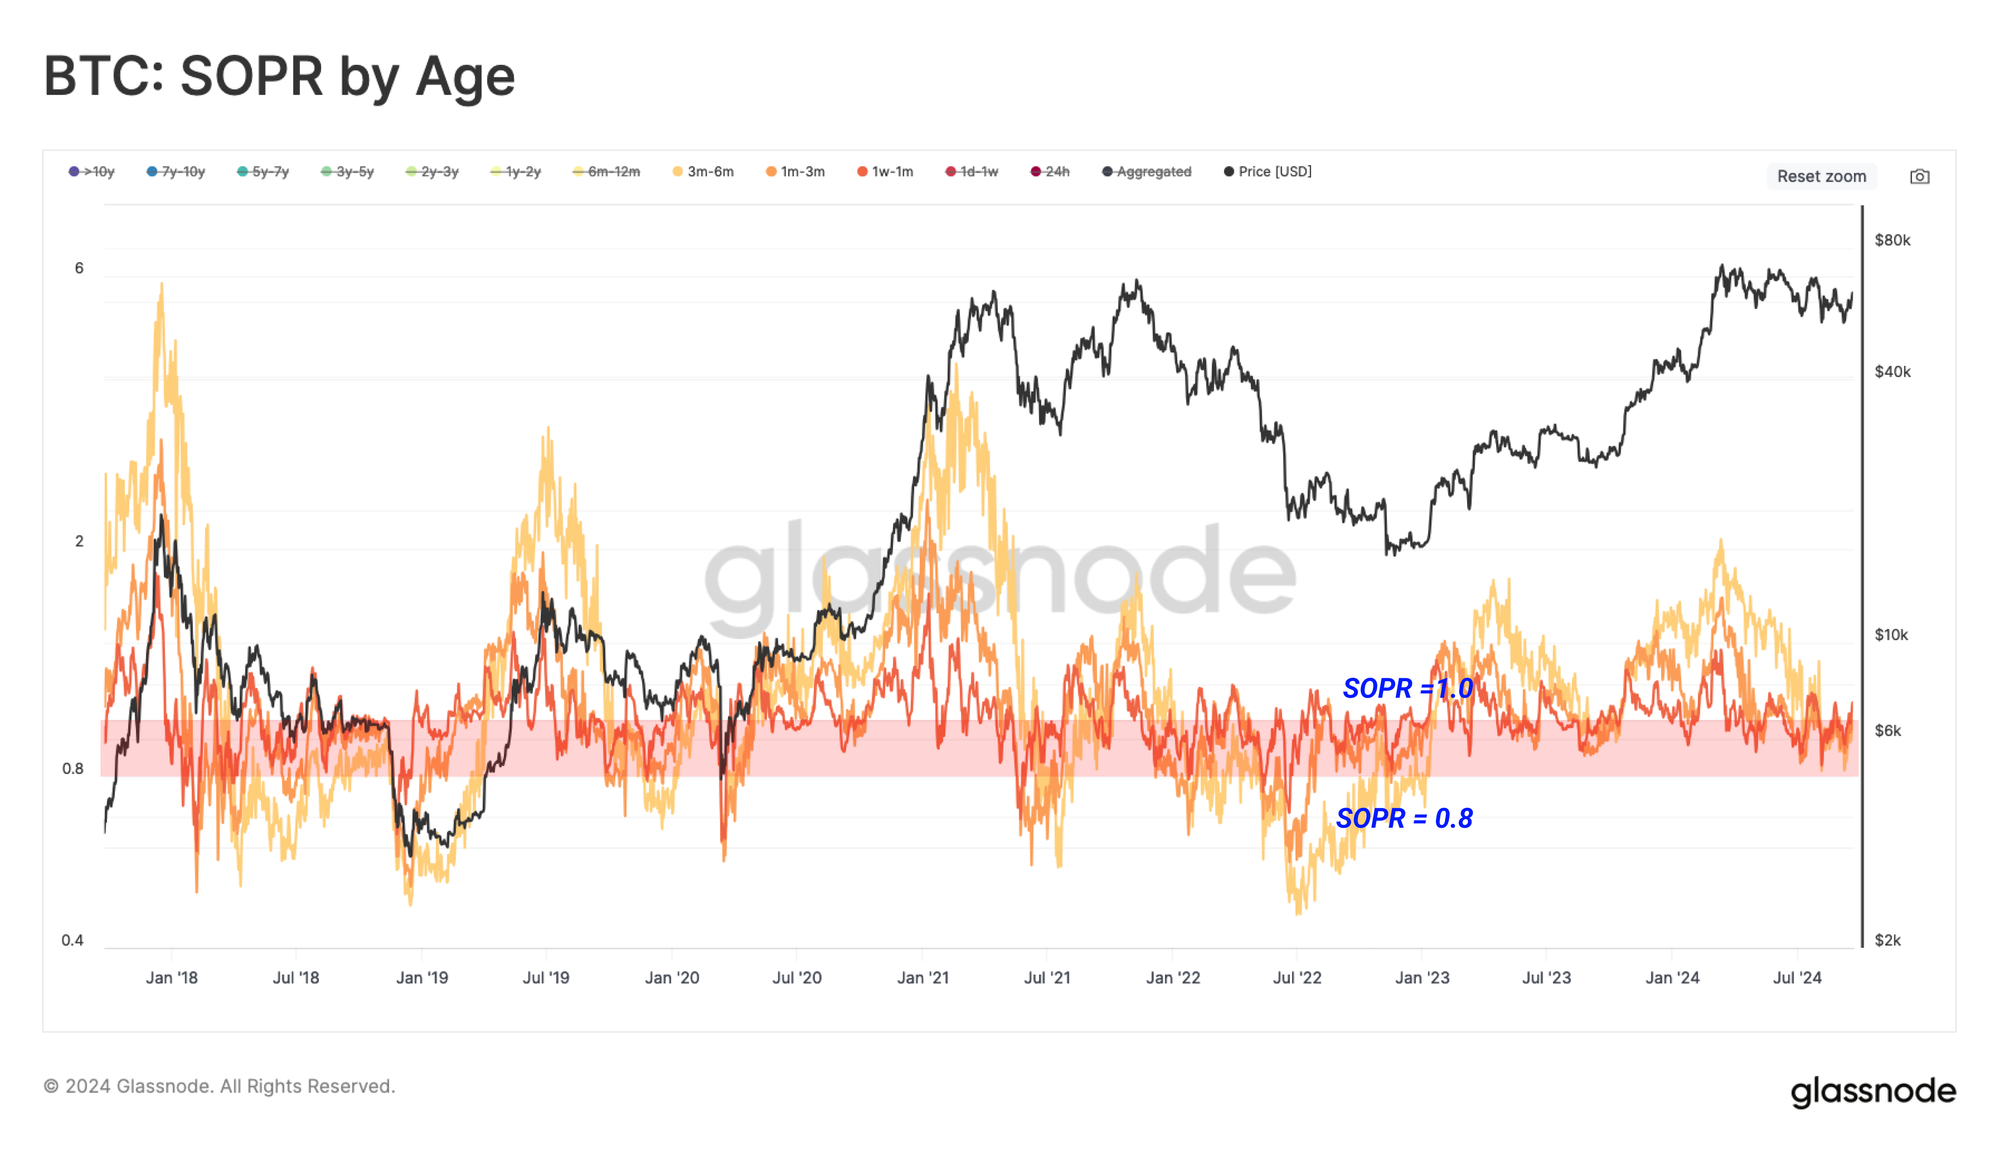
We can also assess the intensity of the reaction by Short-Term Holders to any shifts in market sentiment.
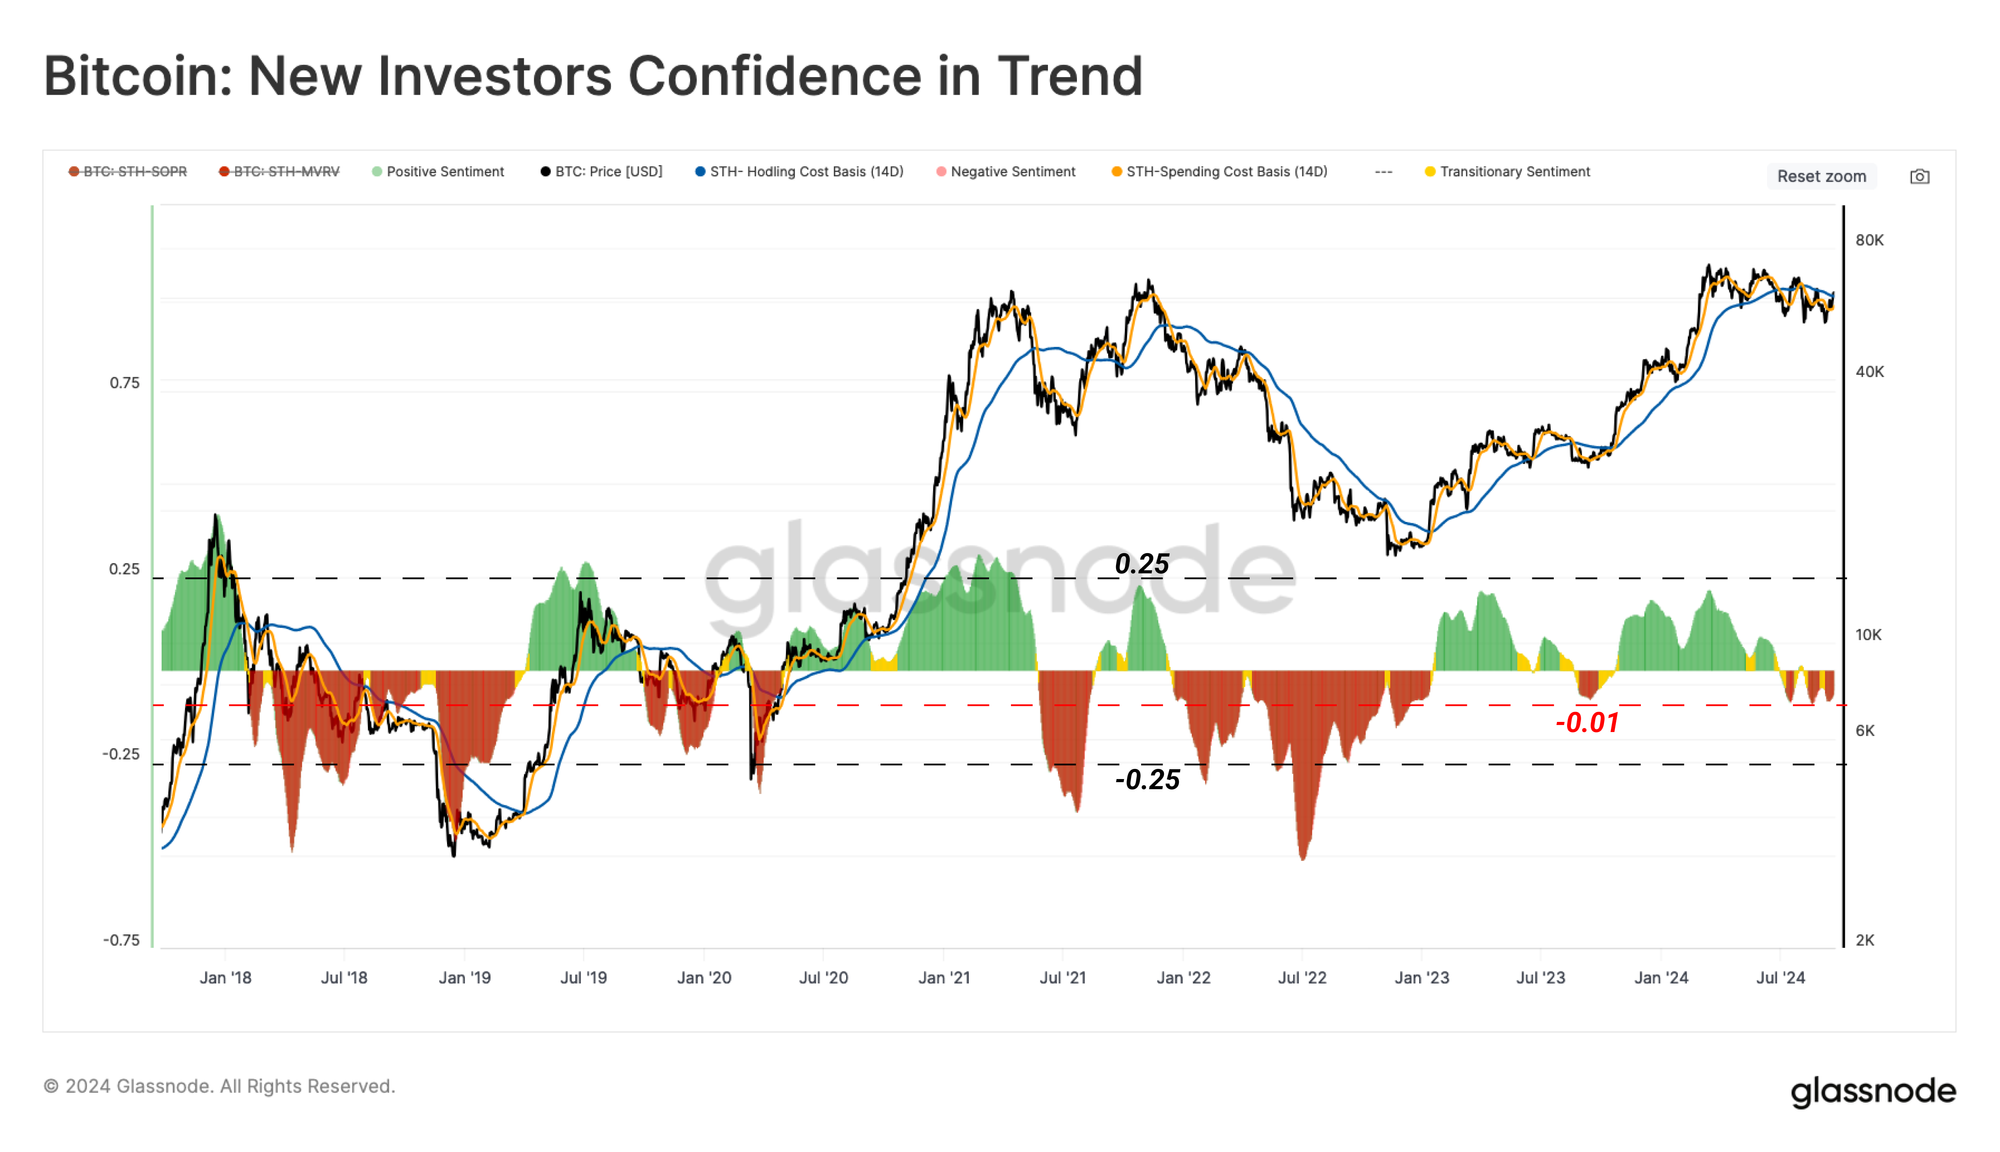
The difference between the cost basis of new investors who are spending 🟠 and the cost basis of all new investors 🔵 shines a light on their aggregate confidence. When normalized by the spot price, this deviation enables us to highlight periods when new investors overreact to extremely high unrealized profit or loss conditions.
Over recent months, new investors who acquired their coins over the last 155 days have shown comparatively higher confidence in the market than previous ‘bearish trends’. The magnitude of losses locked in by this cohort remains relatively low compared to the cost basis of their holdings.
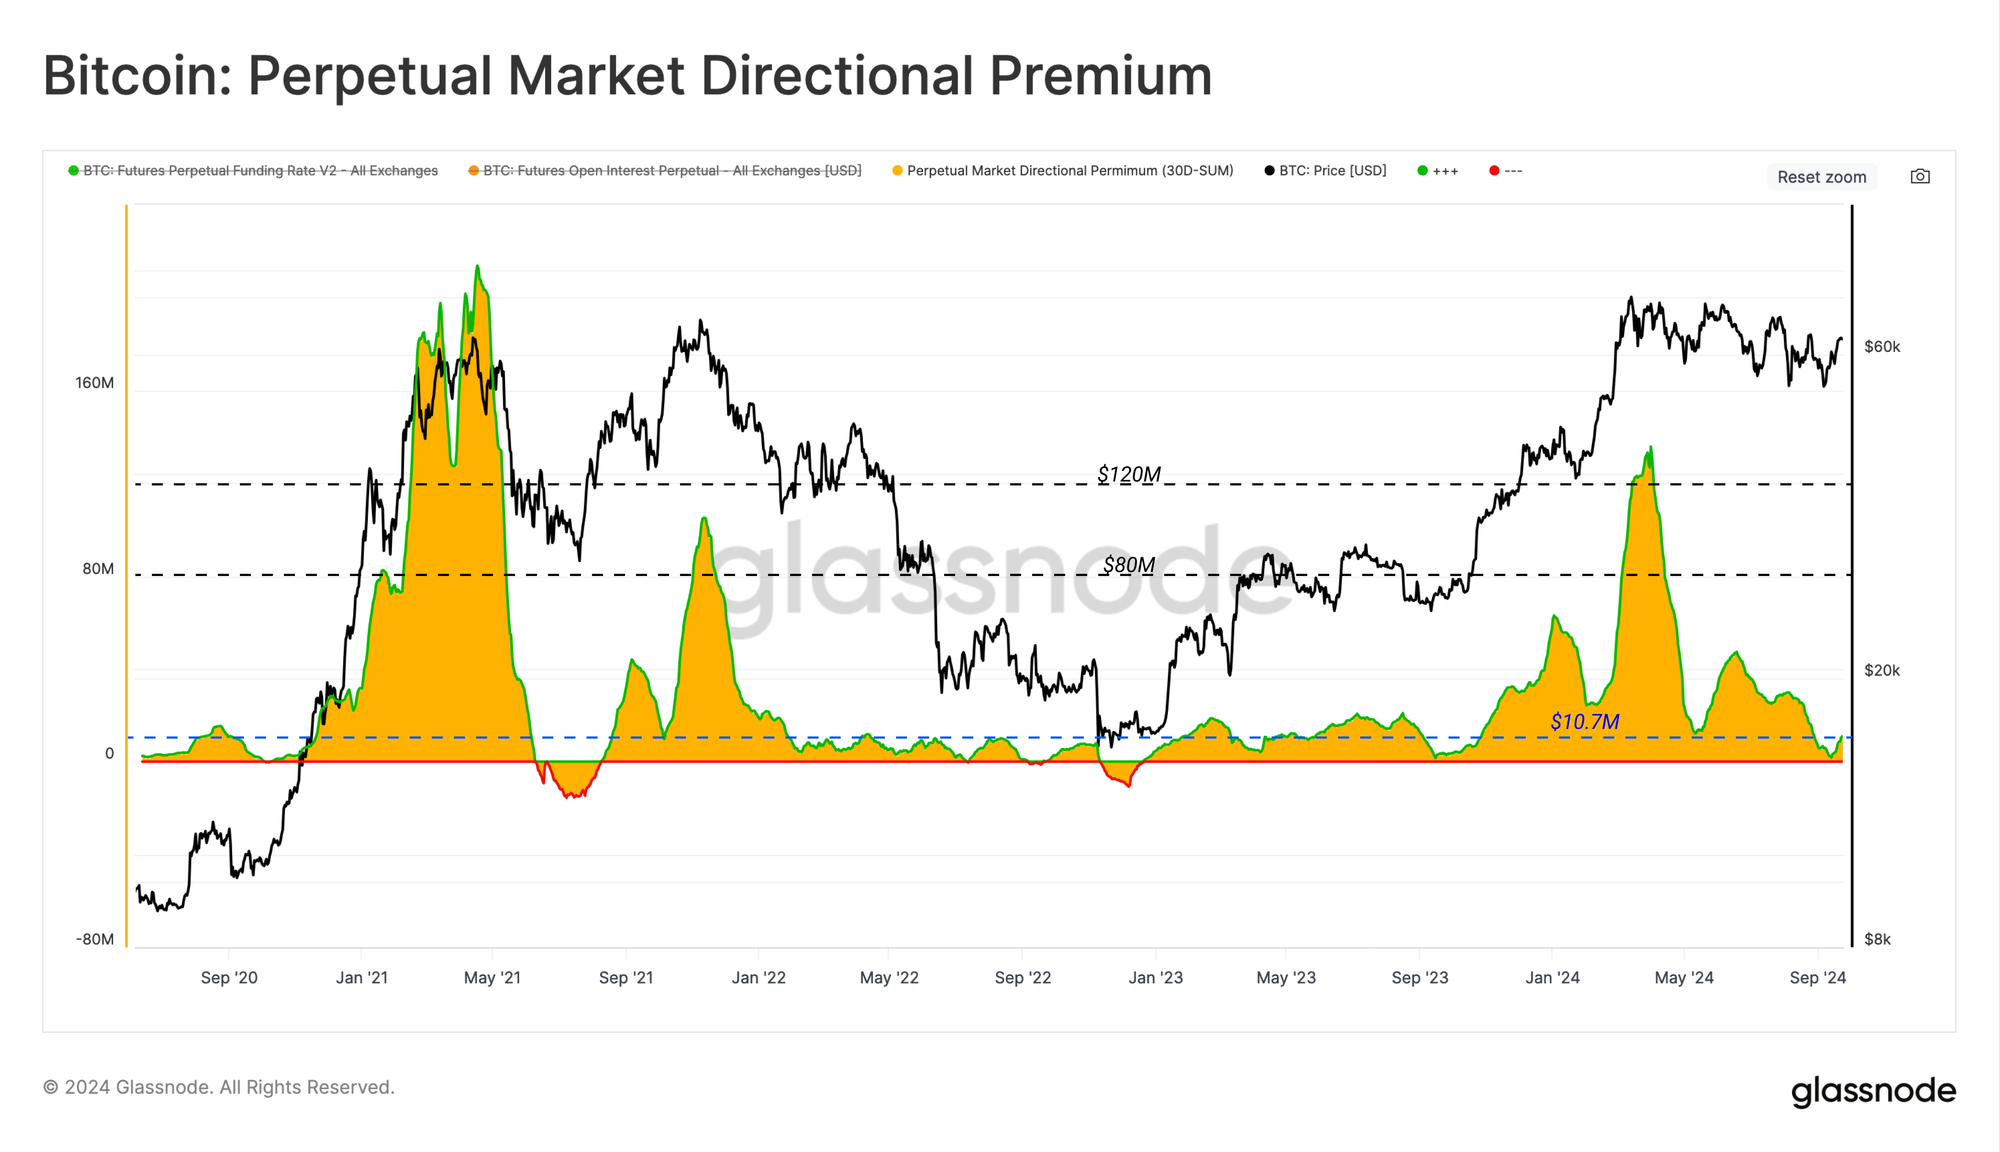
A Long-Side Perpetual Premium
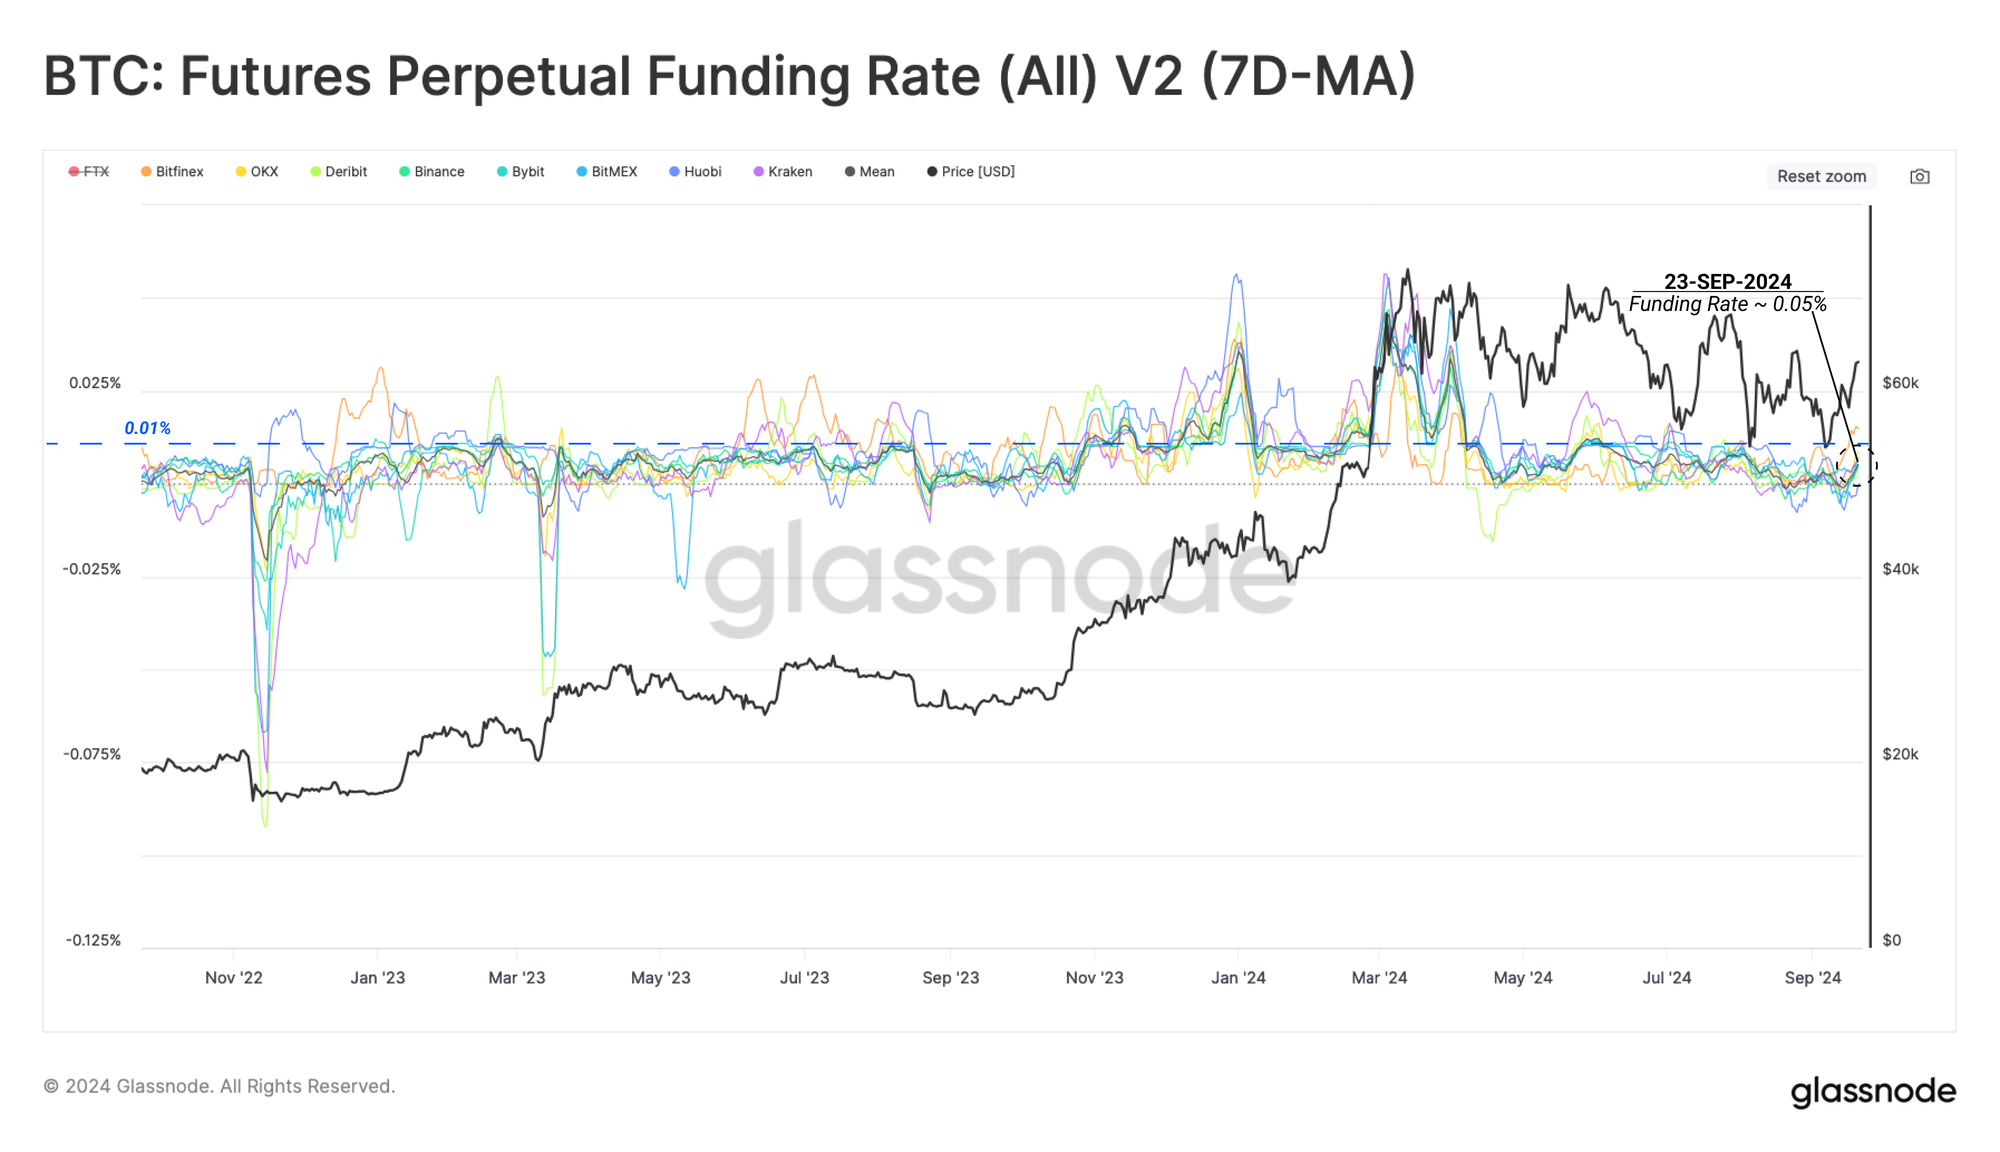
We can use the perpetual futures market to add another dimension to our investigation of the confidence of new capital in the uptrend. First, we employ the Futures Perpetual Funding Rate (7D-MA) to show the appetite of speculators for paying a higher interest rate to take on leverage for long positions.
Considering the funding rate value of 0.01% is an equilibrium value on many exchanges, we look for deviations above this level as a threshold of bullish sentiment. The recent price bounce has been paired with a relative warming up of long-biased leverage in perpetual markets. This has pushed the weekly average funding rate to 0.05%.
Whilst this is above the equilibrium level, it does not yet indicate a strong or excessive degree of long-biased demand in perpetual markets just yet.
If we calculate the cumulative monthly premium that long-side contracts have paid to the short side over the last 30 days, we can see that the total cost of leverage around the March ATH was around ~$120M per month.
This indicator has plunged to $1.7M per month as of mid-September, with only a modest uptick to $10.8M per month today. Therefore, demand for long-leverage has increased over the last two weeks but is still considerably lower than it was in January 2023. This speaks to a market that has cooled off significantly during this correction.
Summary and Conclusion
The Bitcoin market has remained within a lengthy consolidation phase, which is very reminiscent of the period from late 2019 and into early 2020. The capital inflow into the Bitcoin network has slowed down since the March ATH, which has challenged Short-Term Holder profitability.
However, despite experiencing a local period of net capital outflow, the confidence of new investors in the market has been remarkably robust. In recent weeks, there has also been a very modest uptick in long-side bias in perpetual futures markets.
Overall, this paints a picture of a market that has cooled down from the excesses seen in March, whilst not breaking the sentiment of many new Bitcoin investors.
Disclaimer: This report does not provide any investment advice. All data is provided for information and educational purposes only. No investment decision shall be based on the information provided here and you are solely responsible for your own investment decisions.
Exchange balances presented are derived from Glassnode’s comprehensive database of address labels, which are amassed through both officially published exchange information and proprietary clustering algorithms. While we strive to ensure the utmost accuracy in representing exchange balances, it is important to note that these figures might not always encapsulate the entirety of an exchange’s reserves, particularly when exchanges refrain from disclosing their official addresses. We urge users to exercise caution and discretion when utilizing these metrics. Glassnode shall not be held responsible for any discrepancies or potential inaccuracies. Please read our Transparency Notice when using exchange data.
- Join our Telegram channel.
- For on-chain metrics, dashboards, and alerts, visit Glassnode Studio