An Early Black Friday
Bitcoin’s rally to $126.1k reversed amid macro stress and a $19B futures deleveraging, one of the largest in history. With ETF inflows weakening and volatility spiking, the market is in a reset phase, characterized by flushed leverage, cautious sentiment, and recovery hinging on renewed demand.


Executive Summary
- Bitcoin’s rally to a new all-time high at $126.1k reversed amid macro tensions and a $19B futures deleveraging, one of the largest in history. The drop below the $117k–$114k cost-basis zone placed top buyers in loss and exposed renewed market fragility.
- On-chain data show continued Long-Term Holder distribution since July and weaker ETF inflows (-2.3k BTC this week), indicating fading institutional demand. Meanwhile, spot markets experienced a sharp but orderly sell-off, with Binance-driven selling partially offset by buying on Coinbase.
- Futures markets underwent a historic leverage flush, with the Estimated Leverage Ratio collapsing to multi-month lows and funding rates plunging to 2022 FTX levels, signalling peak fear and forced liquidations.
- In the options market, open interest and volume rebounded quickly, but volatility spiked to 76%, and short-dated skew flipped to +17% put-rich before stabilizing. The market remains in a reset phase, awaiting renewed demand to confirm recovery.
On-Chain Insights
Bitcoin’s rally above the $114k–$117k supply cluster culminated in a new all-time high at $126.1k before losing momentum. The renewed sell pressure, amplified by concerns over escalating U.S.–China tariff tensions, triggered a sharp market-wide deleveraging, with futures open interest contracting by more than $19B.
In this edition, we examine the aftermath of this correction through both on-chain and off-chain lenses to assess the current state of market sentiment and structural resilience.
From Euphoria to Fragility
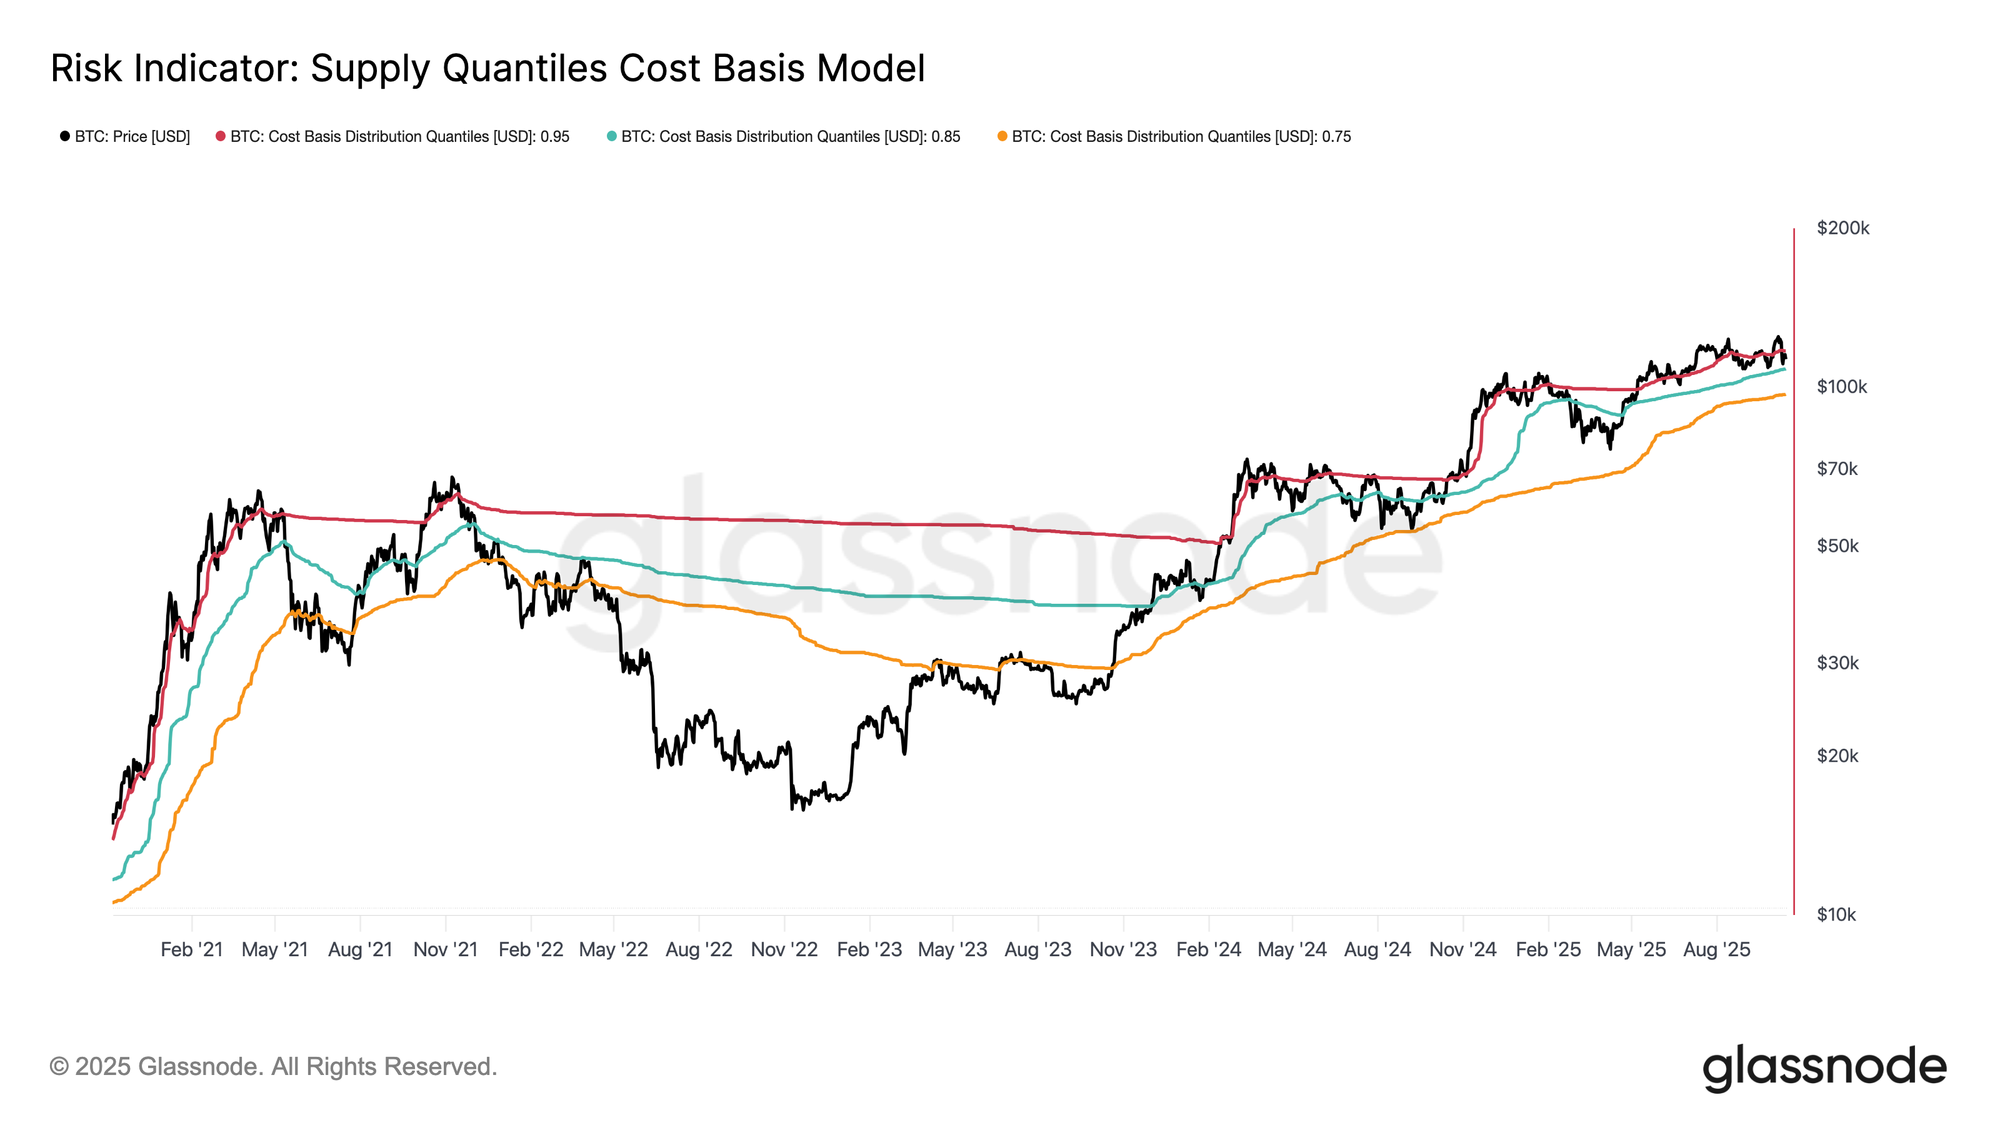
This latest contraction is particularly concerning, as it marks the third instance since late August where Bitcoin’s spot price has dipped below the 0.95-quantile price model ($117.1k)—a level where over 5% of supply, primarily held by top buyers, sits at a loss. Price now resides within the 0.85–0.95 quantile range ($108.4k–$117.1k), retracing from the euphoric phase of the recent rally.
Without a renewed catalyst to lift prices back above $117.1k, the market risks deeper contraction toward the lower boundary of this range. Historically, when price fails to hold this zone, it has often preceded prolonged mid- to long-term corrections, making a sustained drop below $108k a critical warning signal of structural weakness.
Long-Term Holders Continue to Distribute
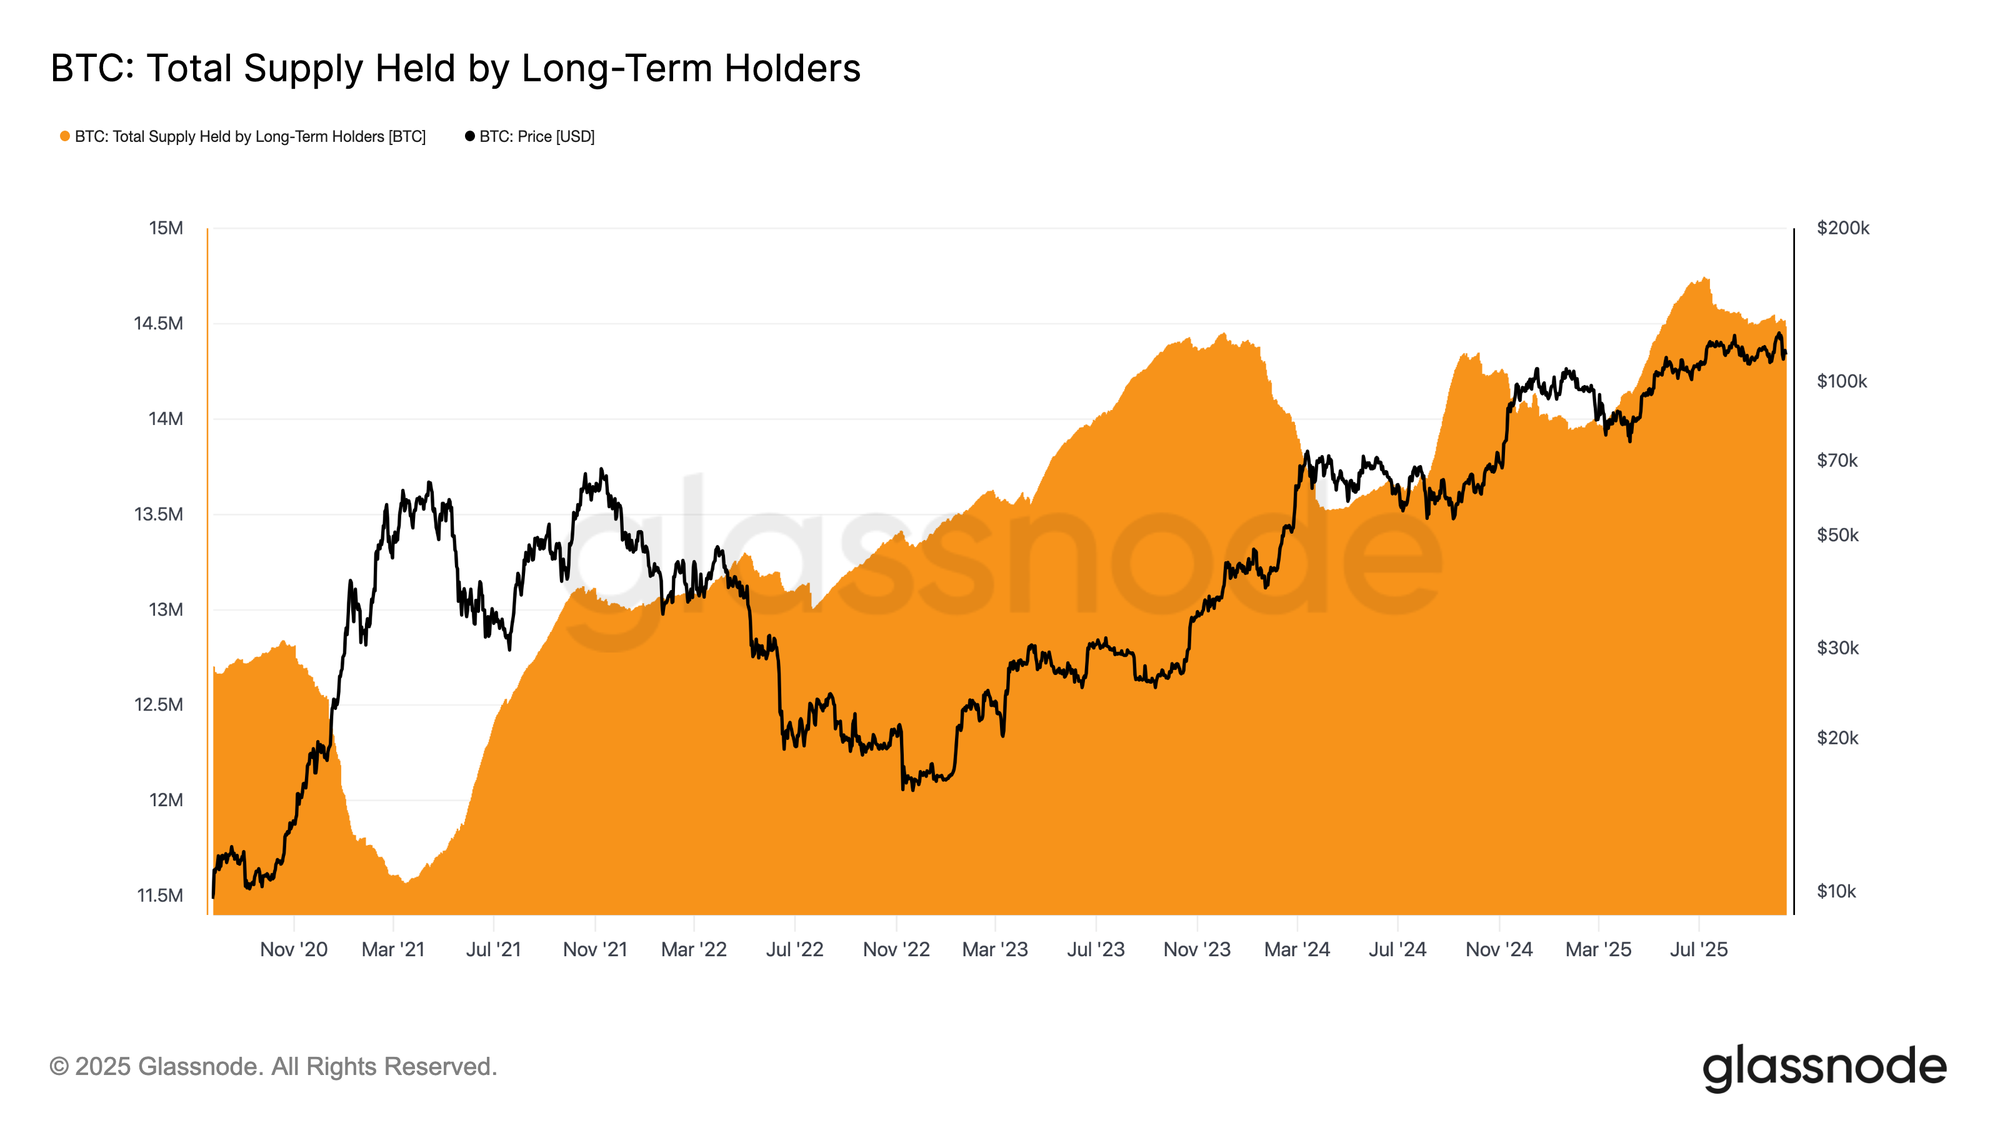
Adding to the market’s inability to sustain its euphoric phase, the persistent Long-Term Holder (LTH) distribution since July 2025 has further constrained upside momentum. During this period, the LTH supply has declined by roughly 0.3M BTC, highlighting steady profit realization among mature investors. This ongoing sell-side pressure underscores the risk of demand exhaustion, with the market likely to enter a consolidation phase. Should distribution persist without a corresponding inflow of new demand, periodic corrections or localized capitulation events may emerge before equilibrium is restored.
Off-Chain Insights
ETF Flows Lose Momentum
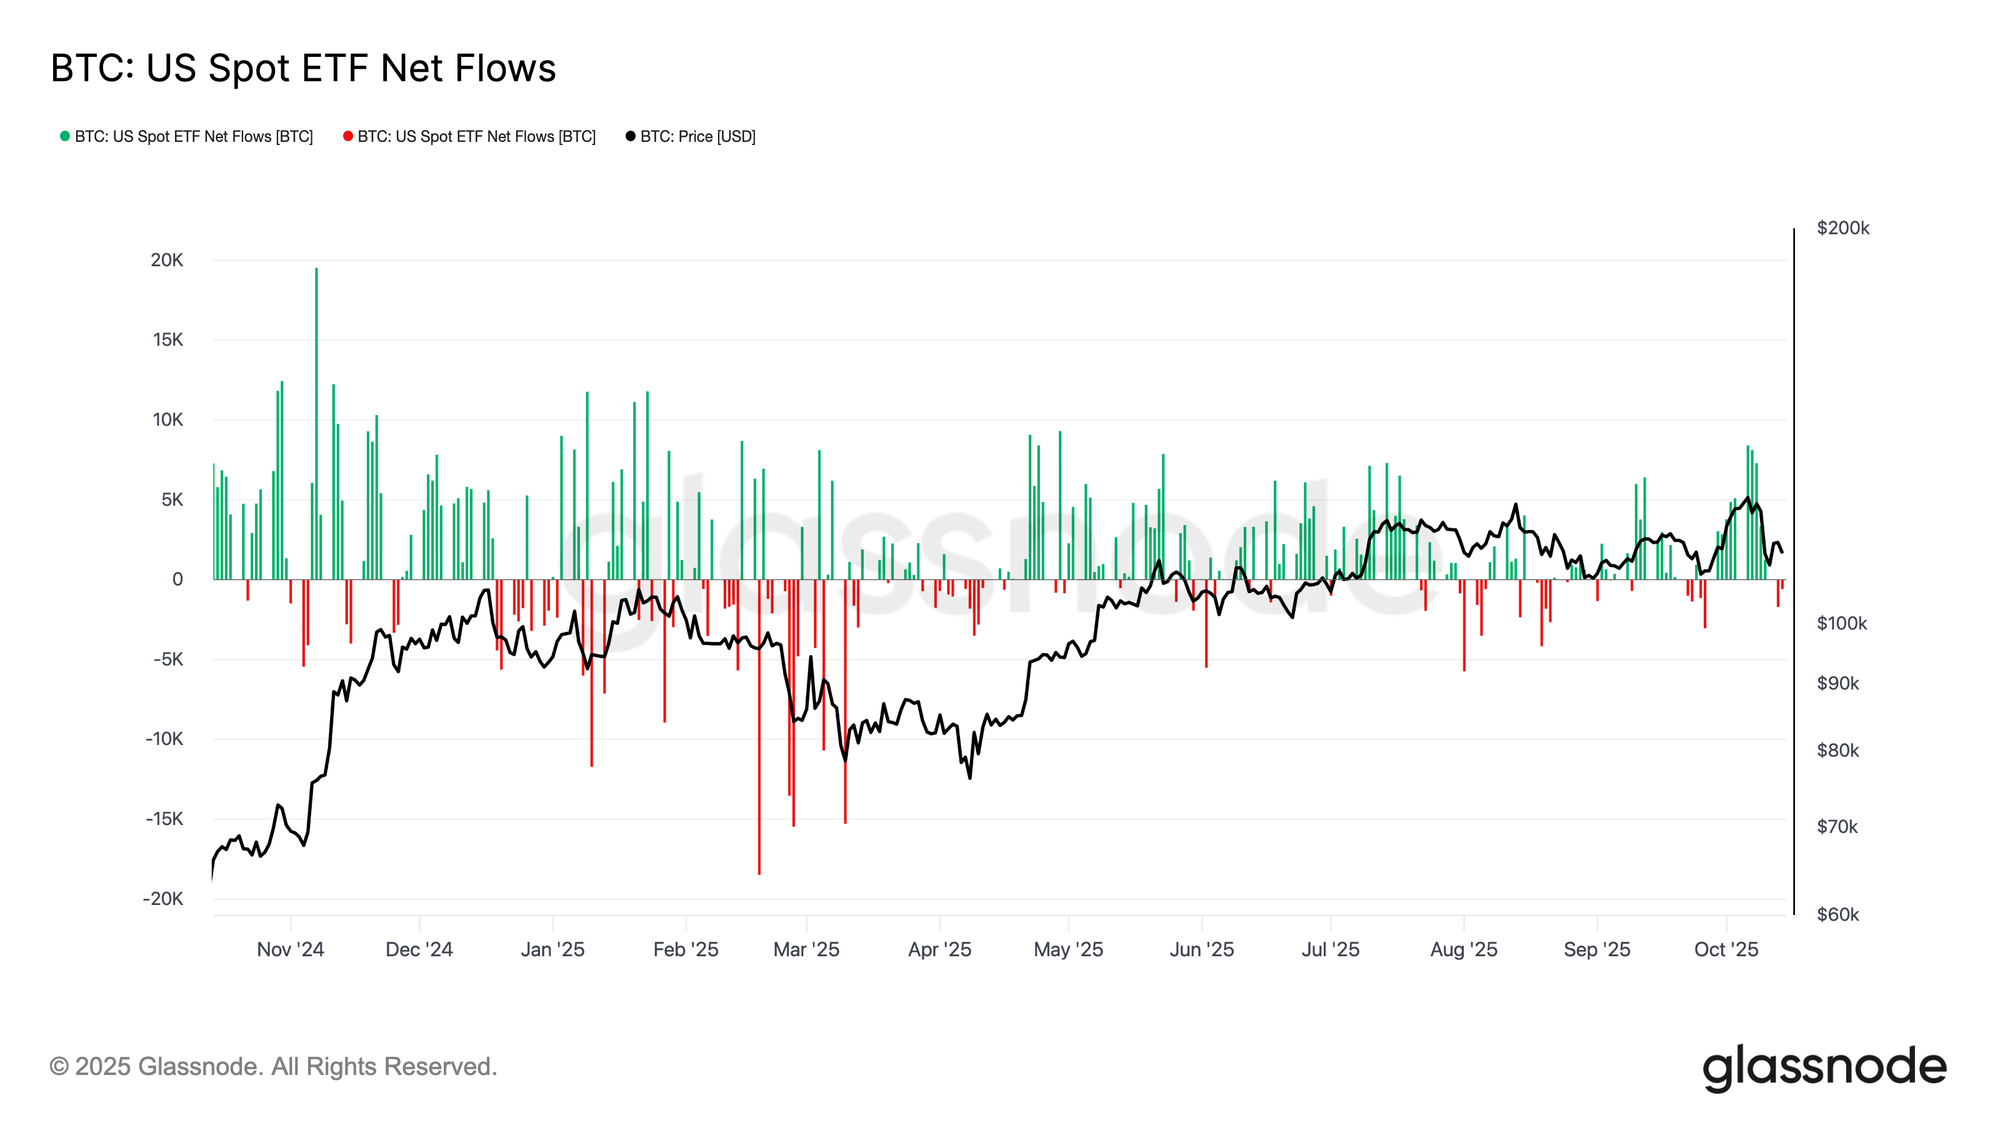
Following the largest liquidation event in Bitcoin’s history, U.S. spot ETF flows have weakened in tandem with price. While the derivatives market underwent extreme deleveraging, ETF investors also showed mild selling pressure, with cumulative netflow turning negative by 2.3k BTC so far this week. This behavior contrasts with prior capitulation phases, where outflows typically accelerated alongside price declines.
The current moderation suggests hesitation rather than panic. However, sustained weakness or a prolonged delay in ETF inflows returning to strength would signal demand-side fragility, undermining one of the key drivers behind Bitcoin’s prior rallies.
Spot Selling Pressure
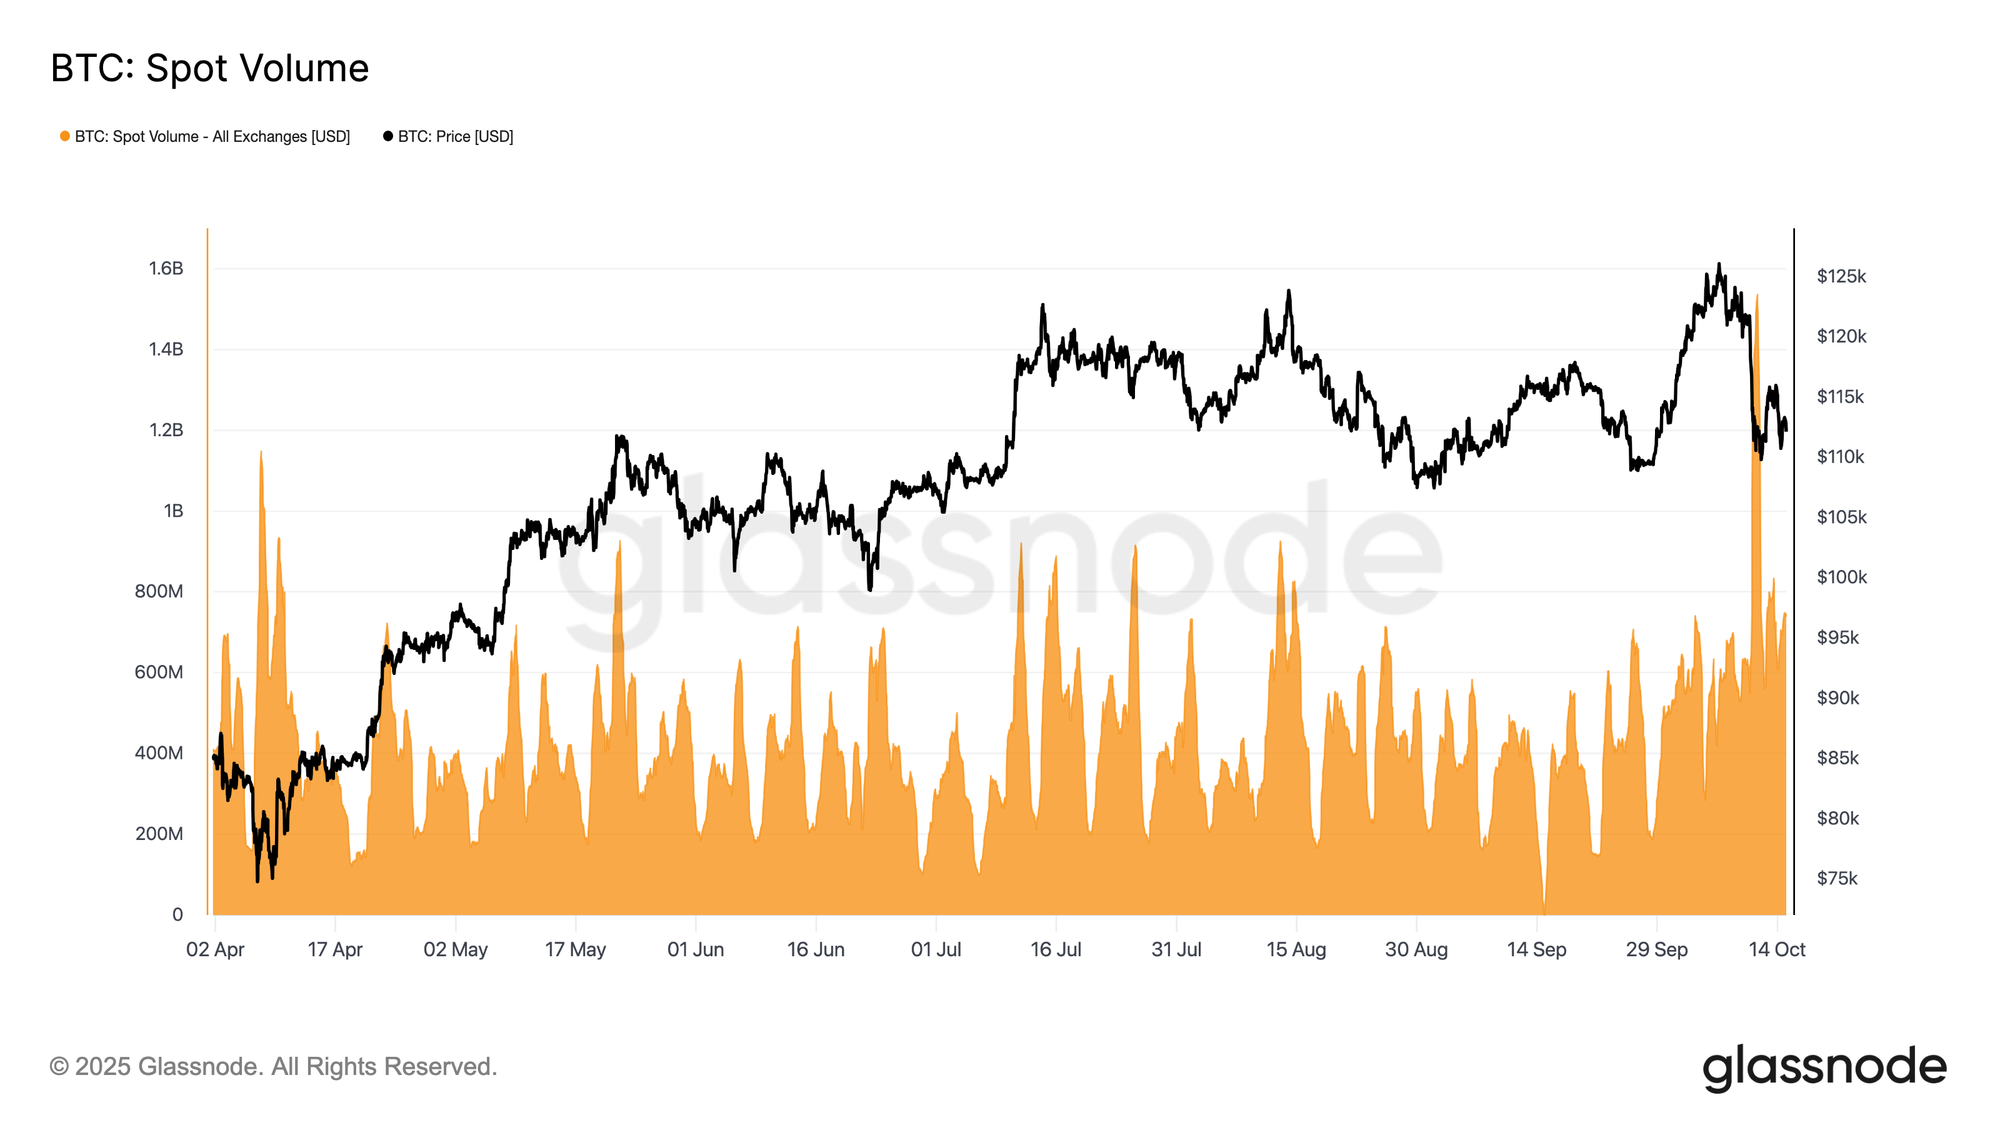
During the recent liquidation cascade, spot trading volumes surged sharply, marking one of the highest levels recorded this year. The spike reflects intense market activity as traders rushed to adjust positions amid heightened volatility.
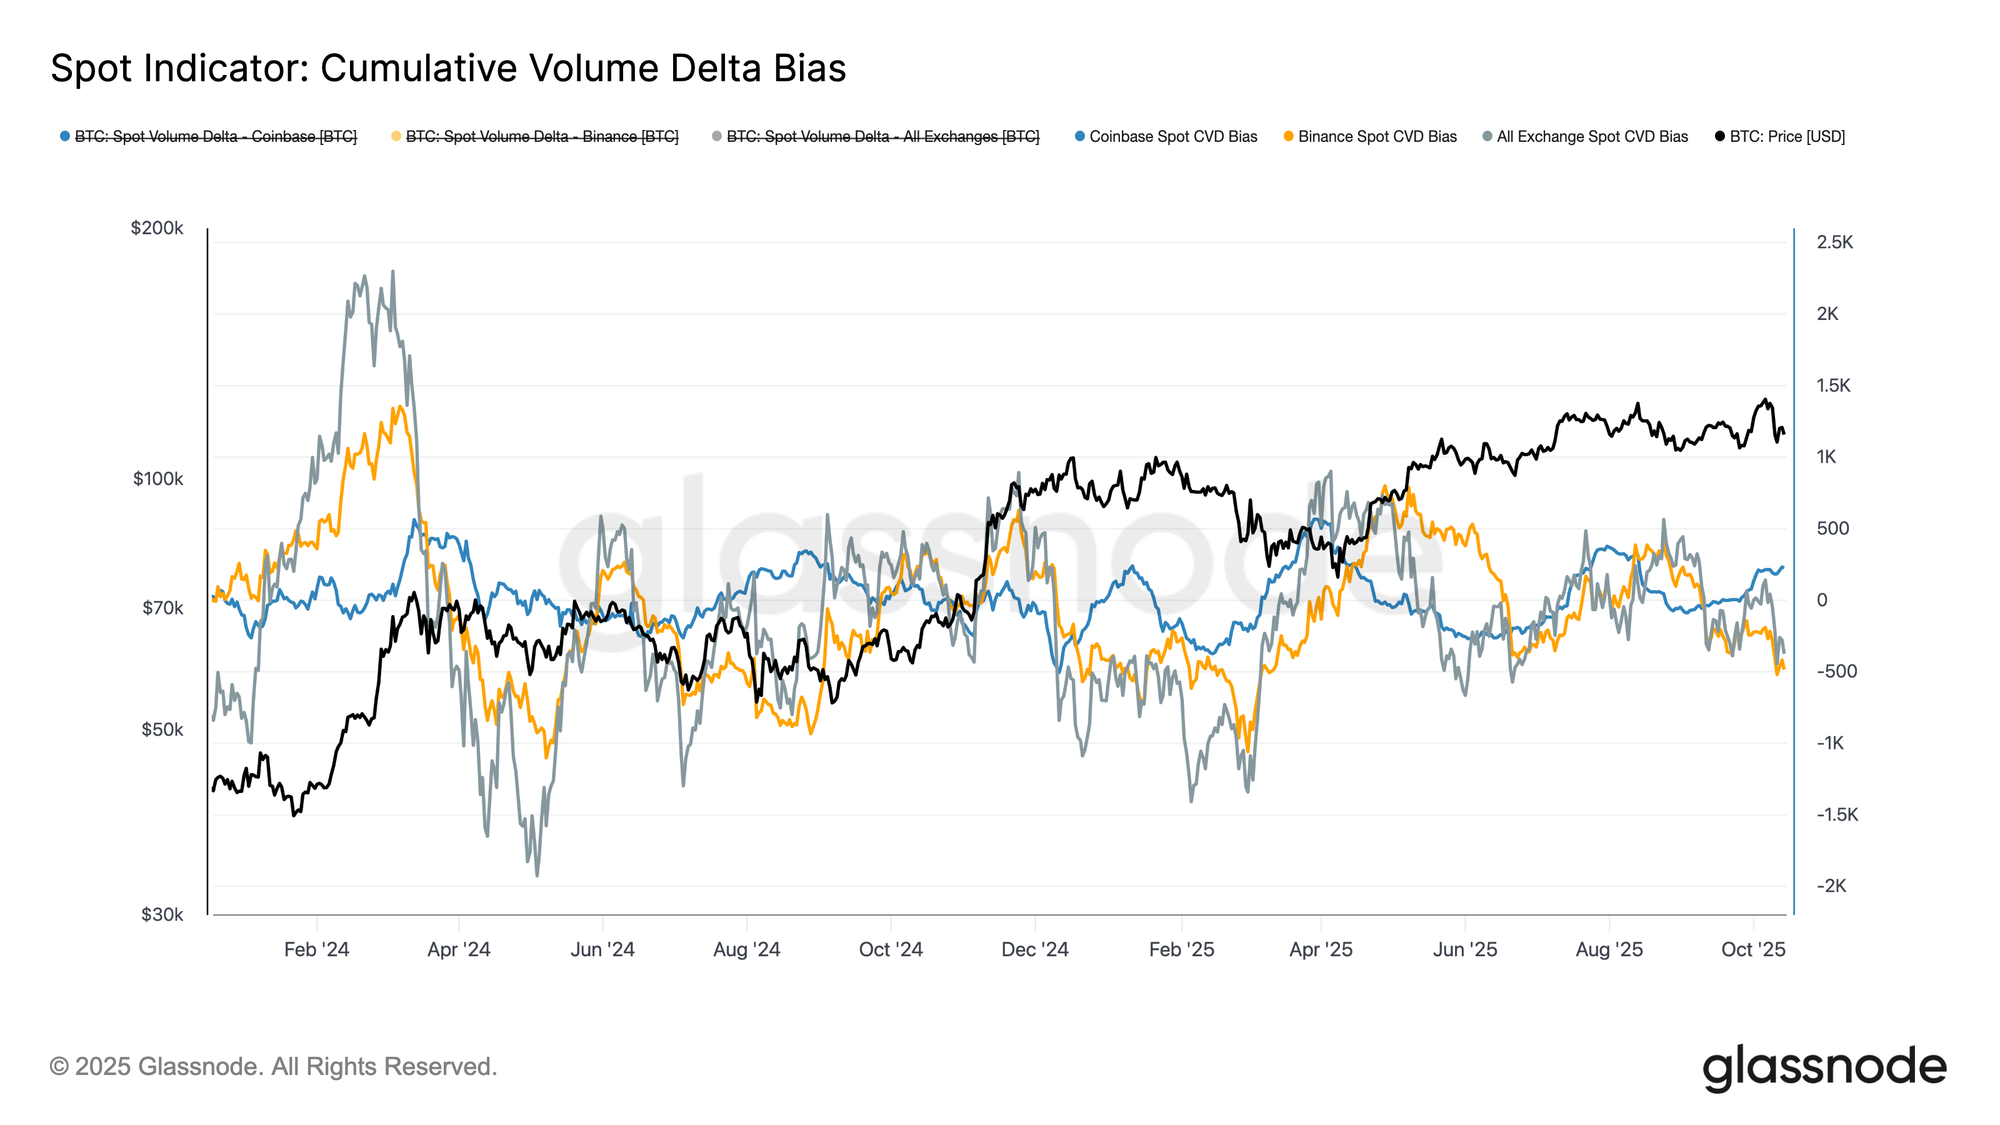
Pairing this spike in spot volume with the Cumulative Volume Delta Bias (CVDB) — which measures deviations from the 90-day median of cumulative trade flow — reveals a notable divergence across major exchanges. Binance faced heavy taker sell pressure, while Coinbase saw net buying activity, suggesting institutional participants were absorbing supply on U.S. venues.
The aggregated CVDB shows only a mild net sell bias, far less severe than the sharp spot capitulation observed in late February 2025. This indicates that, despite elevated volatility, the recent drawdown reflected localized deleveraging rather than a broad investor exit.
A Futures Market Breakdown
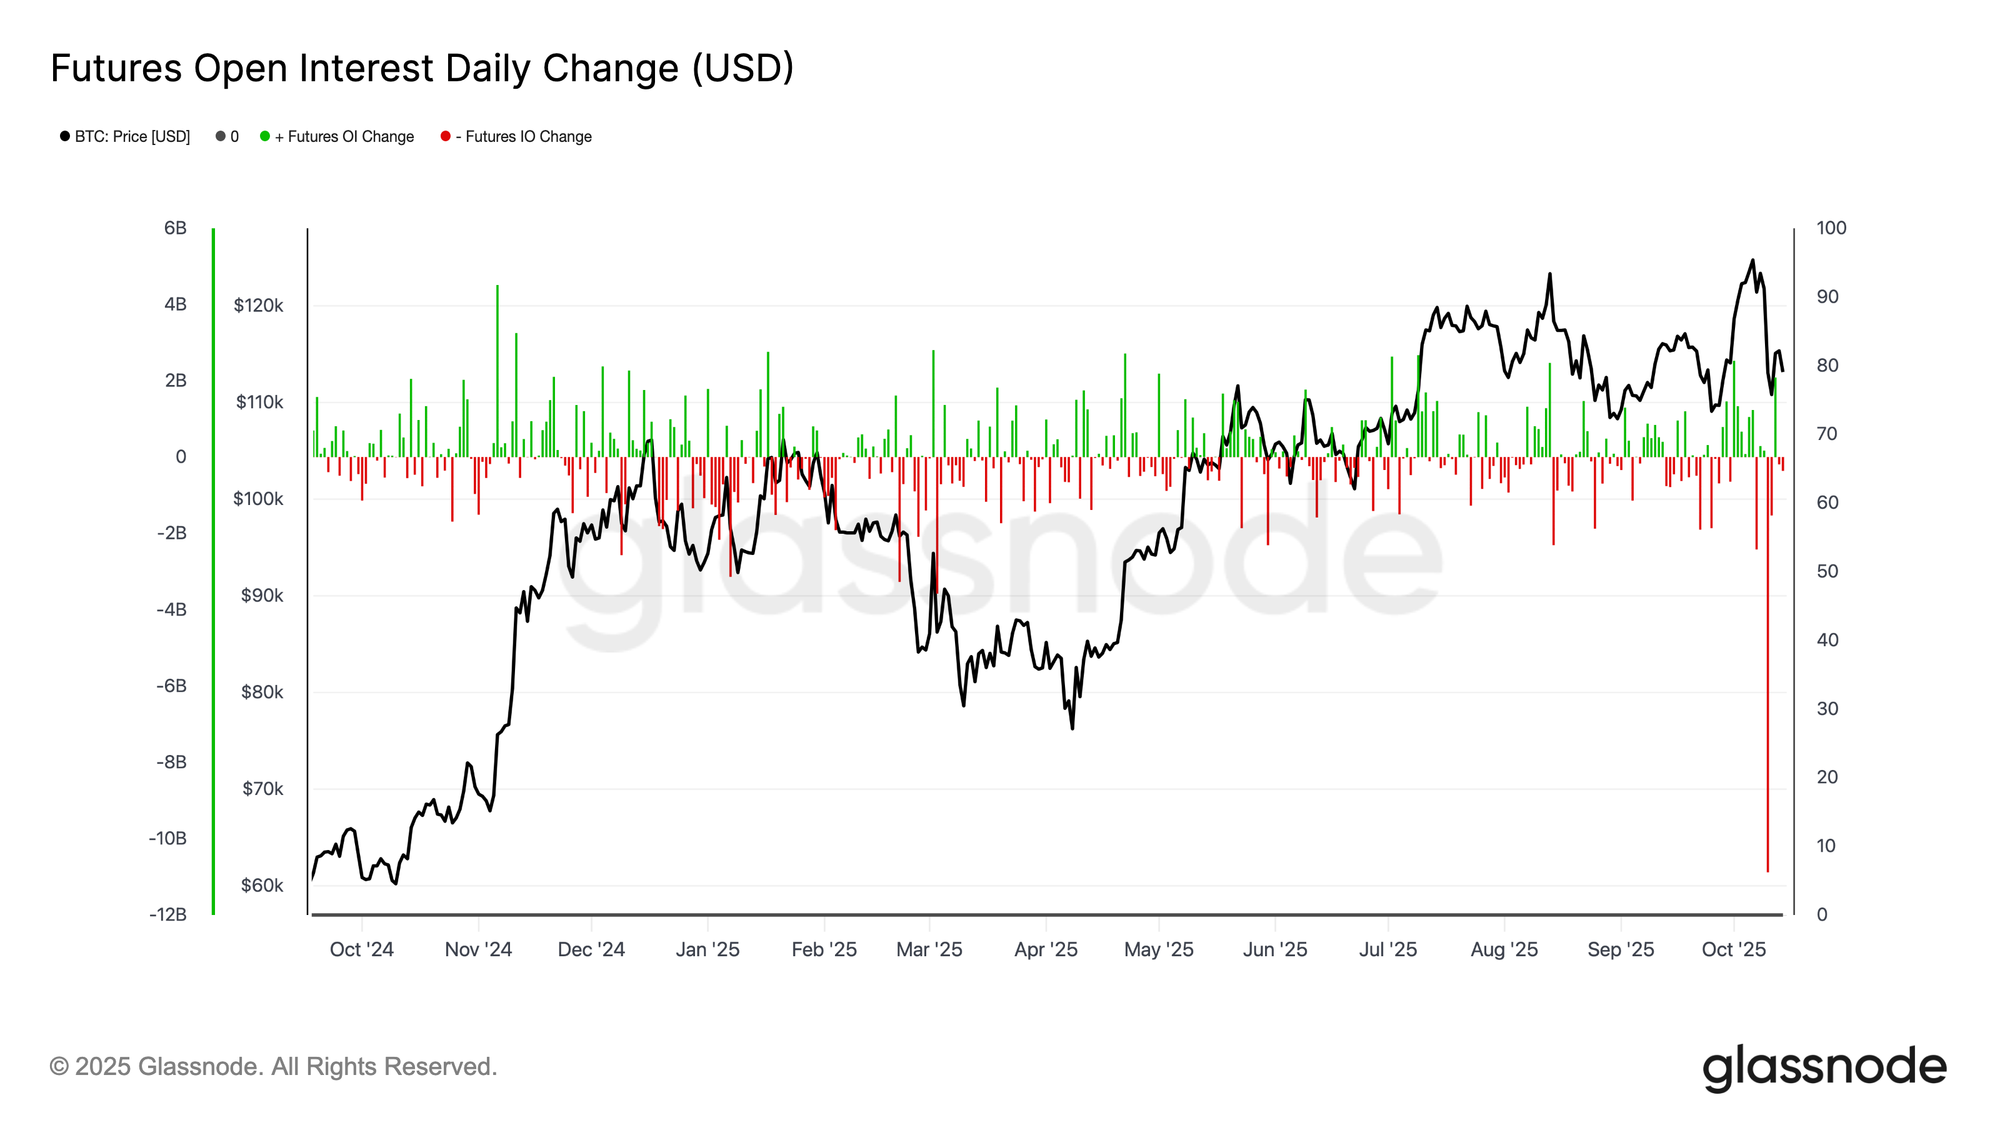
The recent collapse in Bitcoin futures open interest ranks among the largest single-day contractions on record, erasing more than $10 billion in notional positions. This marks a major derivatives market flush-out, comparable in magnitude to the May 2021 liquidation and the 2022 FTX unwind.
The steep decline reflects widespread forced deleveraging, as margin calls triggered liquidations across both long and short positions. Notably, with Bitcoin’s price still holding above key on-chain support, the event appears to be driven primarily by leverage compression rather than broad spot selling — a structural reset rather than a full capitulation.
Historic Leverage Flush
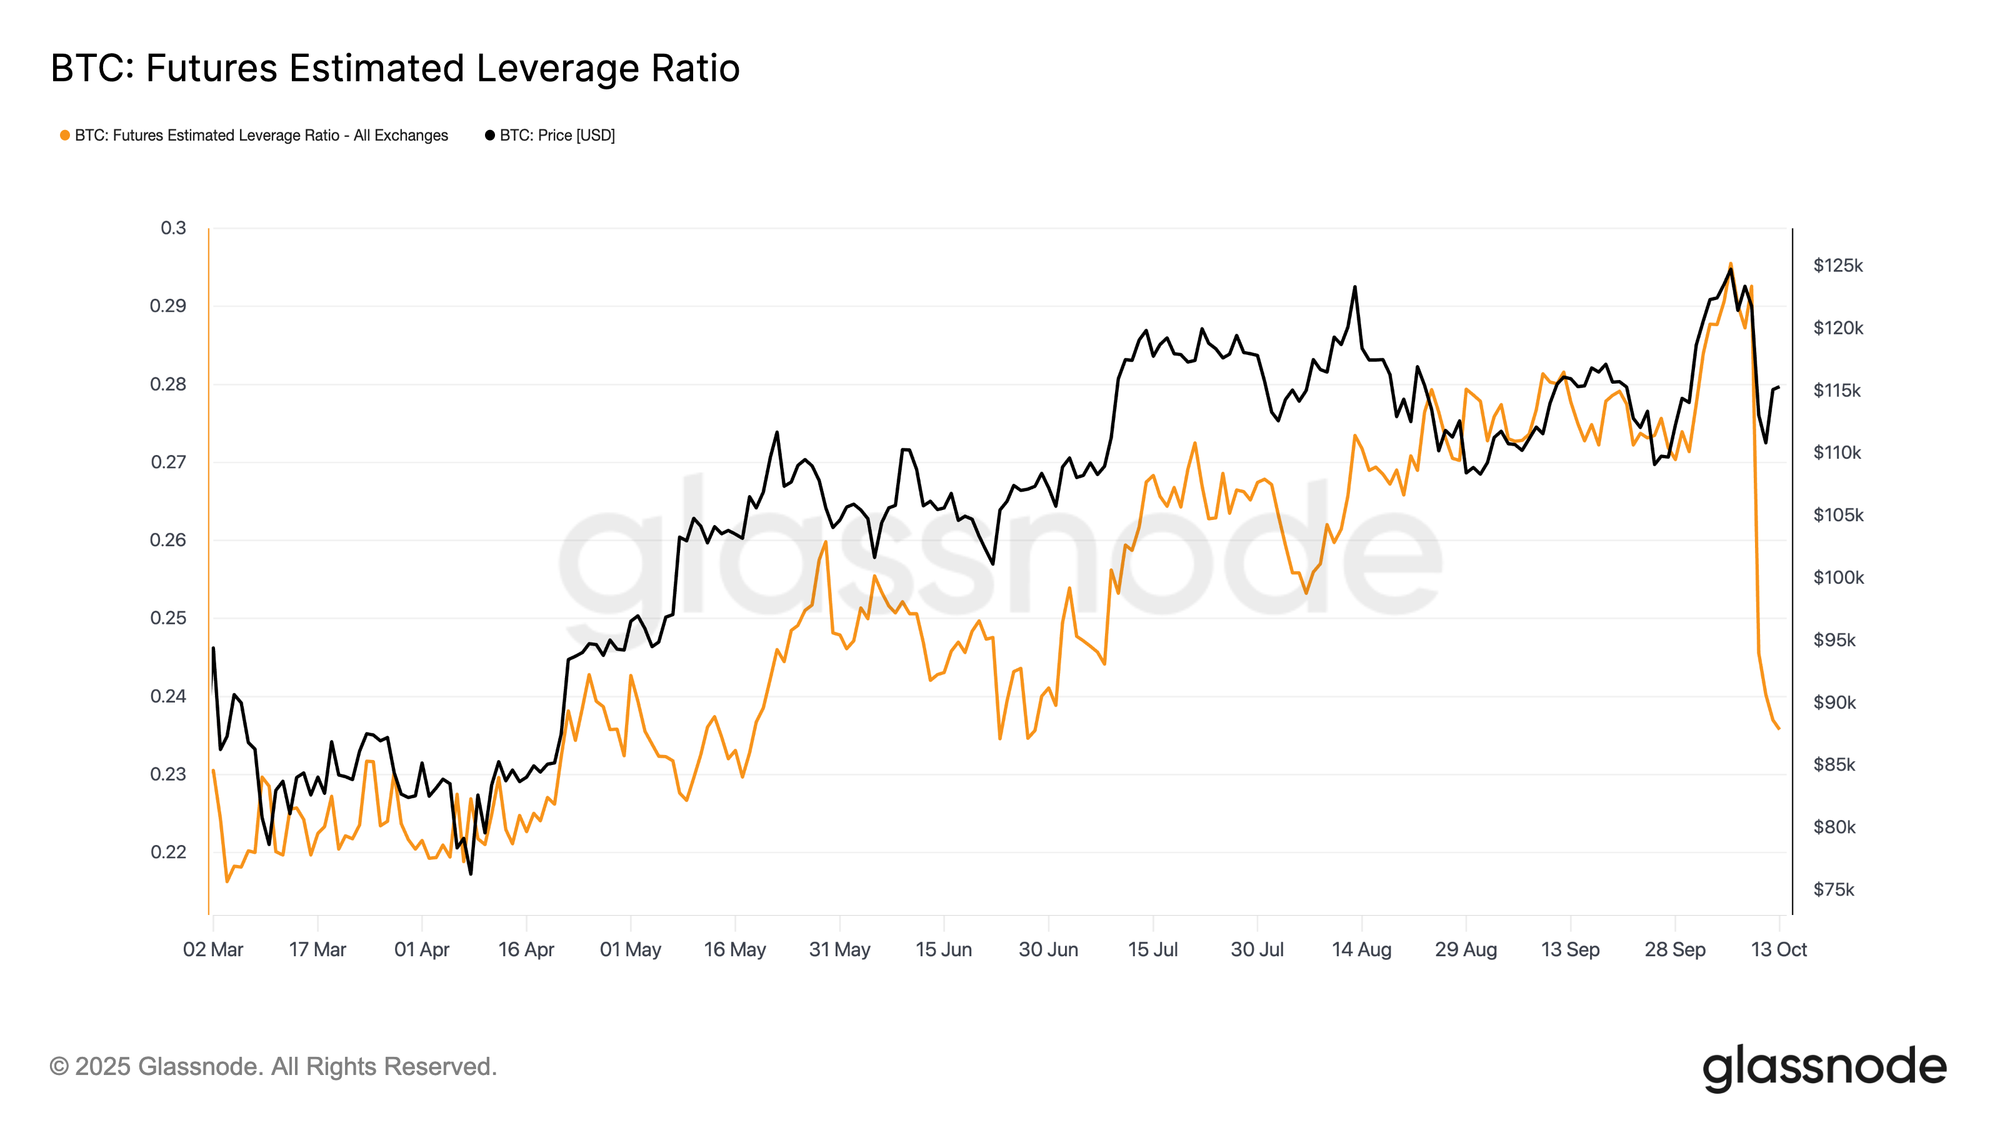
Following the sharp contraction in futures open interest, the Estimated Leverage Ratio, open interest relative to exchange balances, also collapsed to multi-month lows. This historic deleveraging event cleared excessive leverage across the system, marking one of the largest single-session resets on record.
The magnitude of the drop suggests widespread unwinding of positions, also extending to altcoin markets. While painful, such flush-outs help reduce systemic risk and lay the groundwork for a more stable market structure ahead.
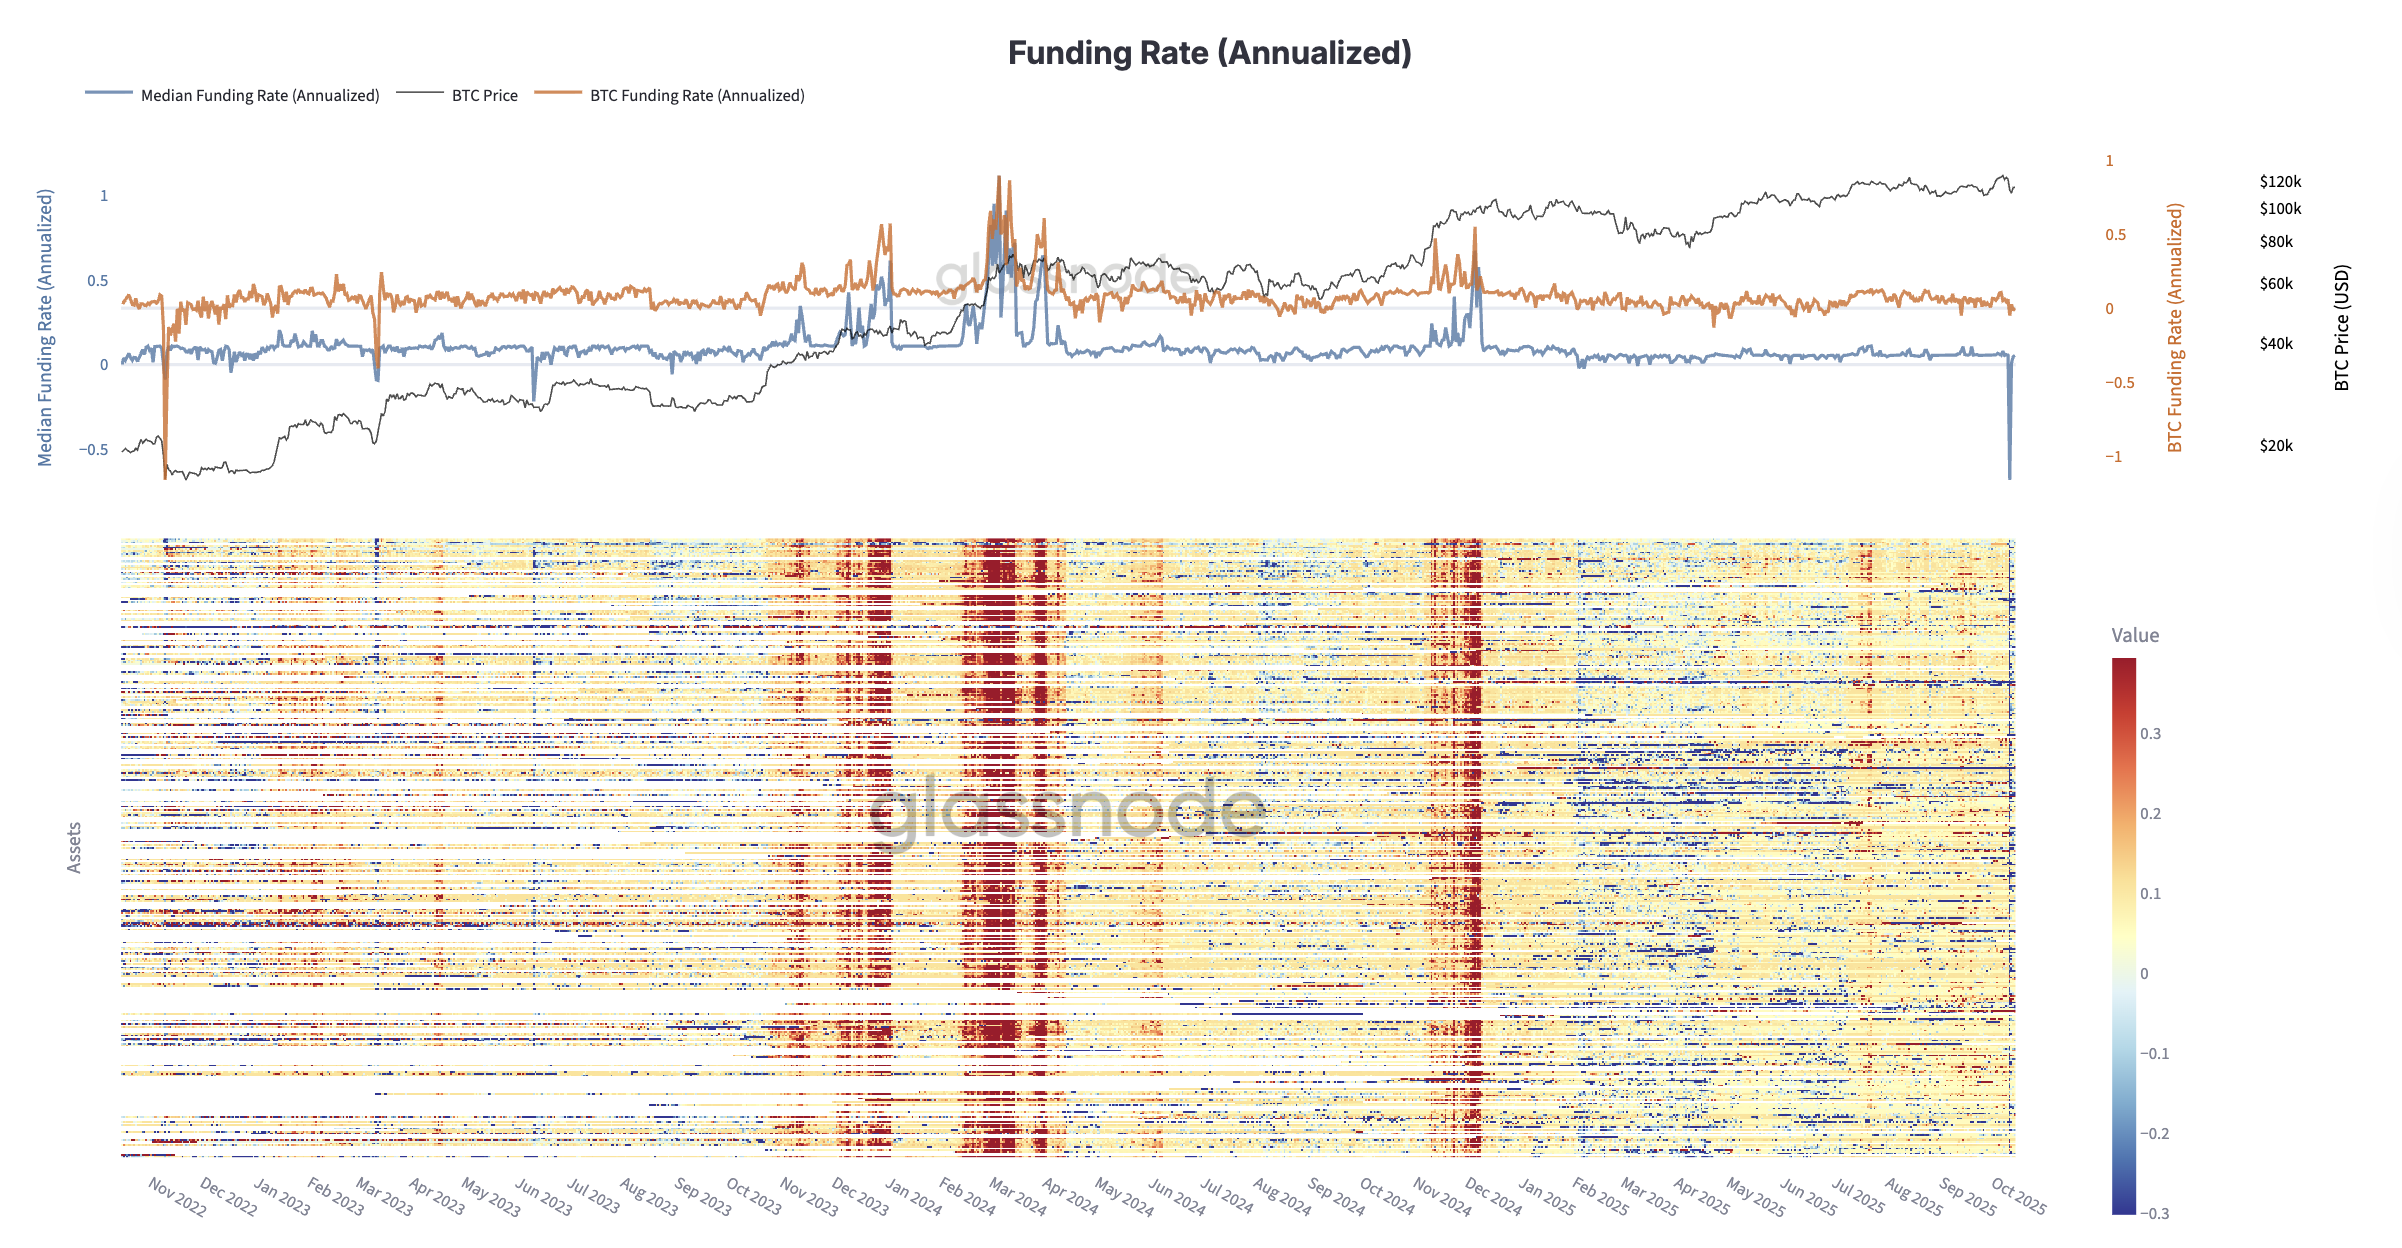
Funding Rates Plunge to 2022 FTX Levels
Following the historic leverage flush, the futures market stress deepened as funding rates collapsed to levels not seen since the FTX fallout in late 2022.
Across perpetual futures, annualized funding briefly turned sharply negative, showing traders paying a premium to stay short after bullish leverage was wiped out. This marks a complete sentiment reversal, with participants rapidly de-risking amid forced liquidations. Historically, such extreme funding resets have coincided with peak fear and the final stages of deleveraging, often cleansing excess leverage and restoring balance for a healthier recovery phase in the mid-term.
Options Market
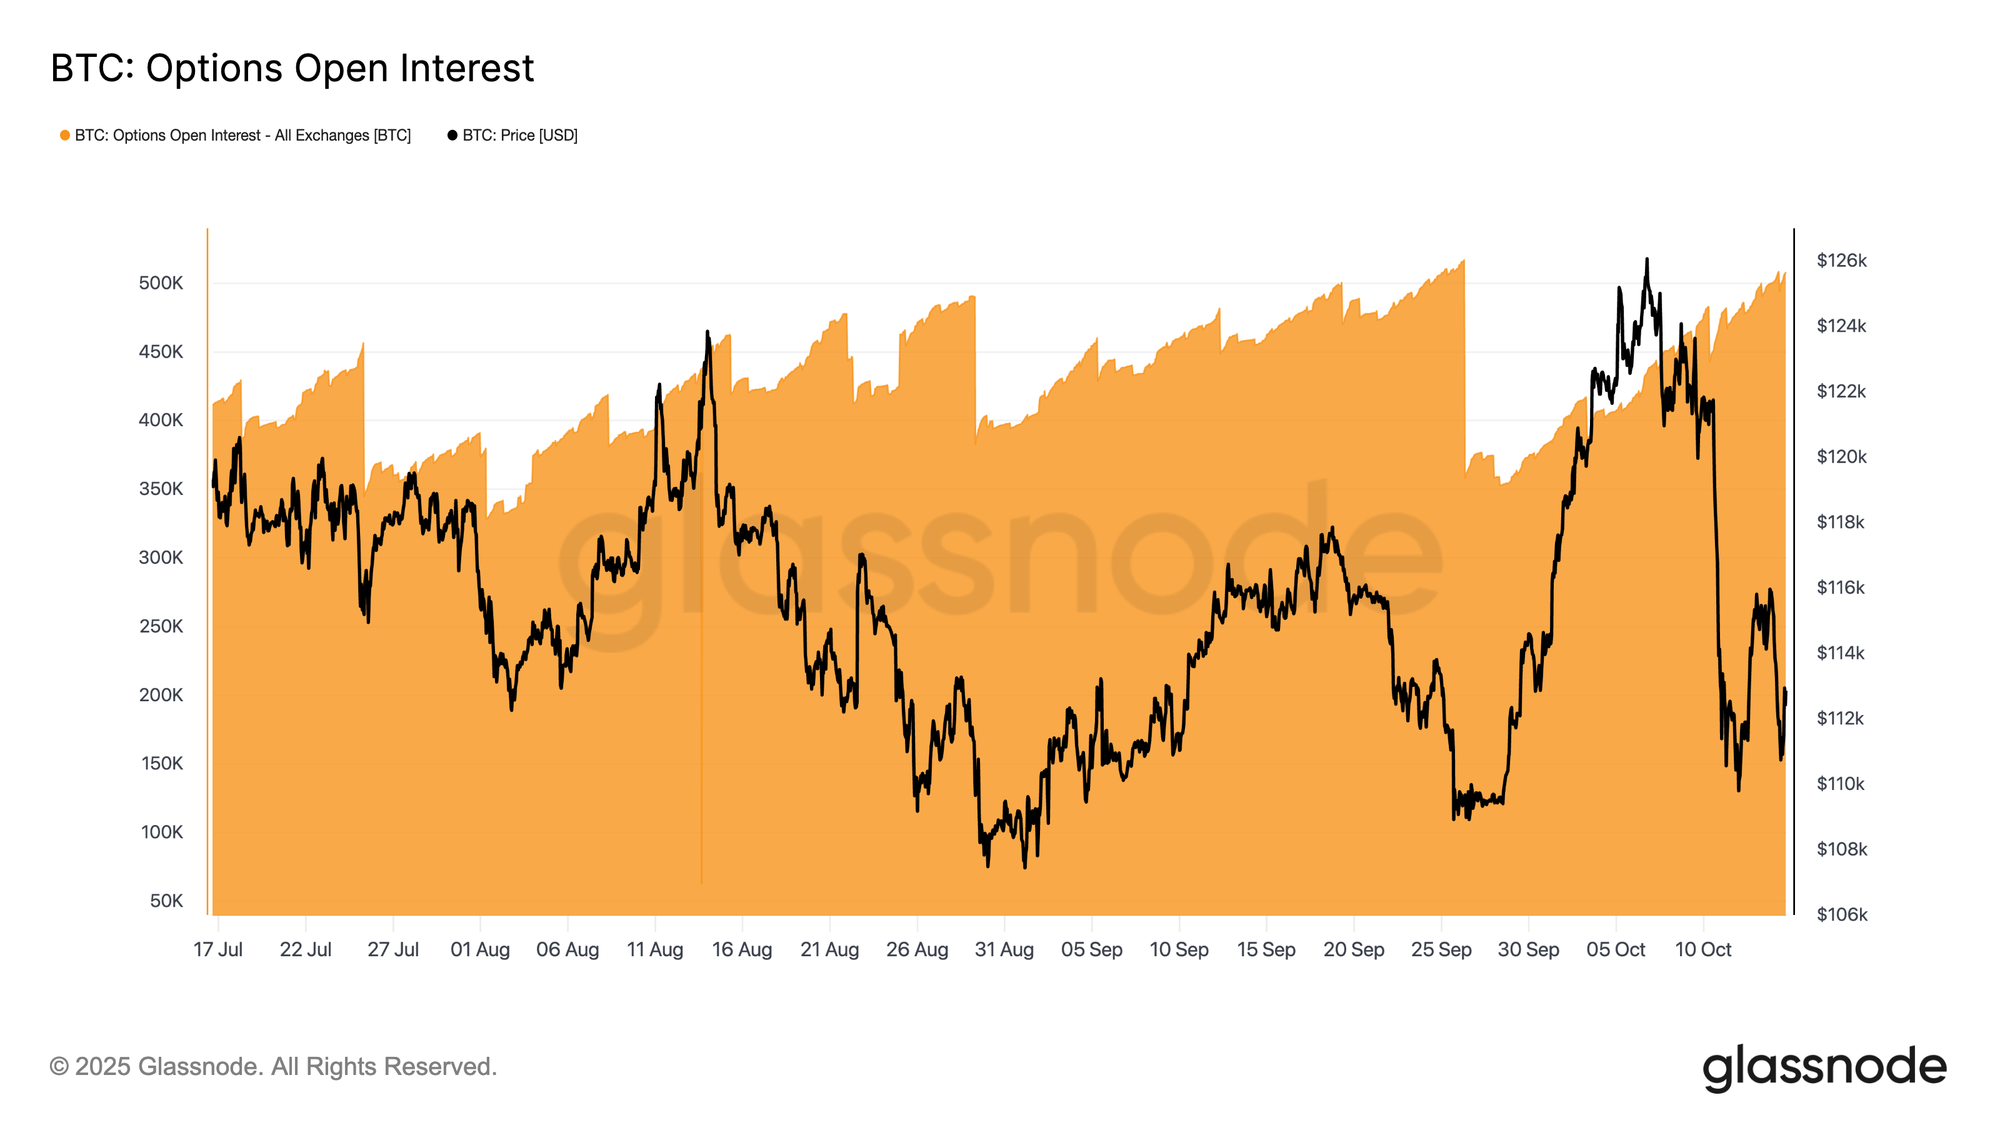
Options OI Rebuilt Fast and Close to ATH
With futures markets undergoing a deep deleveraging, attention now turns to the options market, where activity has recovered remarkably quickly.
It took little time for Bitcoin options open interest to rebuild following the major expiry on September 26. OI has already climbed back near its all-time highs, underscoring how rapidly traders reloaded exposure once positions were cleared. Recent volatility and liquidations likely accelerated this recovery, as participants sought to hedge against risk and manage downside exposure. The swift rebound highlights robust engagement and continued reliance on options for both protection and tactical positioning in a volatile environment.
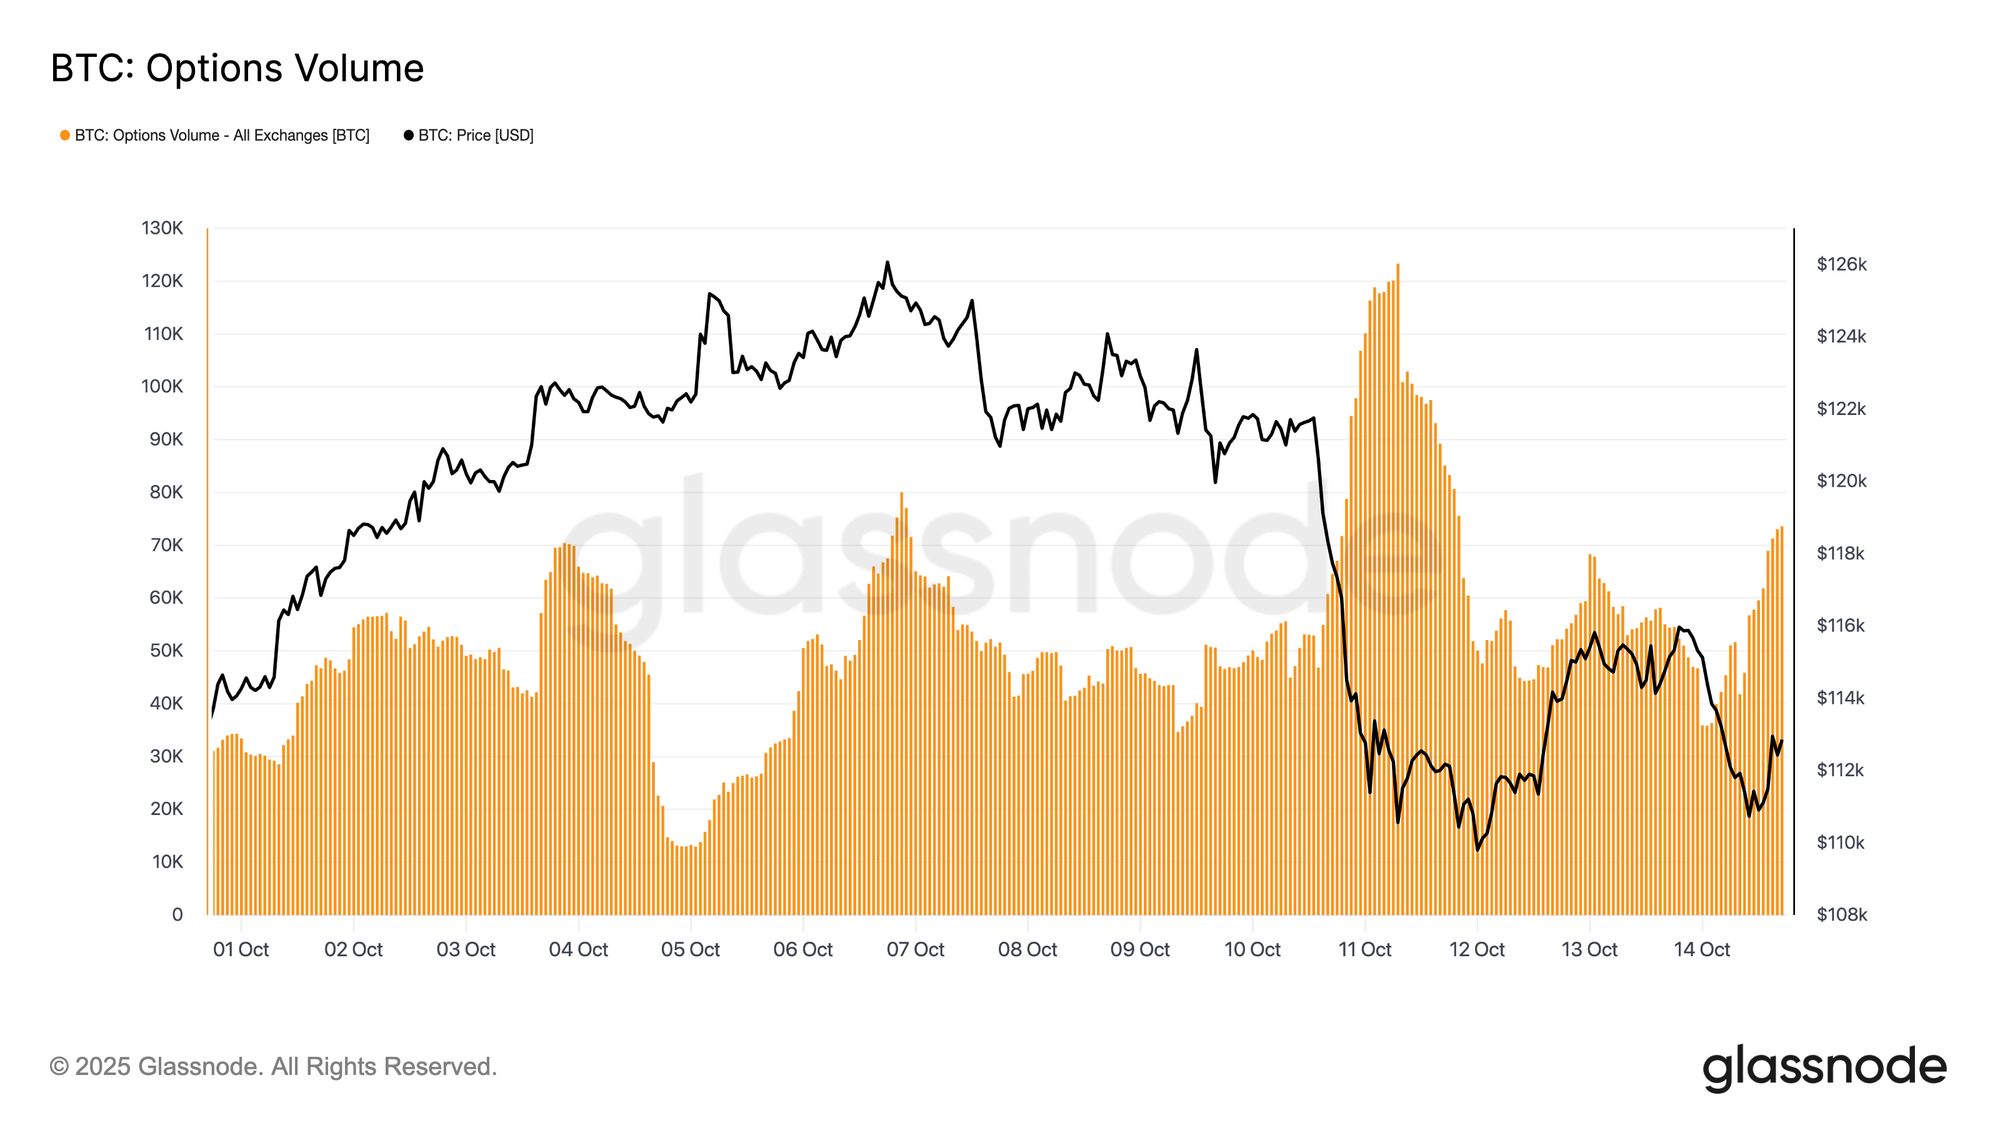
Options Volume Surged as BTC Volatility Spiked
Following the rapid increase in open interest, the options market experienced a surge in trading activity as volatility spiked. Following Bitcoin’s sharp drop late Friday, volumes rose dramatically into Saturday as traders scrambled to adjust risk. The data show clear bursts of activity during and immediately after the selloff.
This reaction was driven by gamma dynamics; short gamma traders were forced to buy back exposure to manage margin and avoid liquidations, while long gamma participants supplied liquidity at elevated premiums.
The spike in volume reflected a market in stress-management mode, with hedges recalibrated, liquidity tightening, and demand for short-term protection surging. The next step is to assess how implied volatility evolved in response to this dislocation.
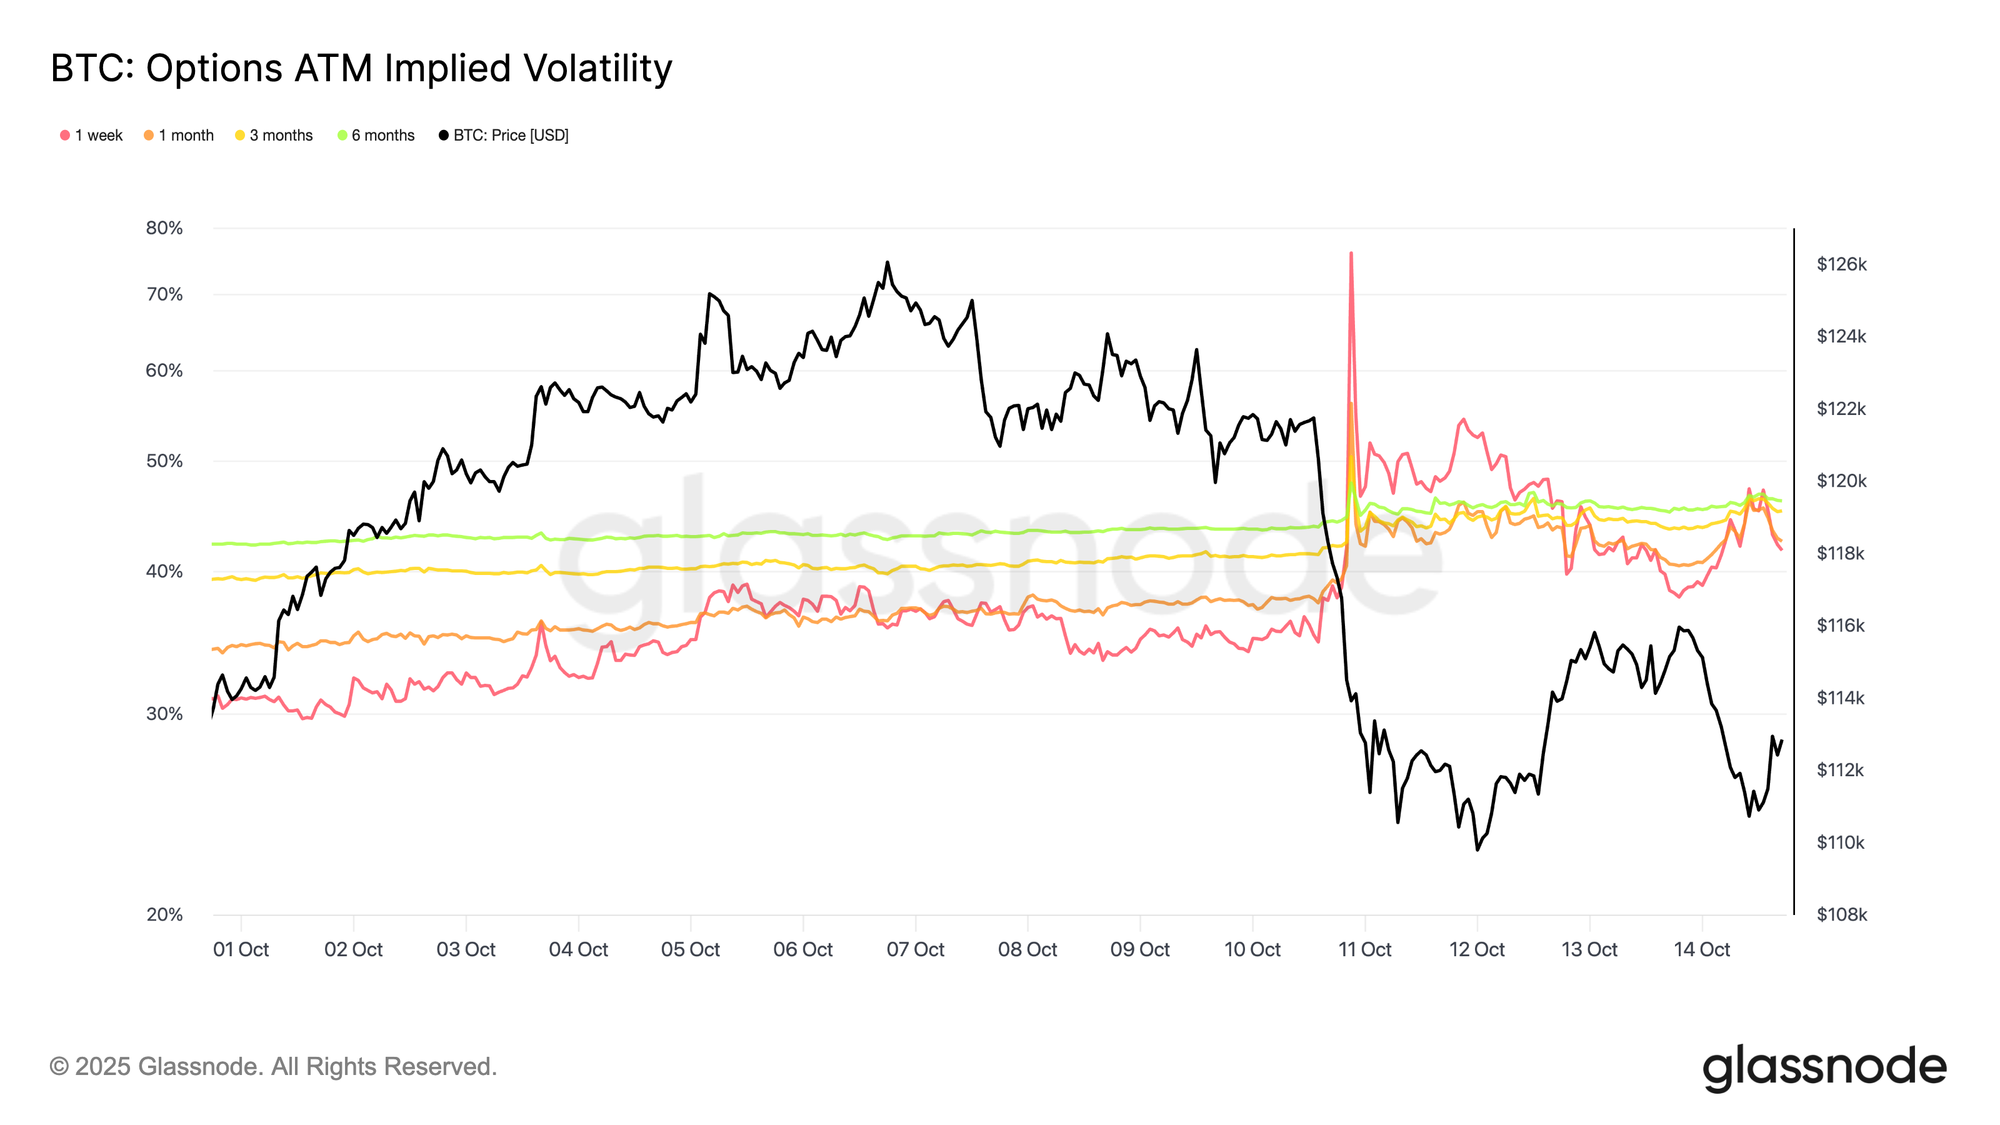
Front-End Volatility Blew Out as Liquidations Hit
As the liquidation cascade accelerated around 7 PM UTC last Friday, 1-week implied volatility surged from 35% to a peak of 76%, its highest level since April 2025. At those highly inflated levels, gamma sellers quickly stepped in to sell volatility, capitalizing on the squeeze.
The spike in vol was a textbook volatility squeeze: short-dated short-vol positions were forced to cover and roll further out, driving the front end sharply higher. In practice, that means traders had to buy back their short-dated options at much higher prices while simultaneously selling longer-dated options to re-establish short exposure further out the curve. This flow created a temporary dislocation, with short tenors exploding higher while longer maturities stayed relatively anchored, leaving a steep and distorted curve.
The gap between short- and long-dated vols came from that imbalance: short-term panic and forced buying on the front end, versus longer maturities where traders were already fading the move and selling vol as liquidation pressure began to ease.
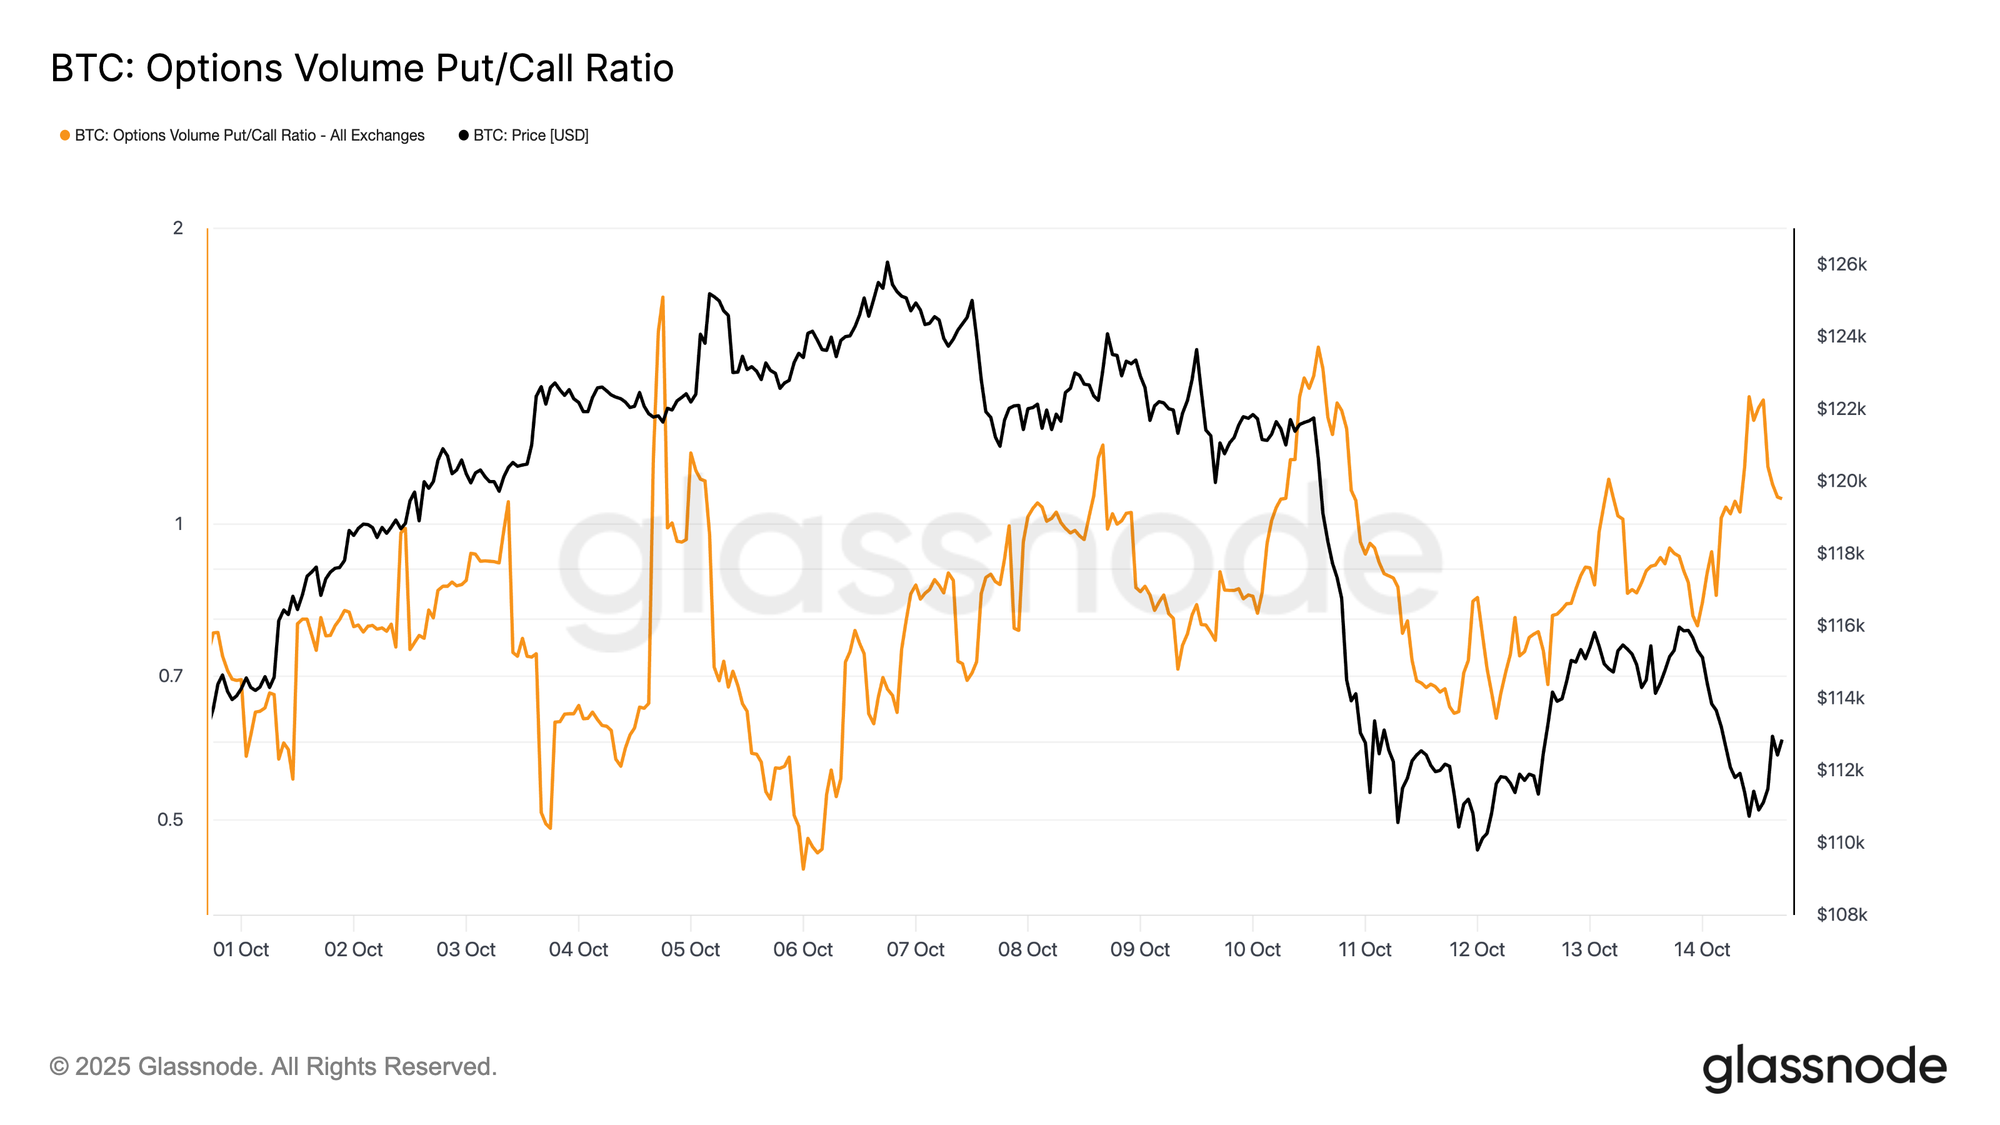
Put/Call Volume Ratio Spiked Pre-Crash
Ahead of the market’s sharp decline, the put/call volume ratio, measuring the relative share of traded puts versus calls, surged dramatically.
On Friday, as Bitcoin hovered near $121.7k, the ratio jumped above 1.0, closing at 1.41 and peaking near 1.51, up from roughly 0.8 earlier in the week. While not always predictive of downside, such abrupt spikes often signal structural stress or concentrated hedging, suggesting traders were actively positioning for risk even before the broader liquidation cascade began.
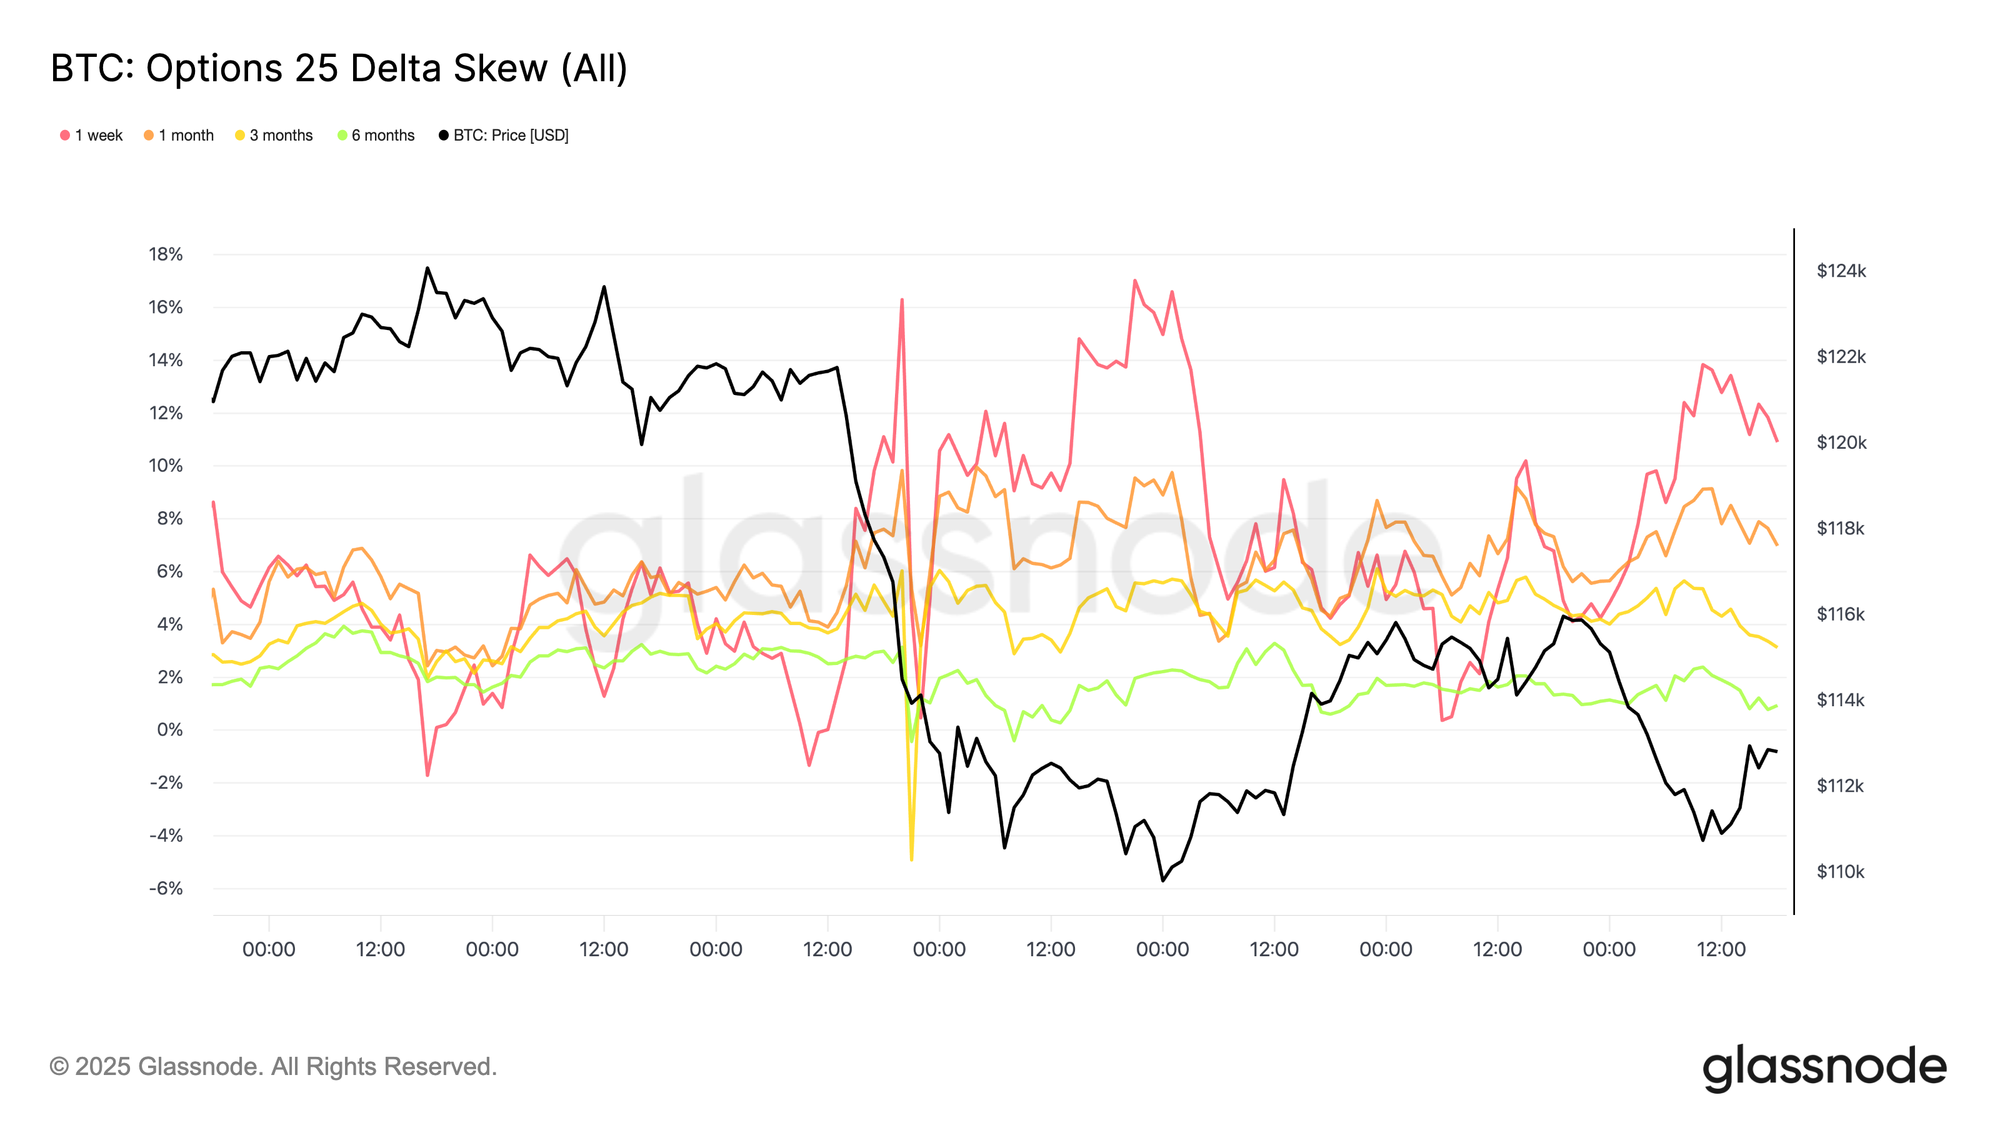
Fear Driving Up the Front-End Skew
Following the extreme volatility surge, attention shifts to the options skew, which vividly captured traders’ flight to protection. The 25-delta skew (calculated as Put - Call ) exploded across expiries after the largest liquidation in BTC options history, as demand for downside hedges soared.
Before the crash, short-dated skew had nearly normalized, with the 1-week tenor around –1.3%, implying a slight call premium. As fear took hold, it flipped violently to +17%, marking one of the sharpest short-term repricings of downside optionality this year.
As volatility cooled, short-dated skew retraced while longer maturities stayed anchored; the 3- and 6-month tenors even showed slightly lower put premiums. This steadiness on the long end suggests traders used the dip to accumulate long-dated calls into 2026, favouring strategic exposure over short-term panic protection.
Conclusion
Bitcoin’s rally to a new all-time high at $126.1k quickly reversed as macro stress and extreme leverage triggered one of the largest $19B deleveraging events in derivatives history.
The drop below the $117k–$114k cost-basis cluster placed top buyers back in loss, reinforcing near-term fragility. On-chain data point to cooling demand and continued LTH distribution, while ETF inflows have weakened, a sign of softening institutional appetite. Spot markets showed a controlled sell-off, and futures markets underwent a historic leverage flush, resetting systemic risk.
In the options market, open interest and volume rebounded swiftly, but volatility spiked, skew flipped sharply positive, and traders rushed to hedge. Despite rapid stabilization, the market remains in a reset phase, where renewed ETF inflows and sustained on-chain accumulation will be key to restoring confidence and confirming a durable recovery.
Disclaimer: This report does not provide any investment advice. All data is provided for informational and educational purposes only. No investment decision shall be based on the information provided here, and you are solely responsible for your own investment decisions.
Exchange balances presented are derived from Glassnode’s comprehensive database of address labels, which are amassed through both officially published exchange information and proprietary clustering algorithms. While we strive to ensure the utmost accuracy in representing exchange balances, it is important to note that these figures might not always encapsulate the entirety of an exchange’s reserves, particularly when exchanges refrain from disclosing their official addresses. We urge users to exercise caution and discretion when utilizing these metrics. Glassnode shall not be held responsible for any discrepancies or potential inaccuracies.
Please read our Transparency Notice when using exchange data.