Defending $100k
Bitcoin stabilizes near $100K after breaking below key cost-basis levels, signaling fading demand and long-term holder selling. With ETFs seeing outflows and options traders still defensive, the market sits in a precarious spot, cautious, oversold, but not yet deeply capitulated.


Executive Summary
- Bitcoin fell below the Short-Term Holders’ Cost Basis (~$112.5K), confirming fading demand and ending its prior bullish phase. Price now consolidates near $100K, about 21% below the ATH.
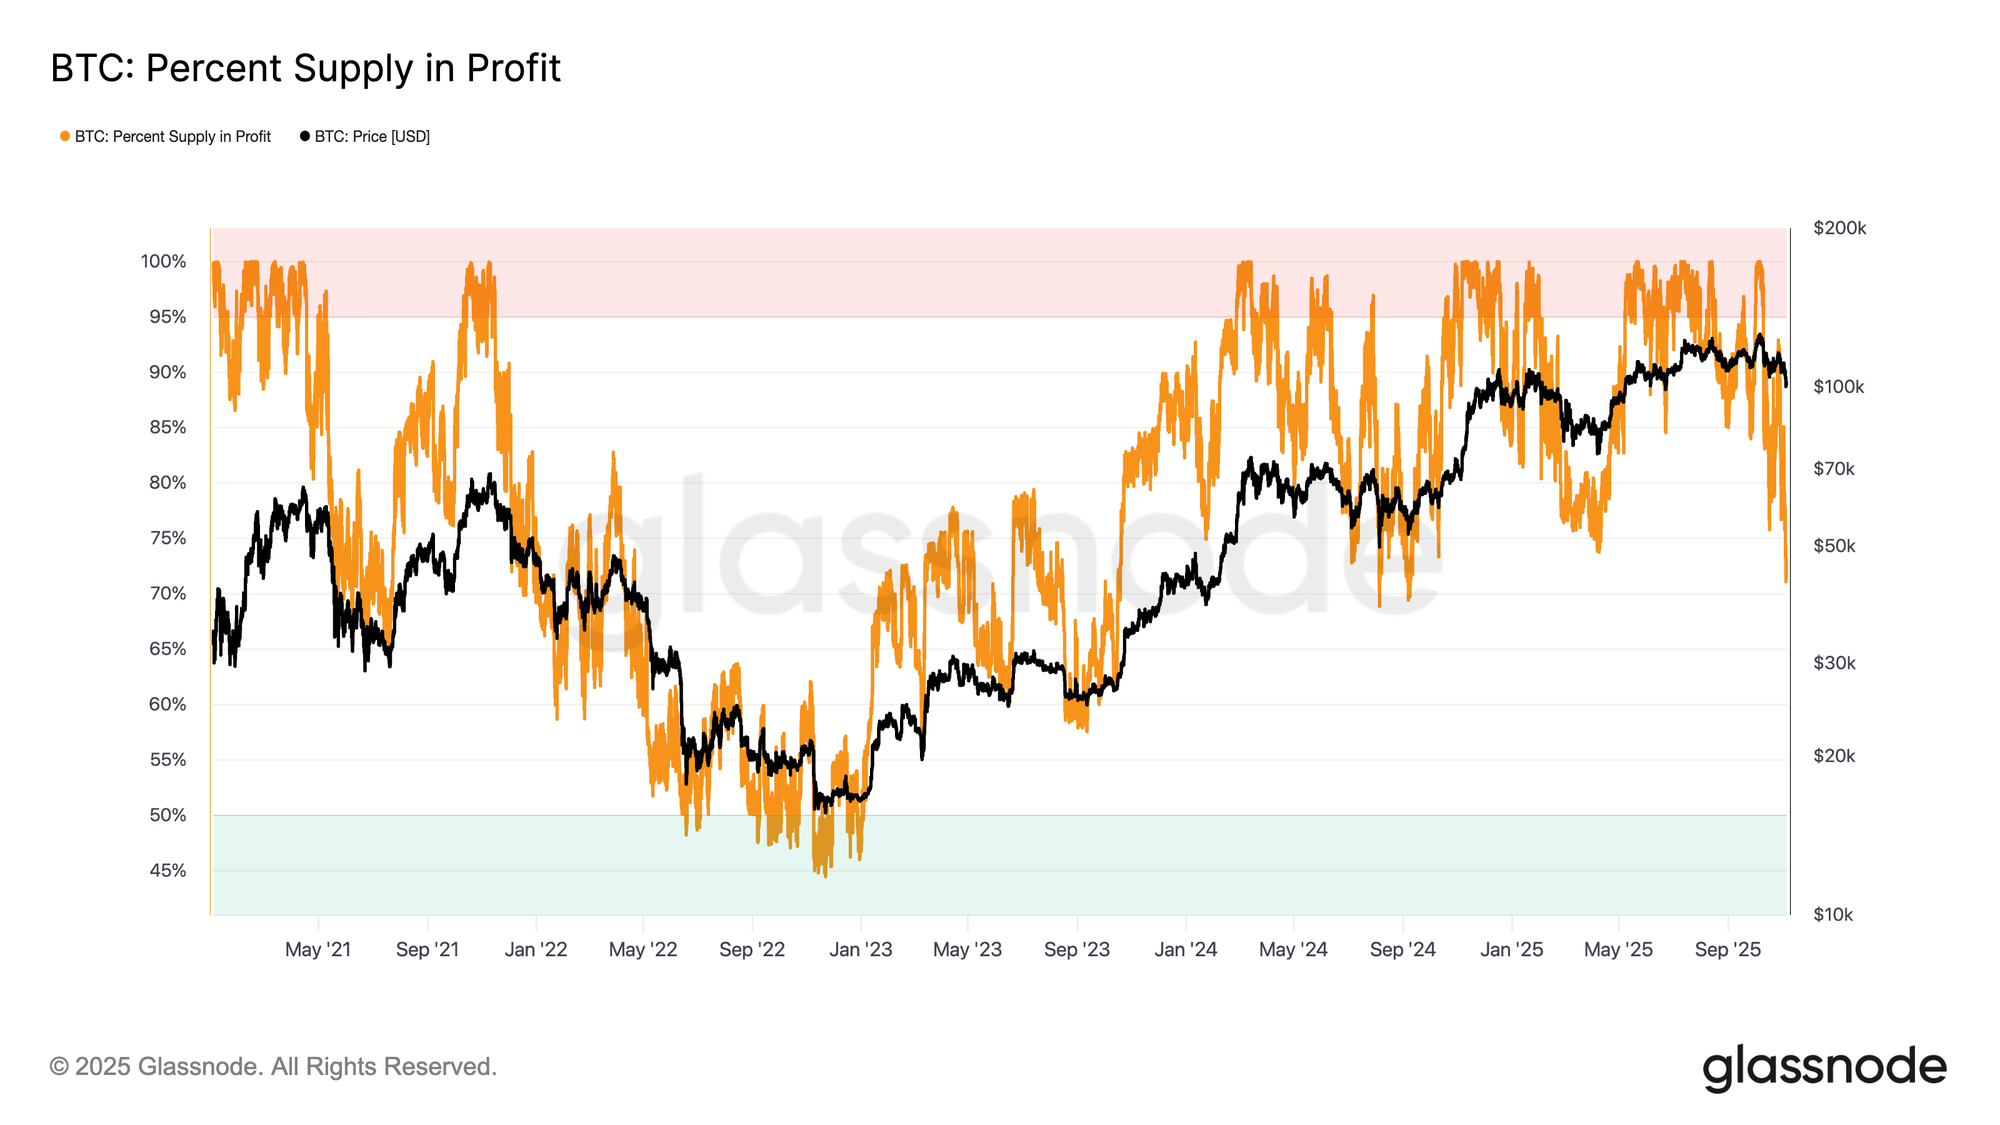
- Around 71% of supply remains in profit, consistent with mid-cycle corrections. The Relative Unrealized Loss at 3.1% suggests a mild bear phase rather than deep capitulation.
- Since July, LTH supply has declined by 300K BTC, marking ongoing distribution even as price trends lower, unlike earlier in the cycle when selling occurred into rallies.
- U.S. Spot ETFs have recorded steady outflows (–$150M/day to –$700M/day), while spot CVDs on major exchanges show persistent sell pressure and fading discretionary demand.
- The Perpetual Market Directional Premium dropped from $338M/month in April to $118M/month, indicating traders are stepping back from leveraged longs.
- Elevated put demand and higher premiums at the $100K strike show traders are still hedging, not buying the dip. Short-term implied volatility remains sensitive to price swings but is stabilizing after October’s spike.
- Overall, market remains in a fragile equilibrium, with weak demand, controlled losses, and high caution. A sustained recovery requires renewed inflows and reclaiming the $112K–$113K region as support.
On-chain Insights
Following last week’s report, Lacking Conviction, Bitcoin broke below the $100K psychological threshold after repeatedly failing to reclaim the Short-Term Holders’ cost basis. This breakdown confirms fading demand momentum and persistent sell pressure from long-term investors, marking a clear step away from the bullish phase.
In this edition, we use on-chain price models and spending indicators to assess the market’s structural weakness, then turn to spot, perpetual, and options market metrics to gauge sentiment and risk positioning for the week ahead.
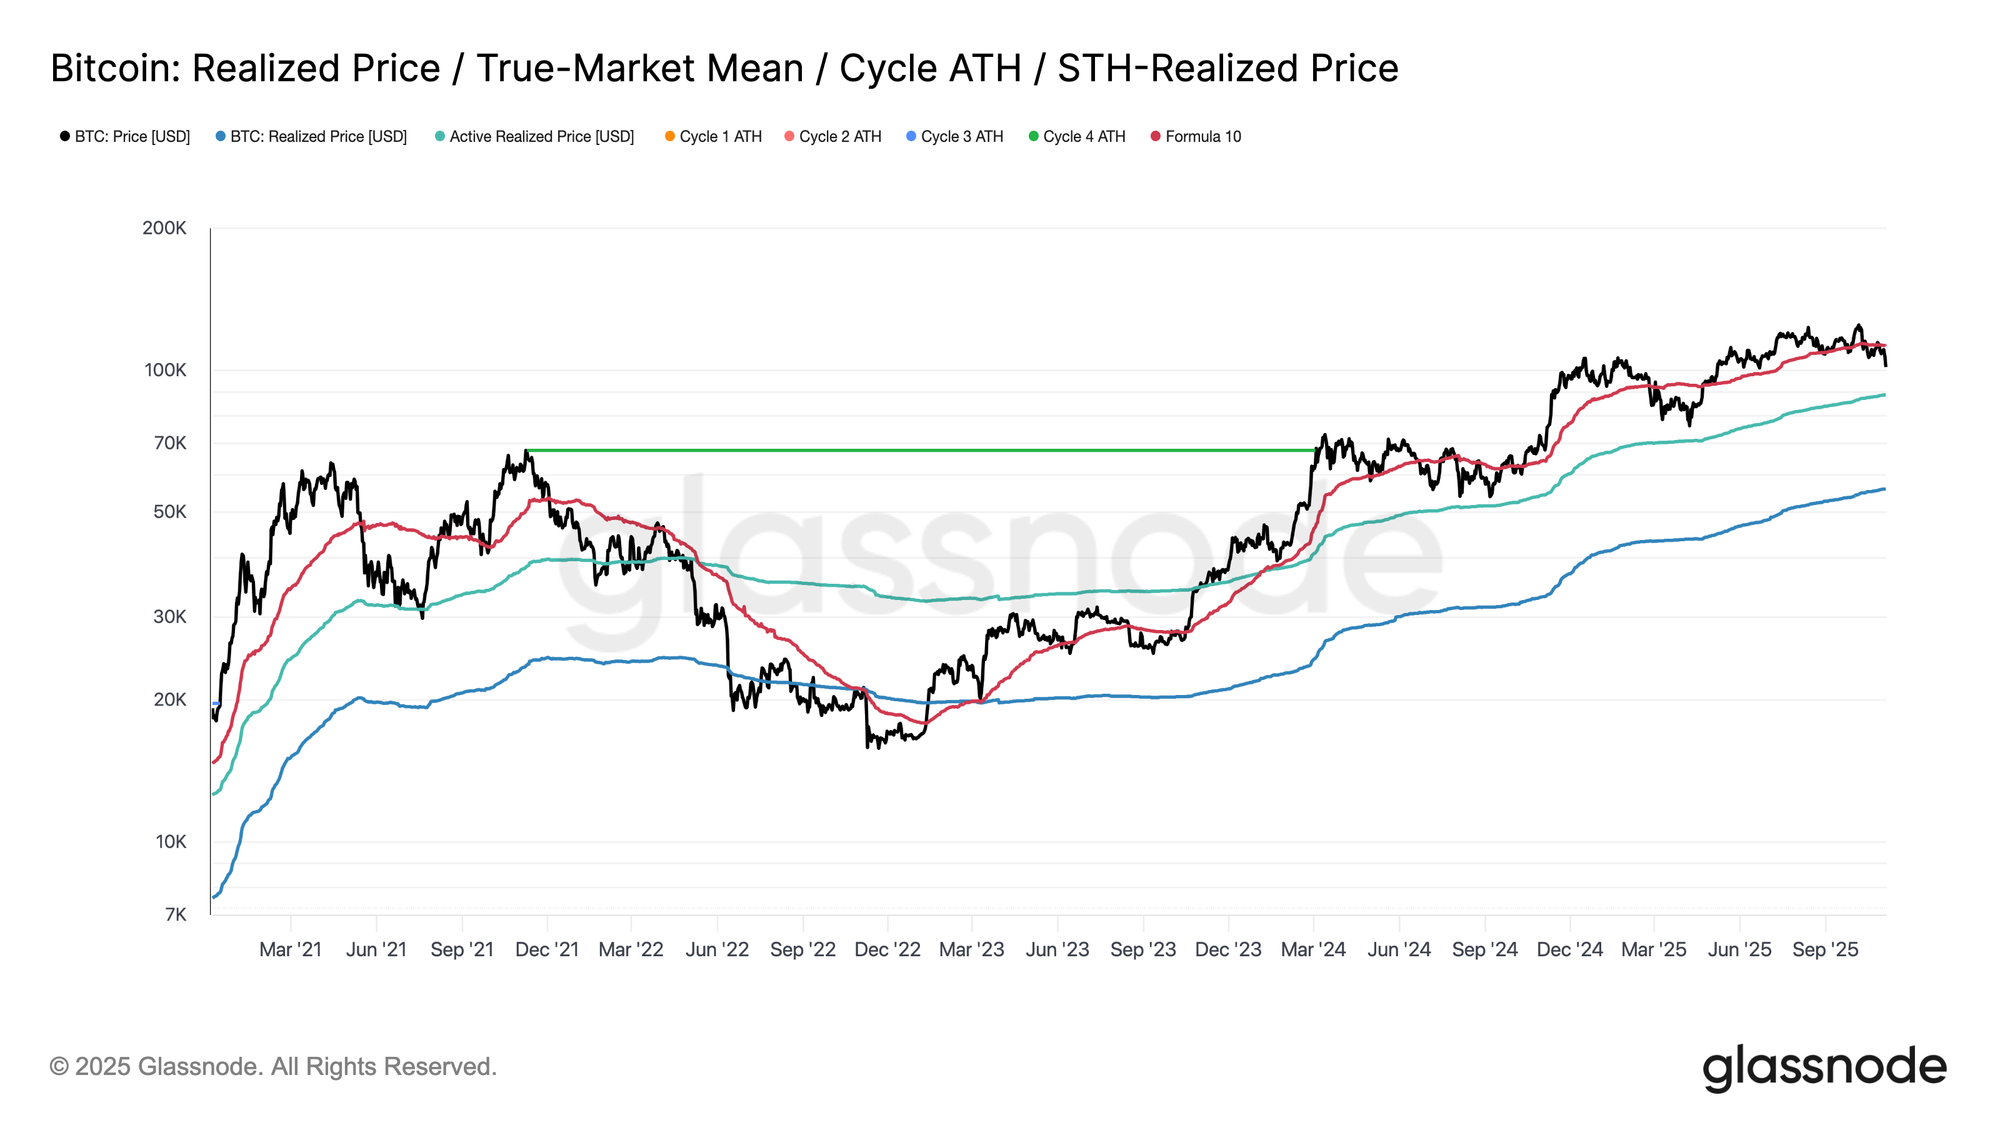
Testing the Lower Bound
Since the market reset on October 10th, Bitcoin has struggled to hold above the Short-Term Holders’ cost basis, resulting in a sharp decline to around $100K, approximately 11% below this key threshold at $112.5K.
Historically, discounts with such depth from this level have increased the likelihood of further downside toward lower structural supports, such as the Active Investors’ Realized Price, currently near $88.5K. This metric dynamically tracks the cost basis of actively circulating supply (excluding dormant coins) and has often served as a critical reference point during extended corrective phases in prior cycles.
At a Crossroad
Extending this analysis, the recent correction has formed a structure reminiscent of June 2024 and February 2025, periods where Bitcoin stood at a pivotal juncture between recovery and deeper contraction. At $100K, roughly 71% of the supply remains in profit—placing the market near the lower bound of the typical 70%–90% equilibrium range seen during mid-cycle slowdowns.
This stage often features brief relief rallies toward the Short-Term Holders’ cost basis, though a sustained recovery generally requires prolonged consolidation and renewed demand inflows. Conversely, if further weakness pushes a larger share of supply into loss, the market risks transitioning from the current moderate downtrend into a deeper bearish phase, historically defined by capitulation and extended re-accumulation.
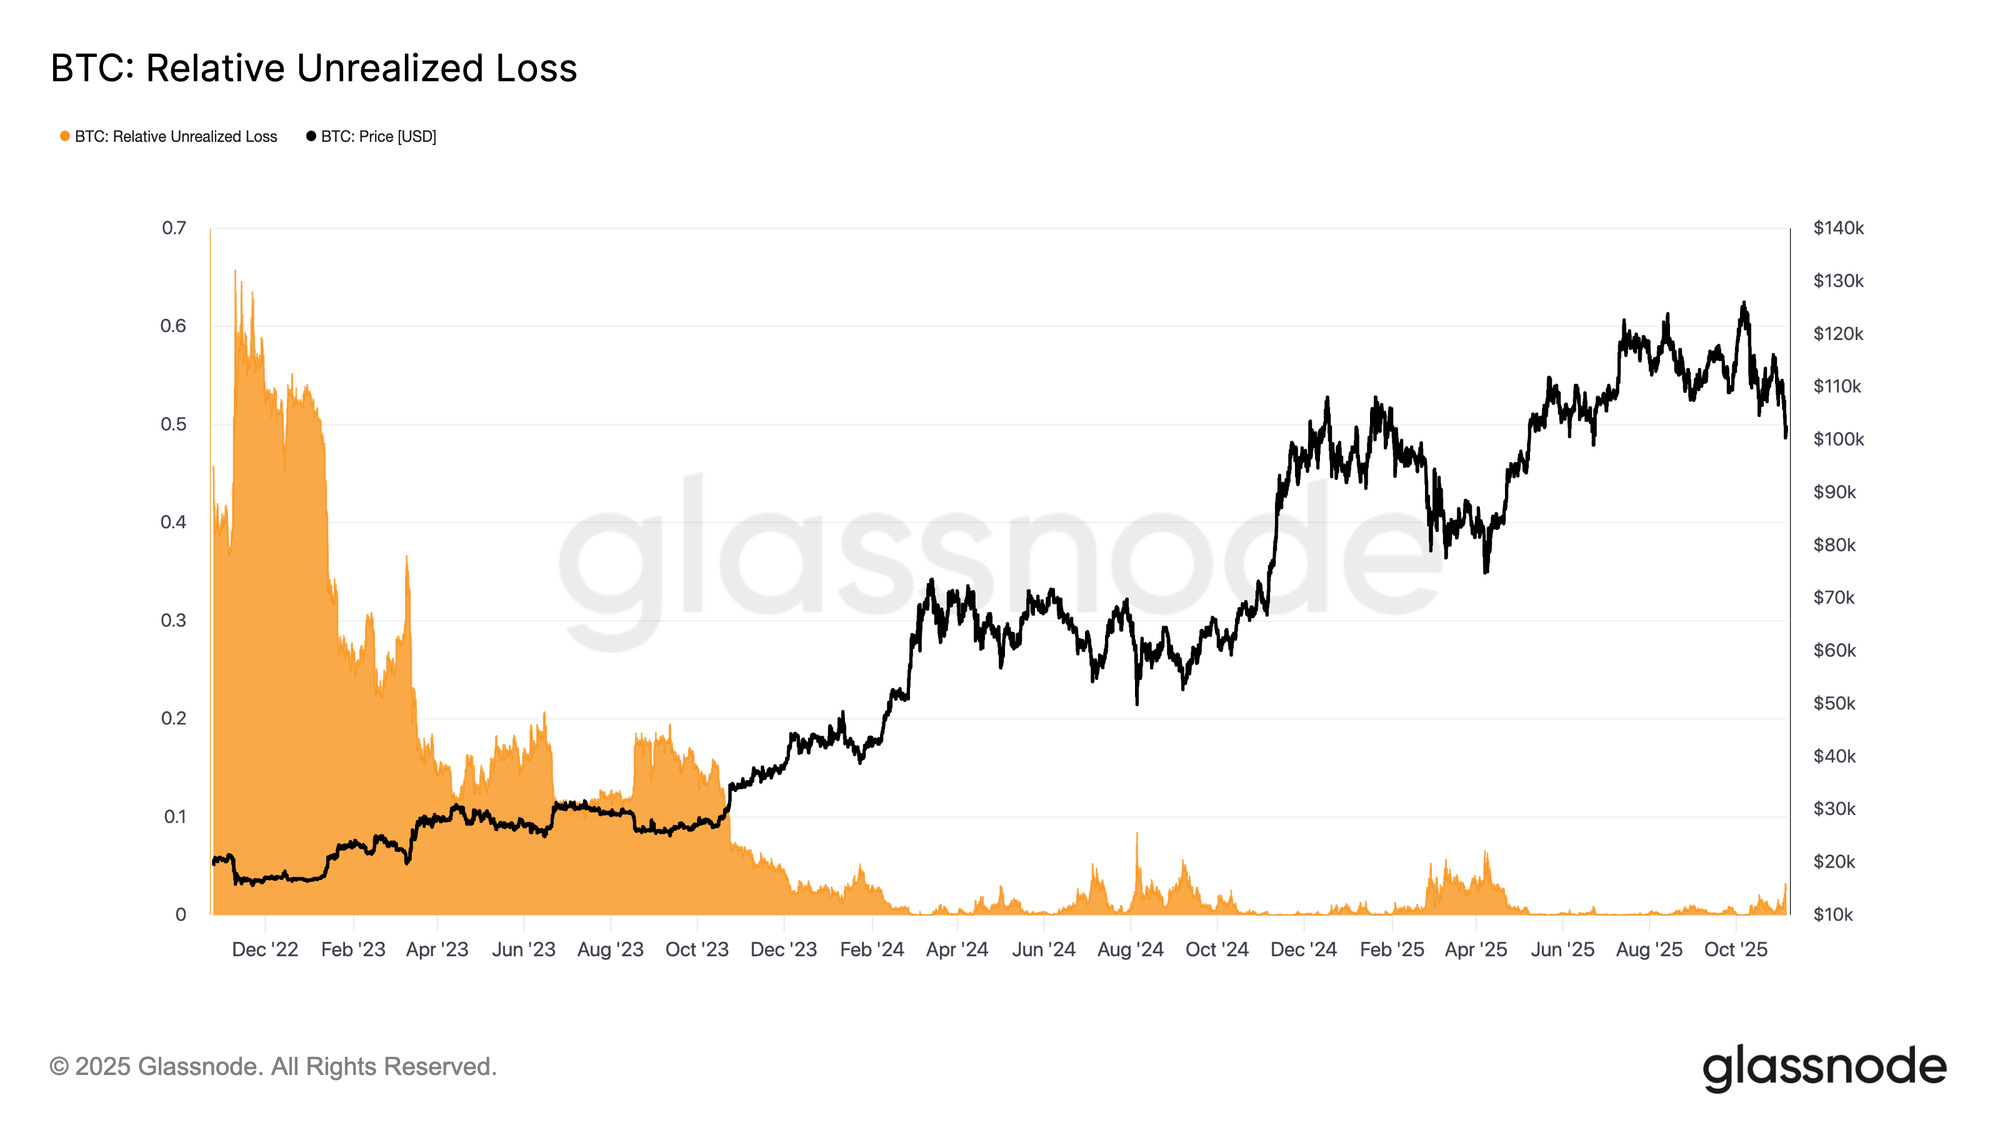
Losses Still Contained
To further distinguish the current drawdown, it’s useful to assess the Relative Unrealized Loss, which measures the total unrealized losses in USD relative to market capitalization. Unlike the 2022–2023 bear market, where losses reached extreme levels, the current reading of 3.1% suggests only moderate stress, comparable to mid-cycle corrections in Q3–Q4 2024 and Q2 2025, all of which remained below the 5% threshold.
As long as unrealized losses stay within this range, the market can be classified as a mild bear phase characterized by orderly revaluation rather than panic. However, a deeper drawdown pushing this ratio above 10% would likely trigger broader capitulation and mark the transition into a more severe bearish regime.
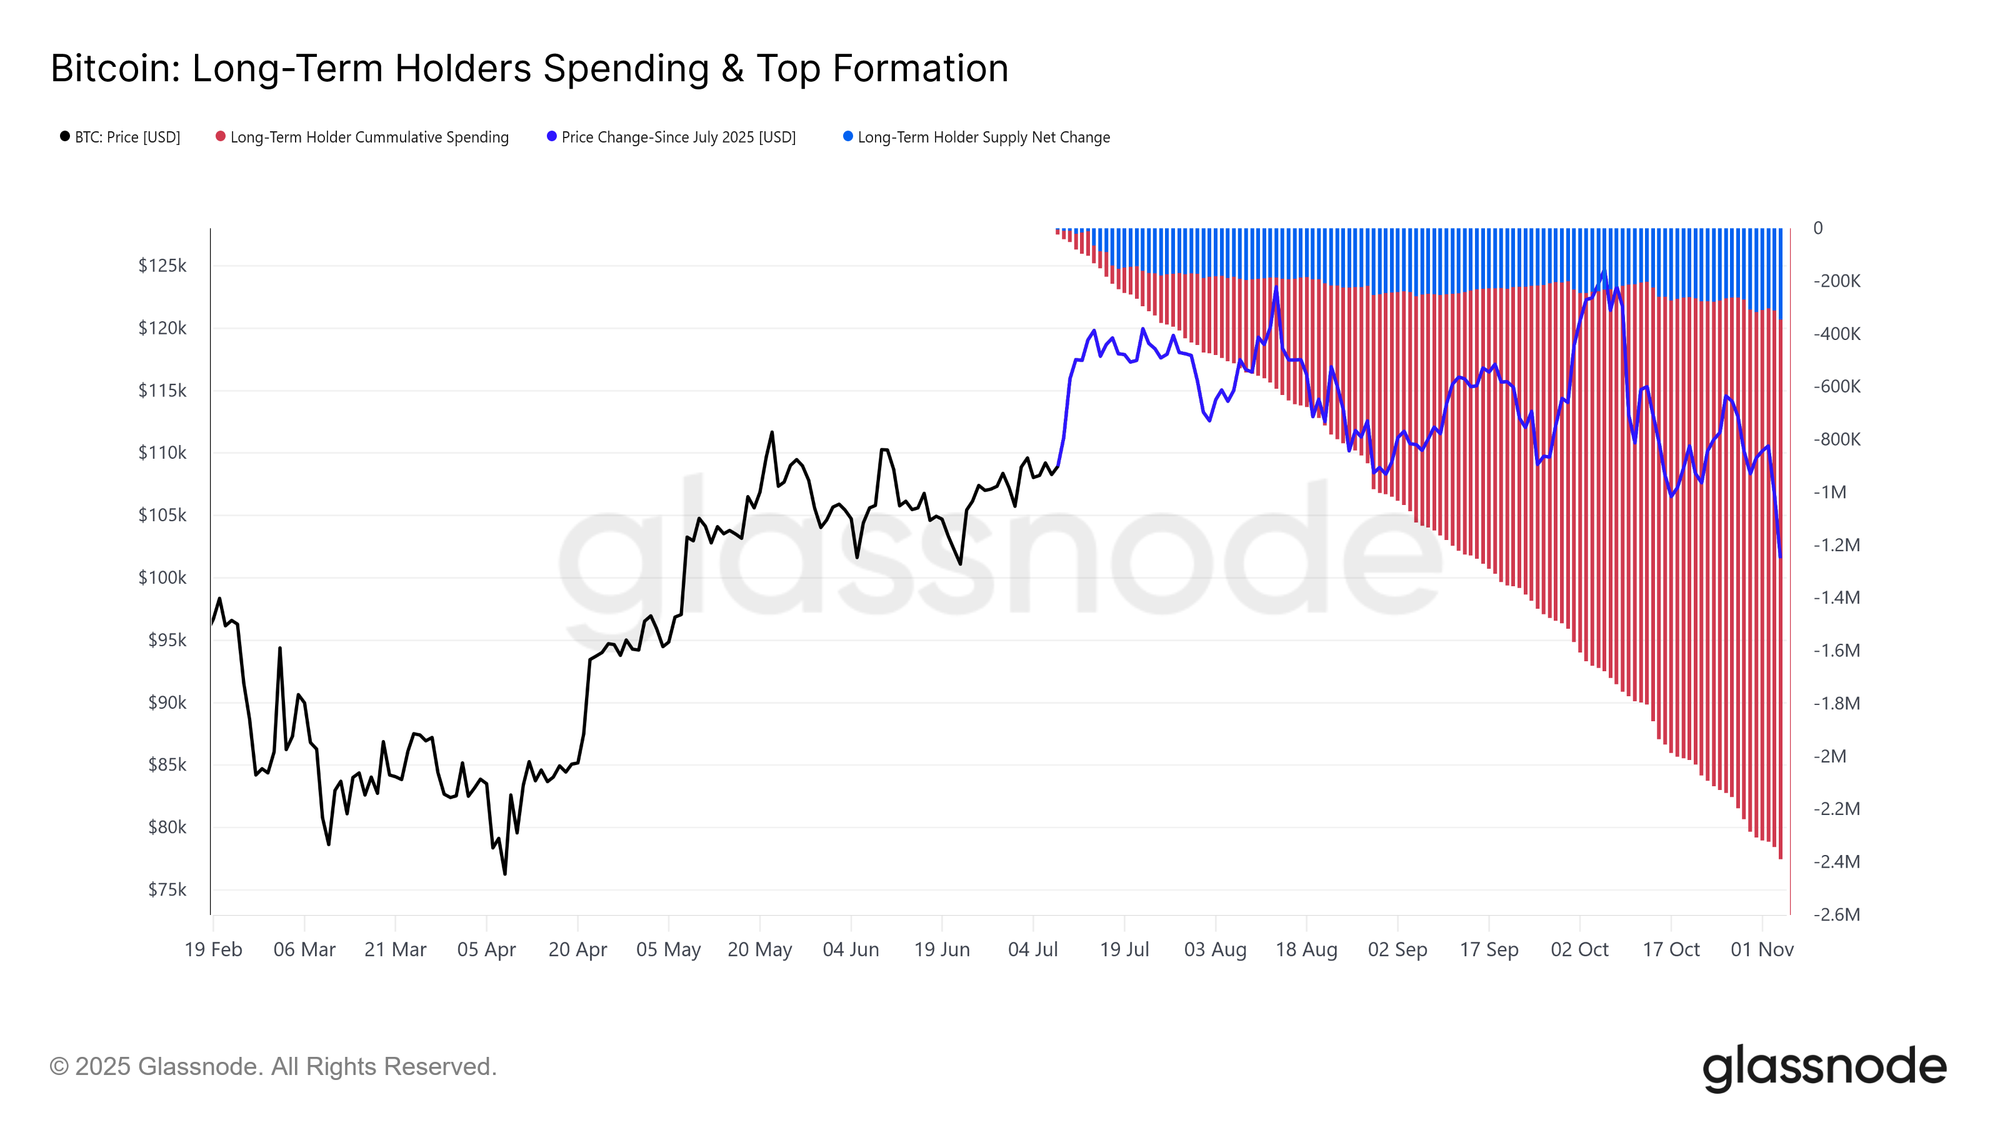
Persistent Long-Term Distribution
Despite the relatively contained loss intensity and a moderate 21% drawdown from the all-time high of $126K, the market remains under quiet yet persistent sell pressure from long-term holders (LTHs). This trend has been unfolding since July 2025, even as Bitcoin reached a new peak in early October, catching many by surprise.
During this period, LTH Supply has declined by ~300K BTC (from 14.7M to 14.4M BTC). Unlike previous distribution waves earlier in the cycle, when long-term holders sold into strength during major rallies, this time, they are selling into weakness. In other words, they are offloading coins while the price ranges and continues to drift lower. This behavioural shift signals deeper fatigue and reduced conviction among seasoned investors.
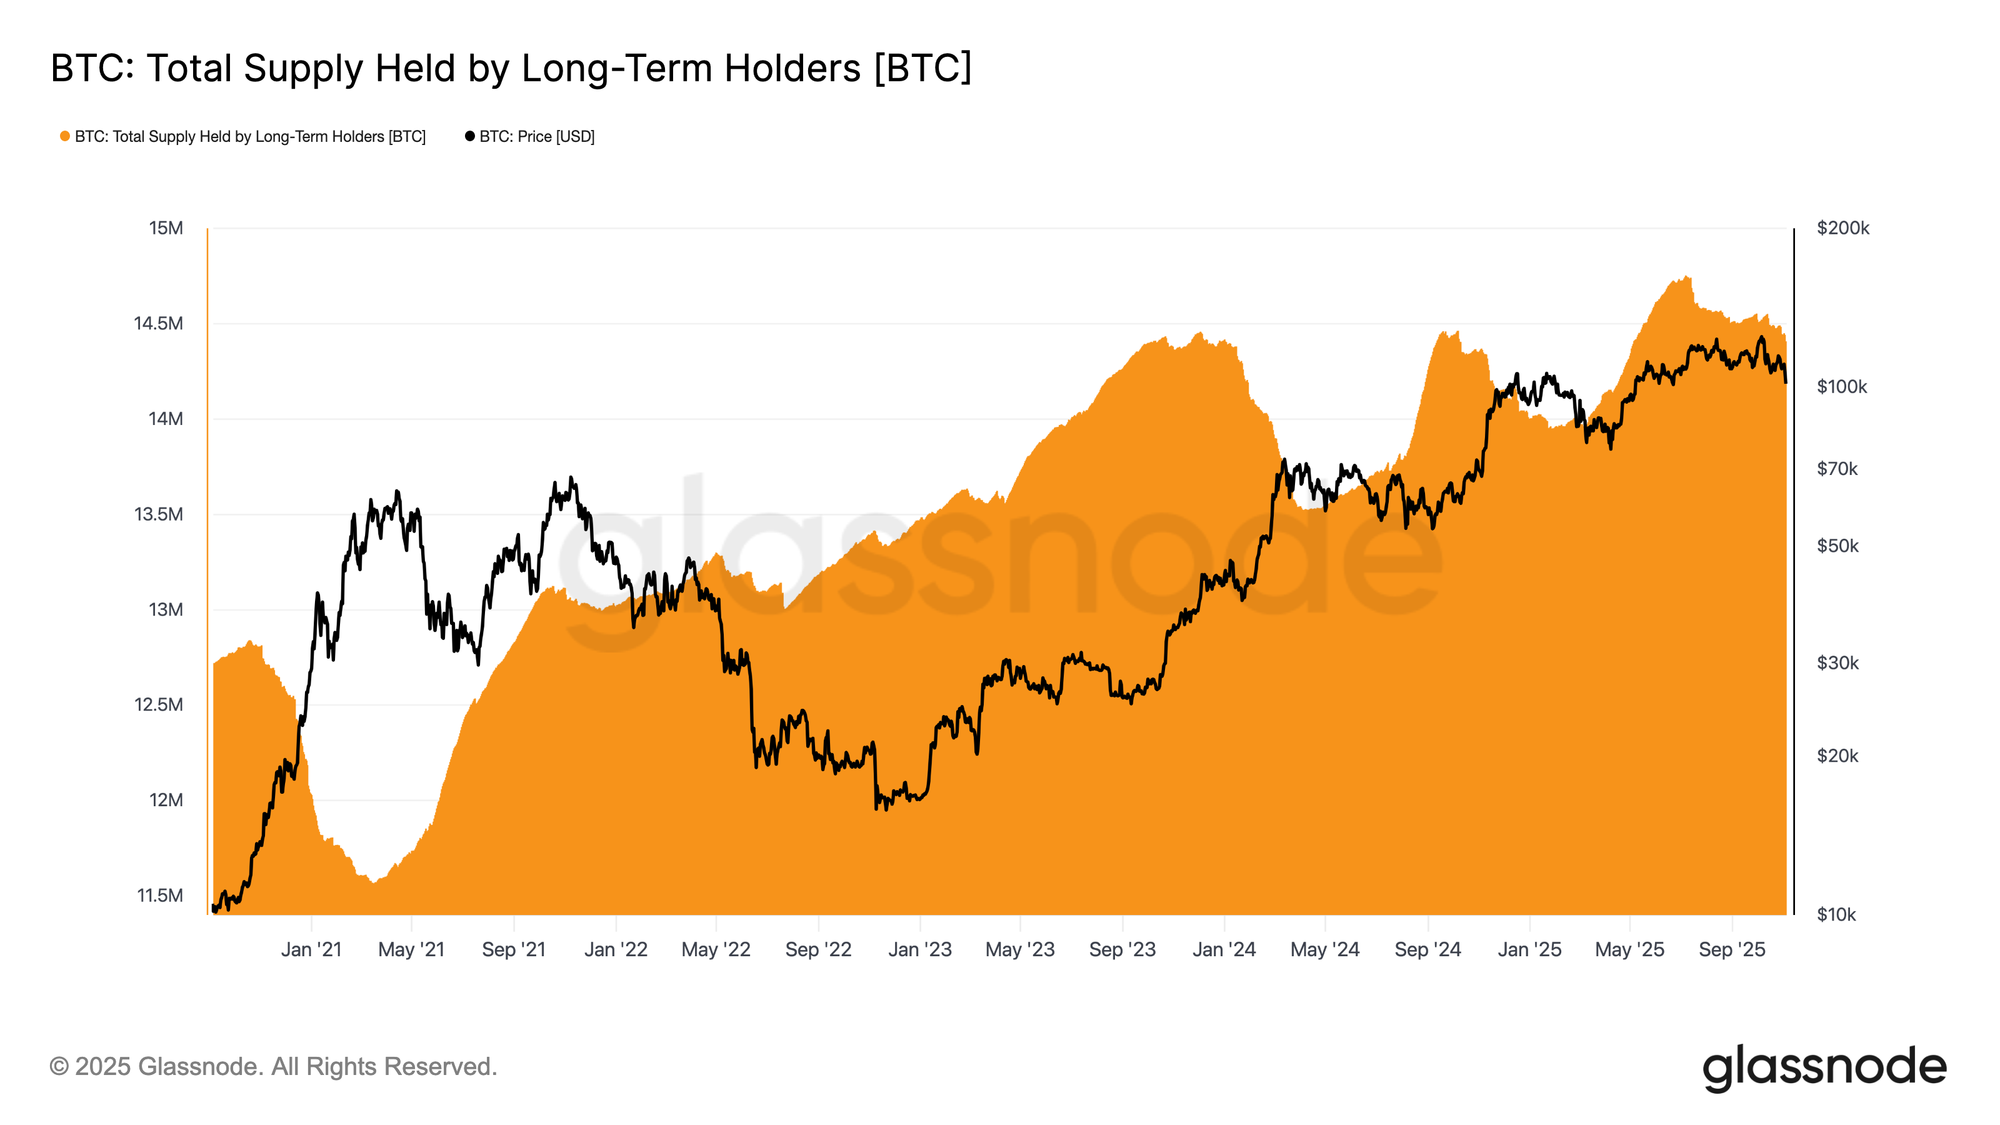
Unpacking the Quiet Distribution
To better understand the ongoing long-term holder (LTH) distribution, it’s important to recognize that changes in LTH supply reflect two forces: coins spent and coins maturing beyond roughly 155 days. Since July 2025, the pace of spending has outstripped maturation, creating a “quiet” form of distribution beneath the surface.
Comparing cumulative LTH spending with the net supply change reveals that long-term holders have spent around 2.4M BTC during this period, while new maturations offset much of this outflow, resulting in a net supply decline of 0.3M BTC. Excluding the maturation effect, this spending represents roughly 12% of the circulating supply (2.4M / 19.4M). This is a substantial flow that helps explain the persistent sell-side pressure despite relatively stable price action.
Off-Chain Insights
Low on Ammo
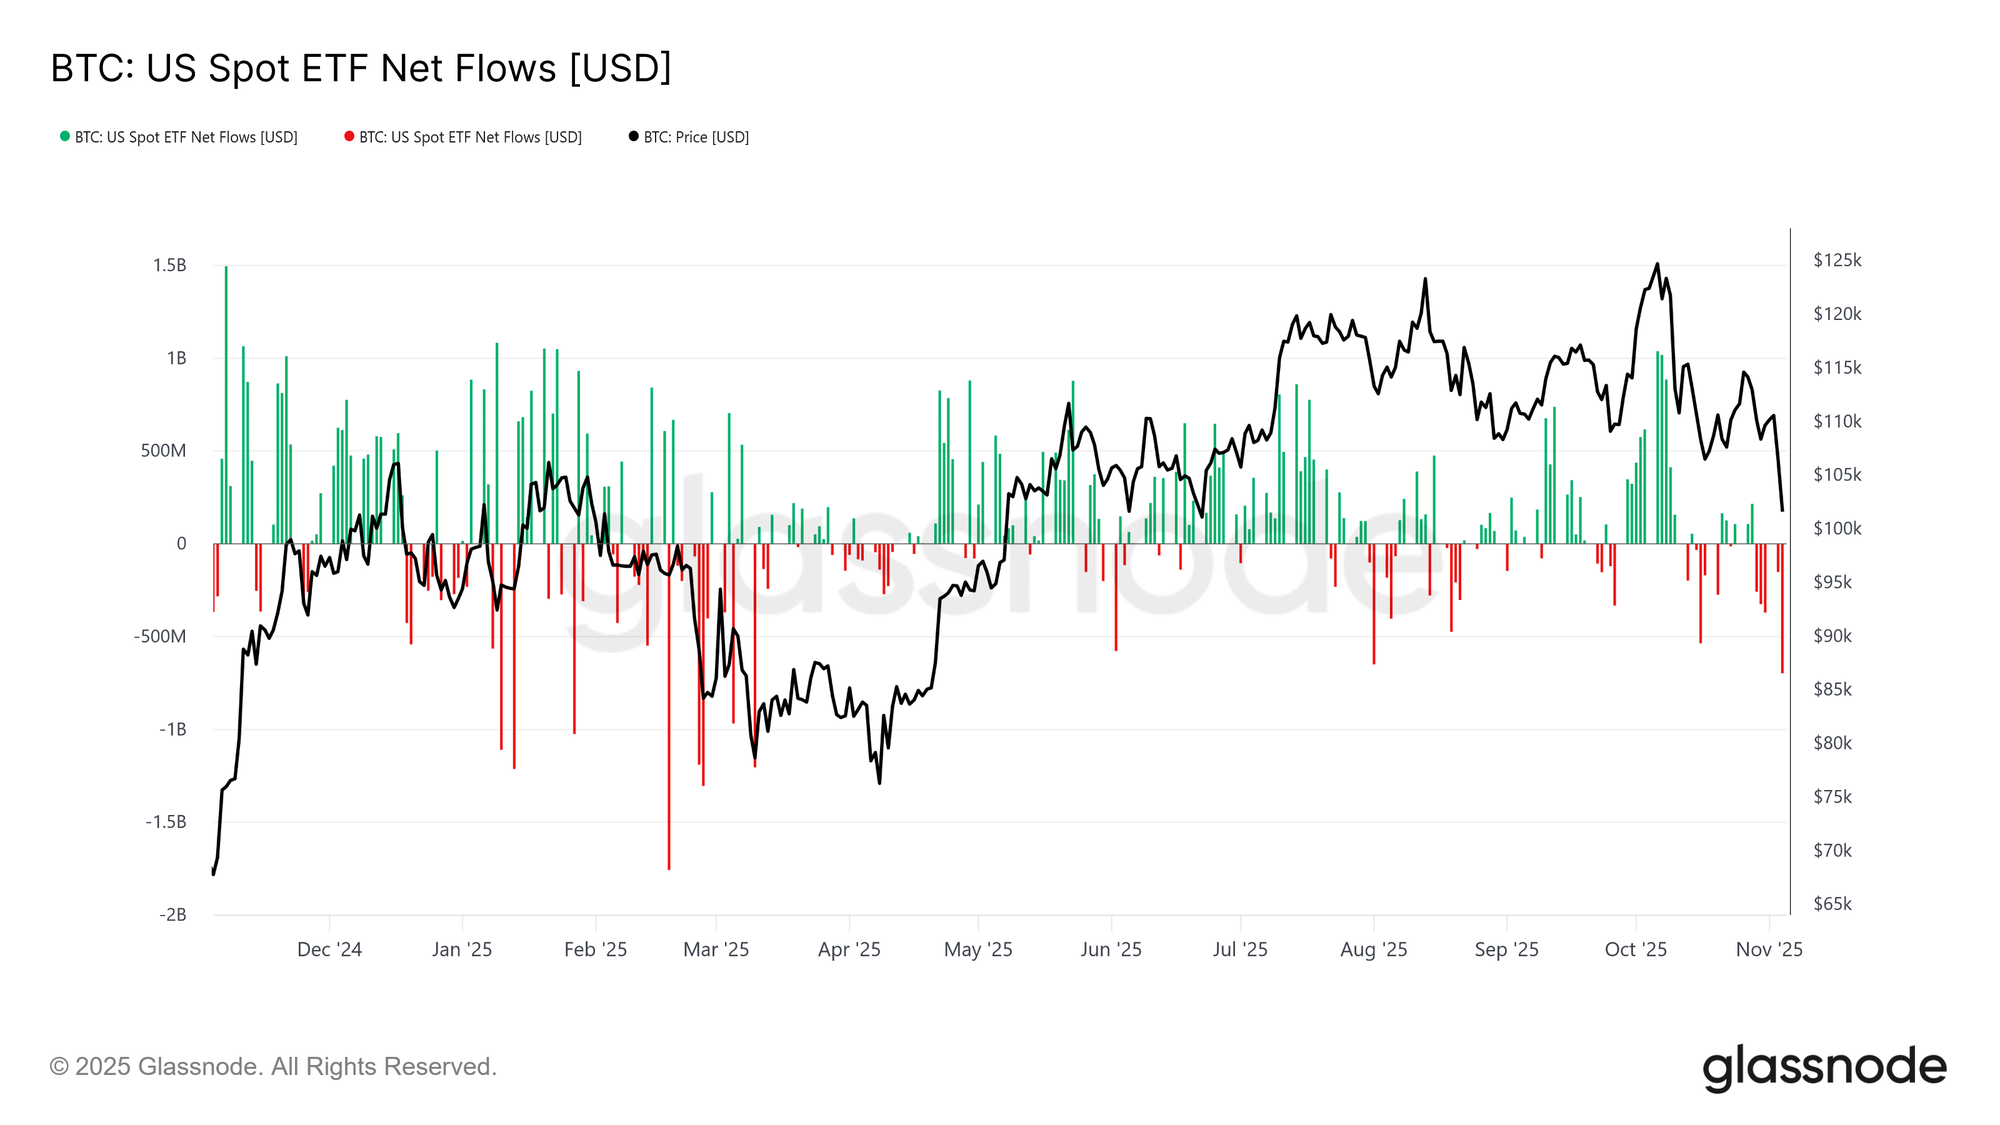
Shifting focus to institutional demand, U.S. spot Bitcoin ETFs have seen a marked slowdown over the past two weeks, recording consistent net outflows between –$150M and –$700M per day. This contrasts sharply with the strong wave of inflows observed throughout September and early October, which had supported price resilience during that period.
The recent trend points to a moderation in institutional capital allocation, as profit-taking and reduced appetite for new exposure weigh on aggregate ETF buying pressure. This cooling in activity aligns closely with the broader price weakness, highlighting a decline in buy-side conviction following several months of persistent accumulation.
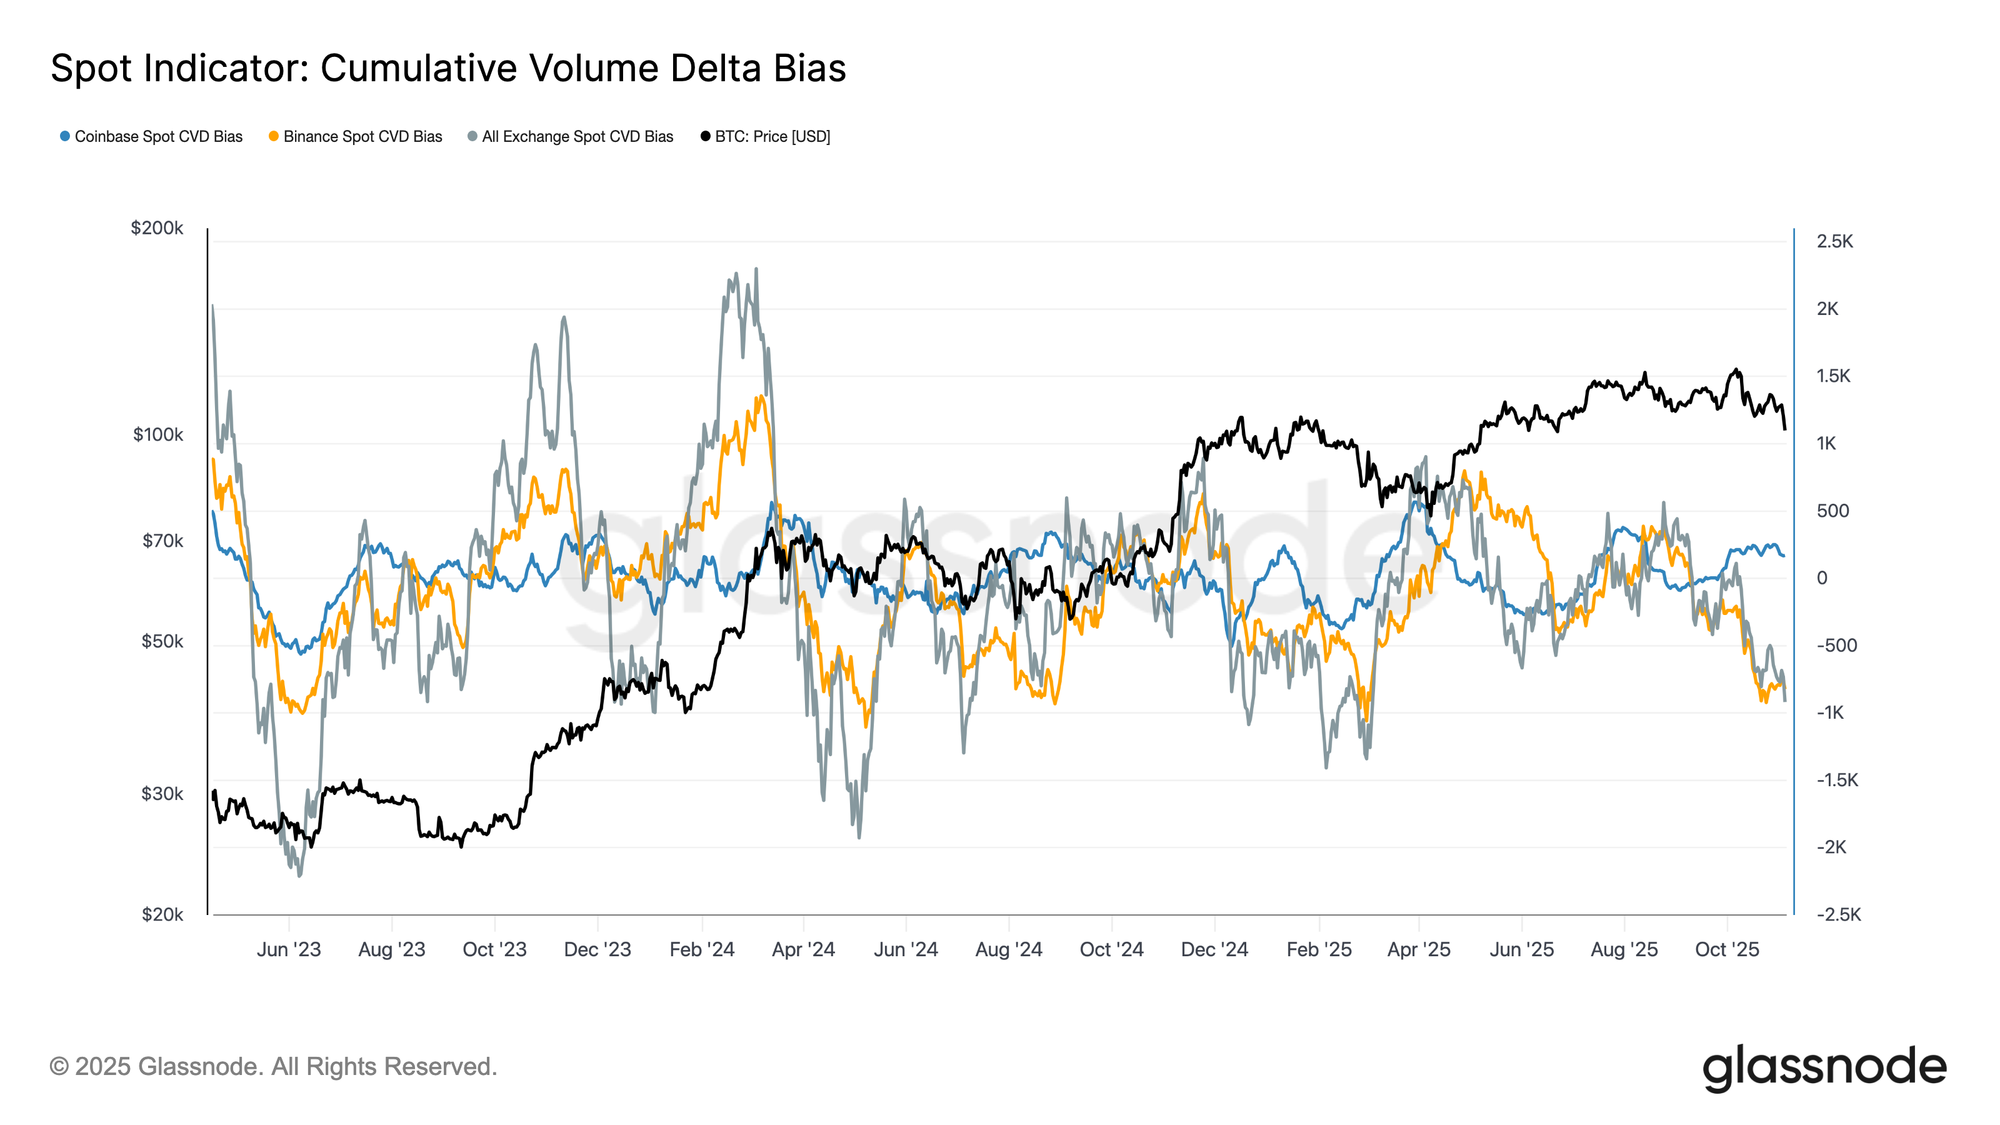
Heavy Bias
Spot market activity has continued to weaken over the past month, with the Cumulative Volume Delta (CVD) Bias trending lower across major exchanges. Both Binance and aggregate spot CVDs have turned negative at –822 BTC and –917 BTC, respectively, signaling sustained net sell pressure and limited aggressive spot bidding. Coinbase remains comparatively neutral at +170 BTC, showing little evidence of meaningful buy-side absorption.
This deterioration in spot demand mirrors the broader slowdown in ETF inflows, suggesting a decline in discretionary investor conviction. Together, these signals reinforce a cooling market tone, where buying interest remains subdued and rallies are met with increasingly swift profit-taking.
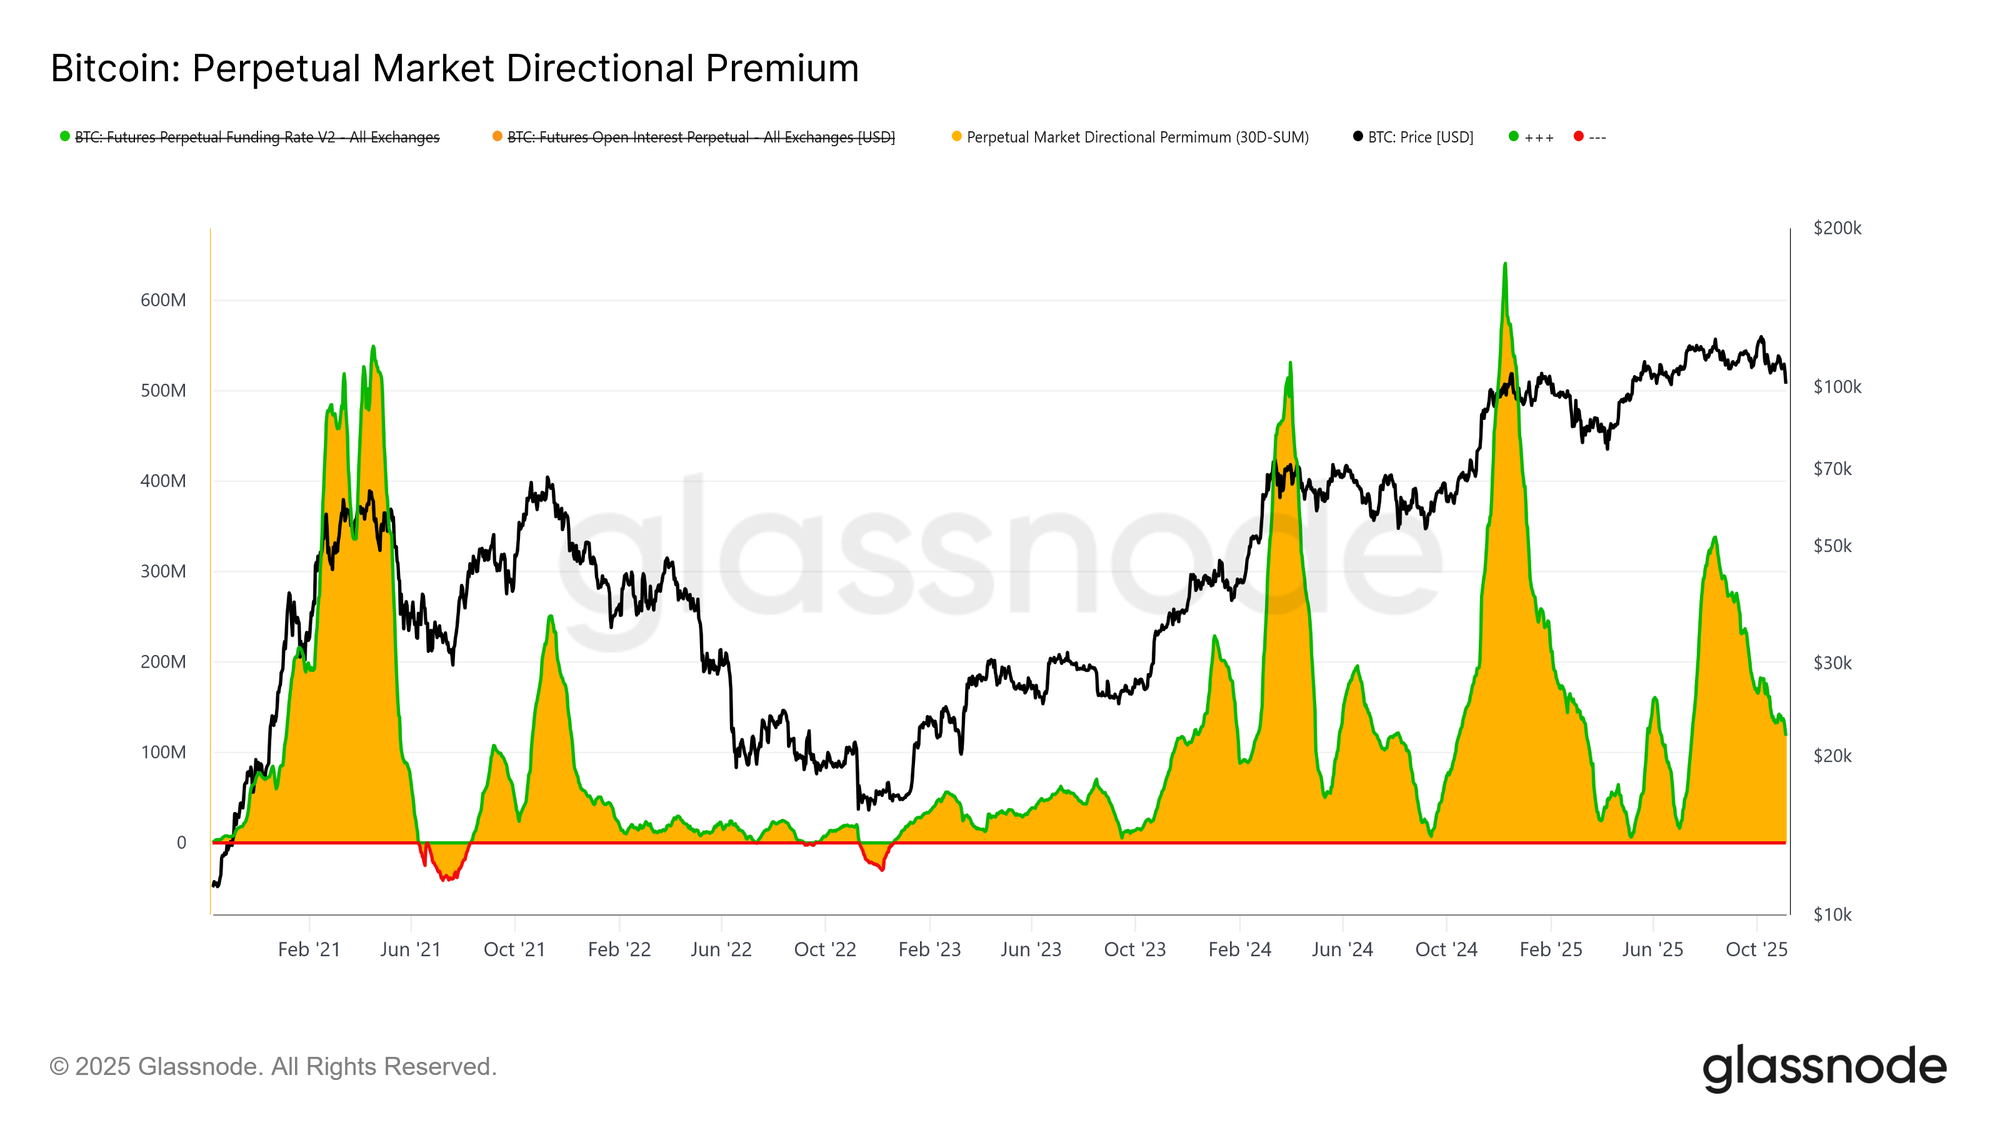
Spoiled Appetite
In the derivatives market, the Perpetual Market Directional Premium—the interest paid by long traders to maintain positions—has declined sharply from its April peak of $338M per month to around $118M per month. This notable reduction signals a broad unwind in speculative positioning and a clear cooling of risk appetite.
After an extended period of elevated positive funding through mid-year, the metric’s steady decline indicates that traders are scaling back directional leverage, favouring neutrality over aggressive long exposure. This shift mirrors the broader softening seen in spot demand and ETF inflows, underscoring a transition in perpetual markets from an optimistic bias to a more cautious, risk-off stance.
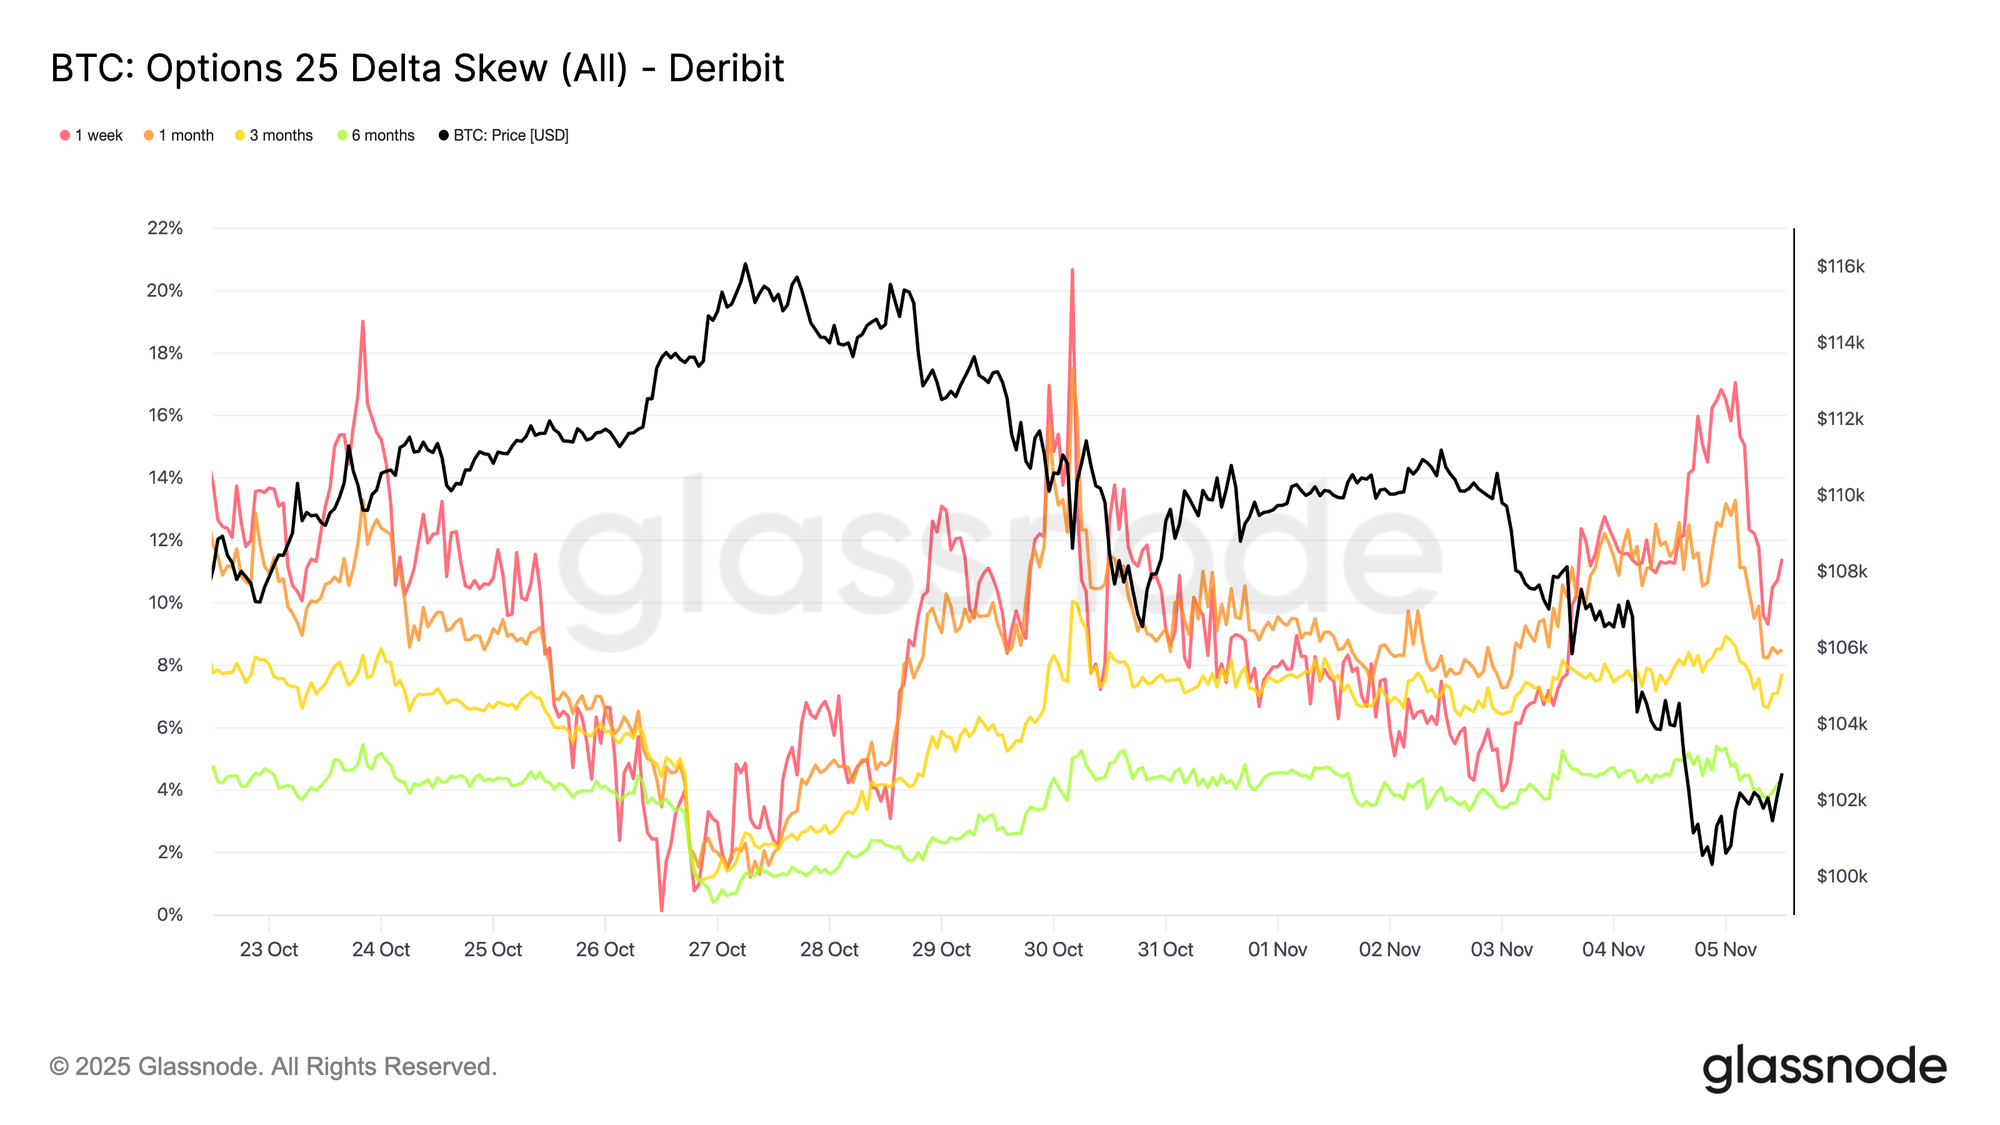
Still Paying for Protection
As Bitcoin hovers around the $100K psychological level, options skew continue to signal strong demand for puts unsurprisingly. The data show that the options market is not positioning for a reversal or “buying the dip,” but rather paying elevated premiums to guard against further downside. Expensive puts at a key support level indicate that traders remain focused on protection rather than accumulation. In short, the market is still hedging, not bottom fishing (at least, not yet).
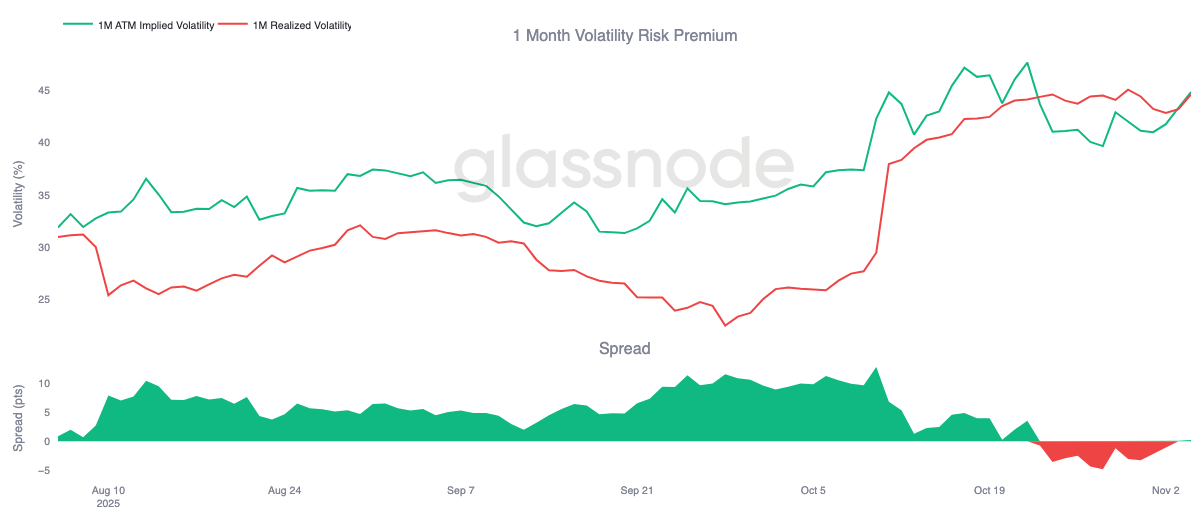
Risk Premium Turns Back Up
The one-month volatility risk premium has turned slightly positive after ten consecutive days in negative territory. As expected, the premium has mean-reverted, with implied volatility repricing higher following a difficult stretch for gamma sellers.
This shift reflects a market still dominated by caution, where traders are willing to pay elevated prices for protection, allowing market makers to step in on the other side. It’s also notable how implied volatility responded as Bitcoin fell to the $100K level, rising in tandem with renewed defensive positioning.
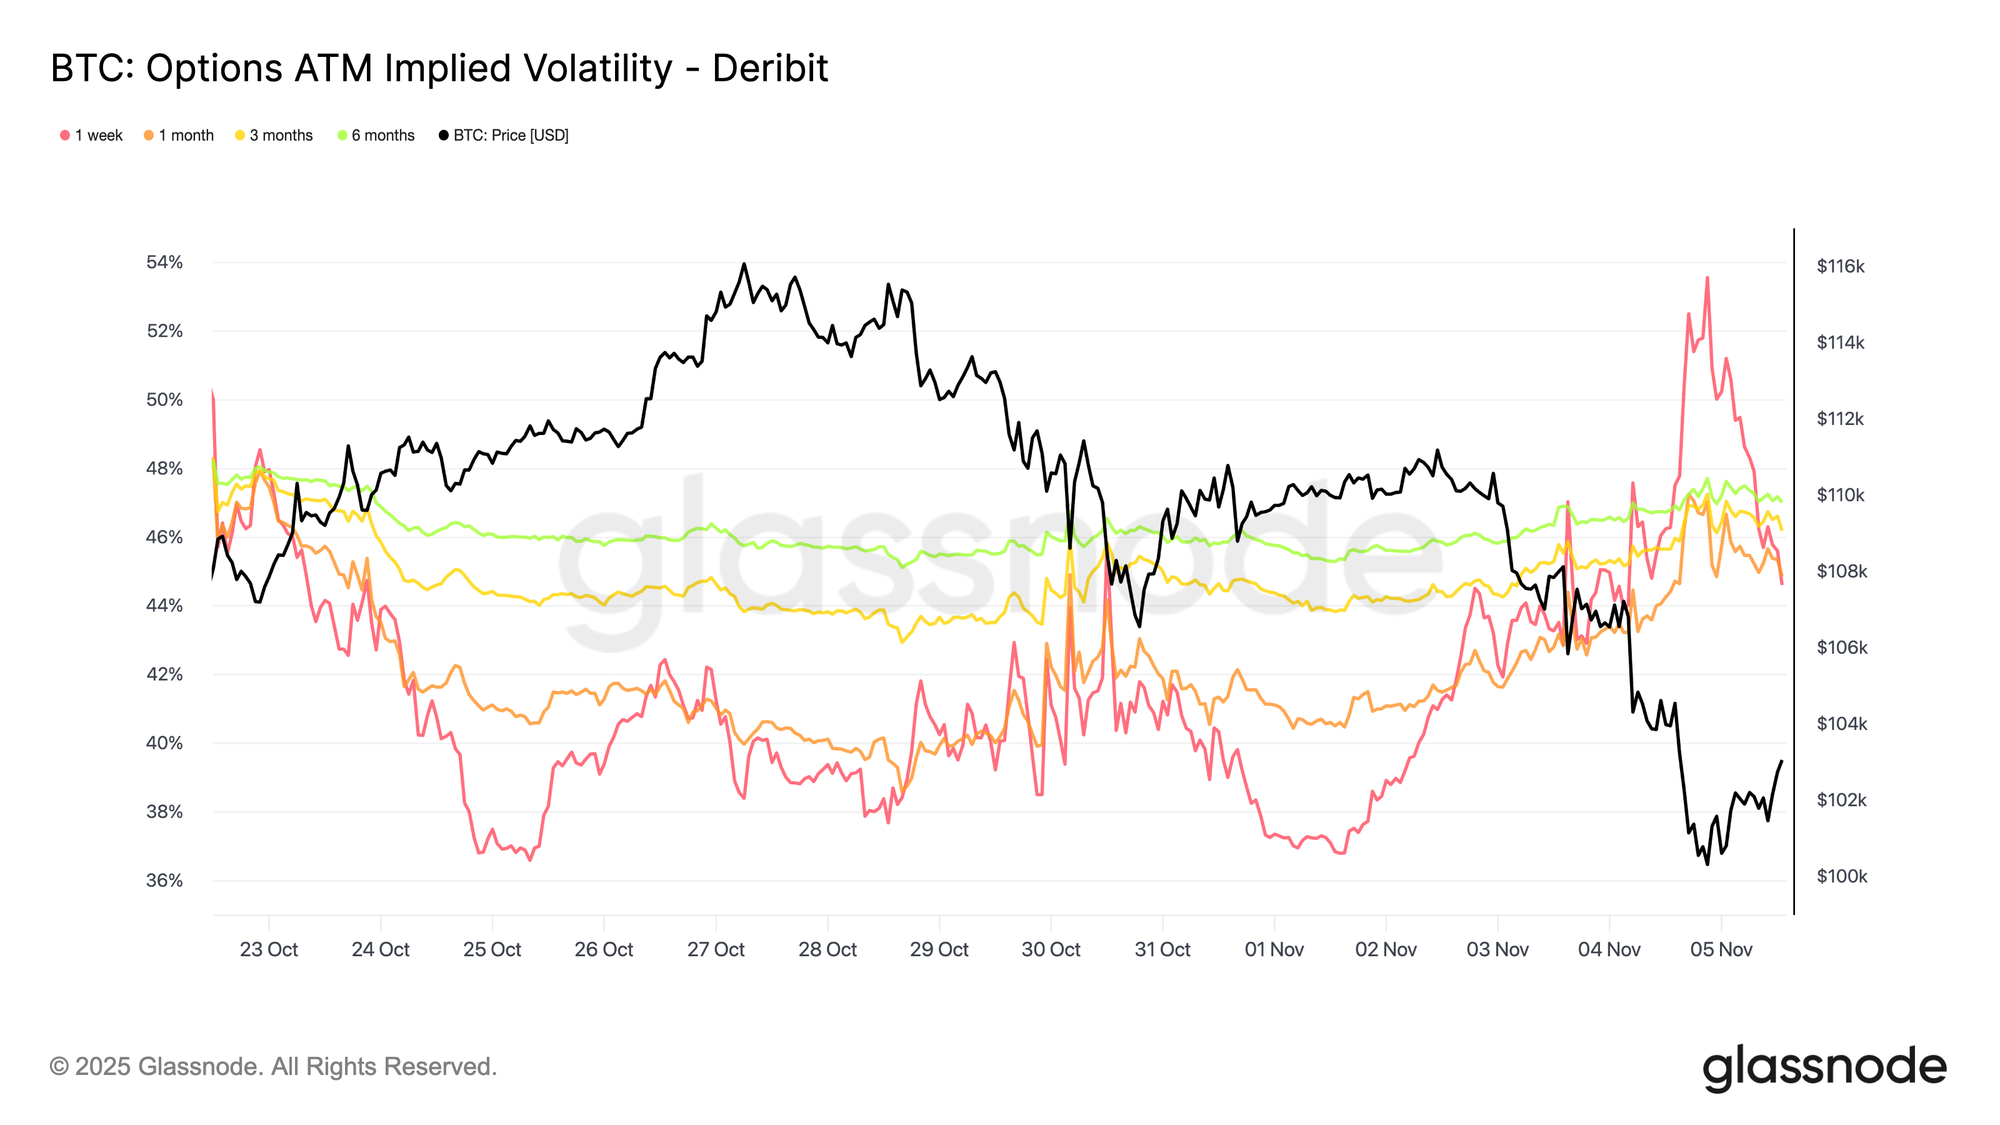
Volatility Spikes Lower
Short-term implied volatility remains closely and inversely tied to price action. As Bitcoin sold off, volatility surged sharply, with one-week IV spiking to 54% before retracing about 10 vol points once support formed near $100K.
Longer expiries also moved higher, with the one-month tenor rising by roughly 4 vol points, and the six-month maturity gaining around 1.5 vol points compared to pre-correction levels near $110K. This pattern underscores the classic panic-volatility relationship, where rapid price declines continue to drive short-term volatility spikes.
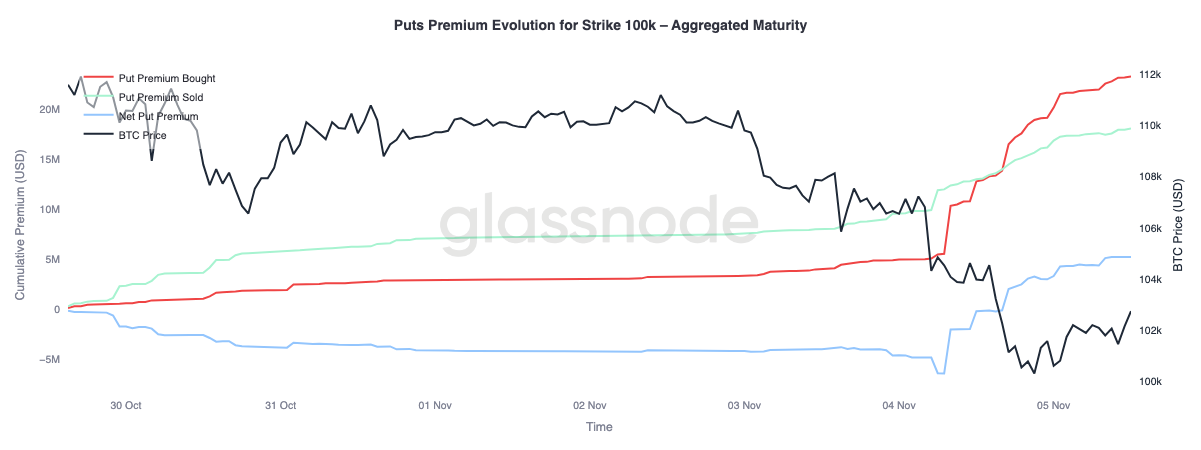
Defensive at 100K
Examining the $100K strike put premium offers further insight into current sentiment. Over the past two weeks, net put premiums have been gradually rising, then surged sharply yesterday as fears grew that the bull cycle might be ending. The premium spiked during the selloff and continues to trade elevated, even as Bitcoin stabilizes near its support level. This trend confirms that hedging remains active, with traders still opting for protection over renewed risk-taking.
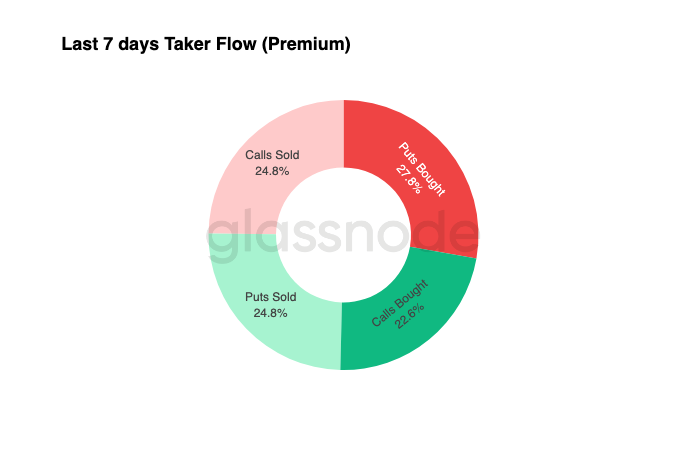
Flows Stay Defensive
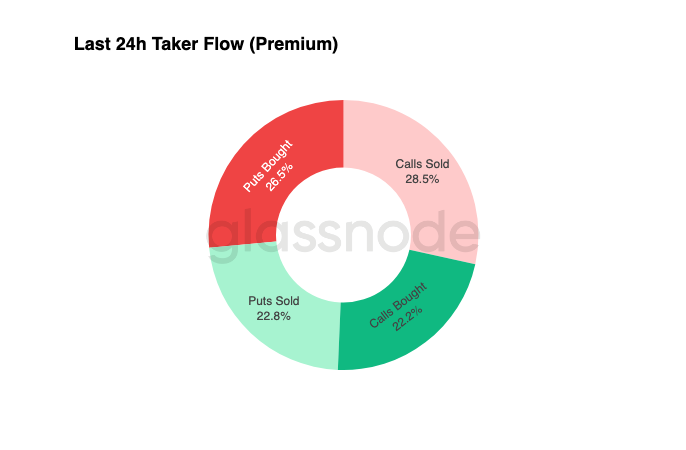
Flow data from the past seven days show that taker activity has been dominated by negative delta positioning, mainly through puts bought and calls sold. The last 24 hours still show no clear signs of a bottom. Dealers remain long gamma, having absorbed significant risk from yield-seeking traders, and are likely to monetize price swings in both directions.
This setup keeps volatility elevated but controlled, maintaining a cautious tone. Overall, the environment continues to favor defensiveness over aggressive risk-taking, with the absence of a clear upside catalyst. However, as downside protection remains expensive, some traders may soon start fading that risk premium in search of value.
Successful options trading is about monetizing positions built before the move. A profitable book requires reducing exposure into strength and taking profits on hedges when fear dominates the market. At present, traders aren’t buying the dip, but the current setup still offers asymmetric opportunities—allowing disciplined participants to position early for the next leg once volatility and sentiment begin to reset.
Conclusion
Bitcoin’s break below the Short-Term Holders’ Cost Basis (~$112.5K) and subsequent stabilization around $100K mark a decisive shift in market structure. So far, this correction mirrors prior mid-cycle slowdowns, with 71% (70%-90%) of supply still in profit and Relative Unrealized Loss contained at 3.1% (<5%), suggesting a mild bear phase rather than a deep capitulation. However, sustained long-term holder distribution since July and continued outflows from ETF products underscore weakening conviction across both retail and institutional fronts.
The Active Investors’ Realized Price (~$88.5K) remains a critical downside reference if selling persists, while reclaiming the Short-Term Holders’ Cost Basis would signal renewed demand strength. Meanwhile, the Perpetual Market Directional Premium and CVD bias both point to a retreat from speculative leverage and thinning spot participation, reinforcing a risk-off environment.
In the options market, elevated put demand, rising premiums at the $100K strike, and a modest rebound in implied volatility confirm a defensive tone. Traders continue to prioritize protection over accumulation, reflecting hesitation to call a bottom.
Overall, the market remains in a fragile equilibrium; oversold but not panicked, cautious yet structurally intact. The next directional impulse will likely hinge on whether renewed demand can absorb ongoing long-term holder distribution and reclaim the $112K–$113K region as firm support, or whether sellers maintain control and extend the current downtrend.
Disclaimer: This report does not provide any investment advice. All data is provided for informational and educational purposes only. No investment decision shall be based on the information provided here, and you are solely responsible for your own investment decisions.
Exchange balances presented are derived from Glassnode’s comprehensive database of address labels, which are amassed through both officially published exchange information and proprietary clustering algorithms. While we strive to ensure the utmost accuracy in representing exchange balances, it is important to note that these figures might not always encapsulate the entirety of an exchange’s reserves, particularly when exchanges refrain from disclosing their official addresses. We urge users to exercise caution and discretion when utilizing these metrics. Glassnode shall not be held responsible for any discrepancies or potential inaccuracies.
Please read our Transparency Notice when using exchange data.