The Week Onchain (Week 45, 2021)

Bitcoin investor conviction appears to be at all-time-highs, alongside numerous metrics ranging from price, to hash-rate, to proportion of mature coin supply.

The Week Onchain (Week 45, 2021)

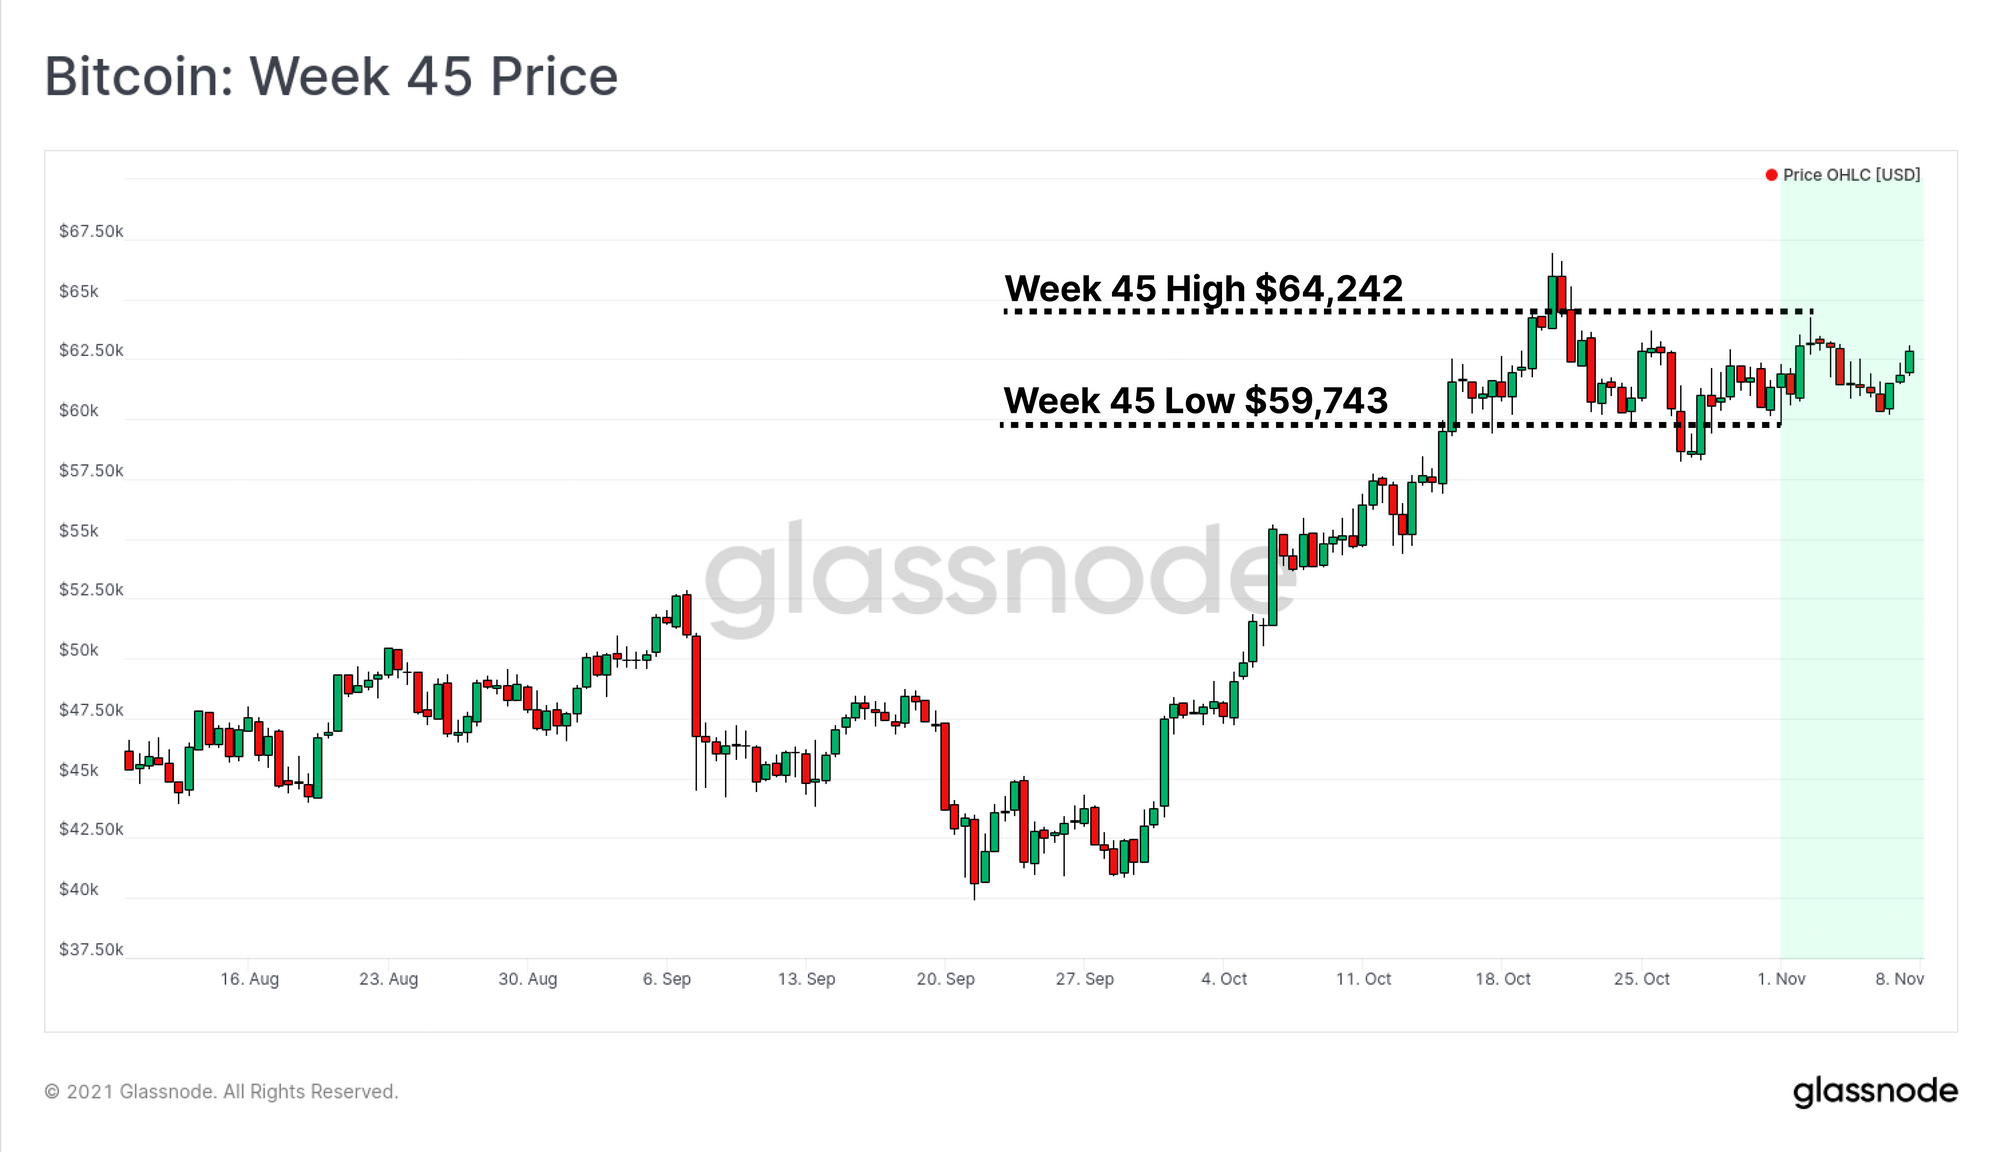
Bitcoin has had a remarkably strong week, consolidating between $59,743 and $64,242, holding onto almost all of Octobers gains. As the Bitcoin price coils into what appears to be a very tight bull flag, the on-chain market continues to show strength in supply dynamics, whilst on-chain activity remains well below bull market highs.

Long-Term Holders have distributed a very small fraction of their holdings, as is typically observed in all prior cycles. However, despite hovering just below ATHs, on-chain activity remains only marginally above bear market levels. Additionally, exchange balances continue to deplete, and miner hashrate and USD revenue are approaching new highs.

This combination of strong supply dynamics, mining network recovery, and relatively low network activity points to a fairly constructive outlook for Bitcoin over the coming weeks.


Week On-chain Dashboard

The Week On-chain Newsletter now has a live dashboard for all featured charts here. We have also started production for Week On-chain video analysis to provide a deeper dive into the thesis and logic behind each weeks analysis. Visit and subscribe to our YouTube channel, and visit our Video Portal to see our video content.


Assessing Supply Side Dynamics

Onchain analysis provides us with a view over the movement of coins between investor, exchange, and other entity wallets. Generally speaking, we use a combination of coin lifespan (time since last spent), and heuristics to distinguish between experienced smart-money, and inexperienced new investors.

Typical behaviour as Bitcoin prices approach ATHs is that Long-Term Holders (LTHs) (experienced investors) begin their distribution. As Bitcoin pushed to the recent ATH of $66k, supply held by LTHs also reached 'Peak HODL'. This is the point in time where they collectively owned a local maxima of the entire coin supply, 81.5% in this case.

Since then, LTHs have spent 0.73% of the coin supply back into liquid circulation, providing an upper bound estimate for the degree of sell-side pressure sourced from this cohort.

Live Chart

This spending behaviour has even slowed down the Long-term Holder Net Position change metric, which has been in a large accumulation period since April this year. The rate of LTH accumulation reached over 400k BTC per month for around 5-months through to late-September, and has now returned to a neutral level. This indicates that over the last 30-days, LTH supply is flat on net, and an equivalent volume of coins are maturing into LTH status, as are being spent out of it.

Live Chart

We can see similar spending behaviour in the Spent Volume Age Bands, where the dominance of coins older than 1-month has risen to 6% of total on-chain volume. Note however that levels of 6% were commonplace throughout much of 2021, and especially in Q1 where it reached over 10% as the bull market powered higher.

This metric highlights that whilst older coins are increasingly on the move, the market appears to be absorbing the sell-side without issue. Note also that bull markets can often sustain this elevated sell-side pressure for some time before topping out.

Live Chart

To provide a quantitative estimate of the sell-side, we can look to the revived supply metric, tracking how many coins older than 1yr are coming back into liquid circulation. Generally speaking, investors who have weathered Bitcoin volatility for 12mths, are quite likely to have a reasonable gauge of market risk, and what is considered expensive vs cheap coins.

What we can see is that around 6.5k BTC are being revived on a daily basis at present. What is also apparent is that this is a relatively low level compared to the 2017, 2019 and 2021 bull runs where over 20k BTC were revived per day. In fact the current levels of revived supply are similar to the spending patterns throughout late 2019 to 2020 which are mostly considered a late stage bear market.

Live Chart

To further drive home how relatively light the current spending is, we can review the HODL waves, filtered for coins younger than 3mths. This metric will trend higher when older coins, held by experienced investors are distributed and sold.

By definition, given the coin supply younger than 3mths is at an all-time-low of 15%, this means that coins older than 3mths are at an all-time-high of 85% of supply. Over 85% of the coin supply has remained dormant since August 2021. Investors are just not spending their coins.

The above supply dynamics paint a compelling picture of Long-term Holders hanging onto onto the vast majority of their stack. Current spending appears to be closer to taking strategic profits, rather than a market wide exit due to a belief that these prices are expensive.

Live Chart

Assessing Demand Dynamics

The demand dynamics in a bull market tend to come in two phases:

  1. Smart money accumulation (pre-ATH), where on-chain activity is low, supply dynamics remain constructive, and most spending looks like strategic profits being taken.
  2. Hype and euphoria (post-ATH), as media coverage of the asset increases, retail trader interest rises, and on-chain activity starts to climb. Older, more experienced hands generally increase their distribution from this point onwards.

Both the sell-side supply dynamics described above, and the demand dynamics that follow, both speak strongly to current market characteristics still being of the first phase: smart money accumulation, albeit closer to the transition out of this phase.

The first evidence of this is exchange net flows, which continue to demonstrate a remarkable dominance of outflows. Outflows have accelerated this week, reaching over 5k BTC in net withdrawals on a daily basis.

Live Chart

As a result of continued exchange outflows, the aggregate BTC exchange balance has fallen to multi-year lows of 12.9% of circulating supply. Even as Bitcoin consolidates below ATHs, exchange reserves continue to deplete.

Live Chart

Meanwhile, on-chain activity is recovering, albeit very slowly, and certainly far below historical examples of Hype and Euphoria as in 2017 and Q1 2021. Transaction counts remain well below the peaks seen in the first half of 2021, currently around 225k transactions/day. This is coincident with levels seen throughout the 2019-20 bear market.

Live Chart

A very similar pattern can be seen in the number of new on-chain entities observable in the onchain transaction space. A very modest uptrend is in play with new entities hitting 110k per day. Again, this is barely above levels sustained throughout the 2019-20 bear market, where activity was between 90k and 110k new entities per day.

This observation of prices near ATHs, whilst on-chain activity is near bear market lows is quite a remarkable divergence. It speaks to a convincing case where the market is likely still in the quiet accumulation phase, punctuated by low activity, large exchange outflows, and very modest strategic spending by experienced holders.

Live Chart

Weekly Feature: Mining Market Recovery

The mining industry continues to recover after the extraordinary event of 52% of the hash-power network dropping offline, almost overnight. On a 7-day MA basis, hash-rate declined from 176 EH/s to 84EH/s during the second half of May.

This decline of 92 EH/s was equivalent to the entire hash-power of the network up to October 2019. Since the low in early June, hash-rate has recovered by 95% to reach 164 EH/s. Given the current recovery trend, the mining market hash-rate could very well reach new ATHs before the end of 2021.

Live Chart

Miner revenues denominated in BTC are well know to decline dramatically every four years, as the block subsidy component is programatically halved. With transaction fees included, the current aggregate miner revenue fluctuates between 900 and 1,000 BTC per day.

There remains an ongoing debate regarding whether these halving events are likely to adversely affect protocol security long term. We won't analyse this fully here, but the following charts offer some commentary on the current trend and state of play.

Live Chart

Whilst miner incomes are denominated in BTC, their incurred costs of hardware, logistics, power and financing are denominated in fiat currency. Whilst the block subsidy is indeed at the lowest level in history, miner revenues in fiat currency are anything but.

Since the halving event in May 2020, USD aggregate revenues are up over 550%, rising from $9.3M/day to over $60M/day. In fact daily revenue is almost at all-time highs, off by just 5% from the peak of $67M/day set in May. This means the mining industry is being paid almost at the highest level in history for their services.

Live Chart

One approach to assess the total aggregate investment into the Bitcoin mining industry is via the Thermocap, a metric that calculates a cumulative sum of all USD value block rewards since genesis. The assumption is that miners are rational, profit motivated actors, and will thus invest up to $99.99 to win a reward of $100.

The Bitcoin Thermocap is technically always at ATH, but its growth has accelerated alongside rising price lately to reach $32.8B. In the approx 18mths since the May 2020 halving, the Thermocap has grown by 93%, up a total of $15.8B. In other words, 93% of all USD denominated security budget has been issued in the last 18mths, even after the latest halving event.

With Bitcoin hash-rate almost fully recovered from a 52% decline, miner USD revenues near ATHs, and 93% of the security budget issued in the last 1.5yrs, the Bitcoin security and incentives system appears to be functioning exceptionally well.

Such a simple protocol design, with simply extraordinary results.


Product Updates


Disclaimer: This report does not provide any investment advice. All data is provided for information purposes only. No investment decision shall be based on the information provided here and you are solely responsible for your own investment decisions.