Echoes of Early 2022
Bitcoin stabilizes above the True Market Mean, but market structure now mirrors Q1 2022 with over 25% of supply underwater. Demand is weakening across ETFs, spot, and futures, while options show compressed volatility and cautious positioning. Holding $96K–$106K is critical to avoid further downside.


Executive Summary
- Bitcoin stabilizes above the True Market Mean, but the broader structure now resembles Q1 2022 with >25% of supply underwater.
- Capital momentum remains positive, supporting consolidation, though far below mid-2025 peaks.
- 0.75–0.85 quantile band ($96.1K–$106K) is the key zone for restoring structure; failure increases downside risk.
- ETF flows turn negative, and spot CVD rolls over, signalling weakening demand.
- Futures open interest declines and funding resets neutral, reflecting a risk-off stance.
- Options market sees IV compression, softer skew, and flows shifting from puts to cautious call selling.
- Options appear underpriced, with realised volatility exceeding implied, putting pressure on short-gamma traders.
- Overall, the market remains fragile, dependent on holding key cost-basis zones unless macro shocks break the balance.
On-Chain Insights
Bottom or Breakdown?
Over the past two weeks, Bitcoin has dropped toward and found support near a critical valuation anchor known as the True Market Mean — the cost basis of all non-dormant coins, excluding miners. This level often marks the dividing line between a mild bearish phase and a deep bear market. Although price has recently stabilized above this threshold, the broader market structure is increasingly echoing the dynamics of Q1 2022.
Using the Supply Quantiles Cost Basis Model, which tracks the cost basis of supply clusters held by top buyers, the resemblance becomes clearer. Since mid-November, spot price has fallen below the 0.75 quantile, now trading near $96.1K, placing more than 25% of supply underwater.
This creates a fragile balance between the risk of top-buyer capitulation and the potential for seller exhaustion to form a bottom. Nevertheless, the current structure remains highly sensitive to macro shocks until the market can reclaim the 0.85 quantile (~$106.2K) as support.

Pain Dominates
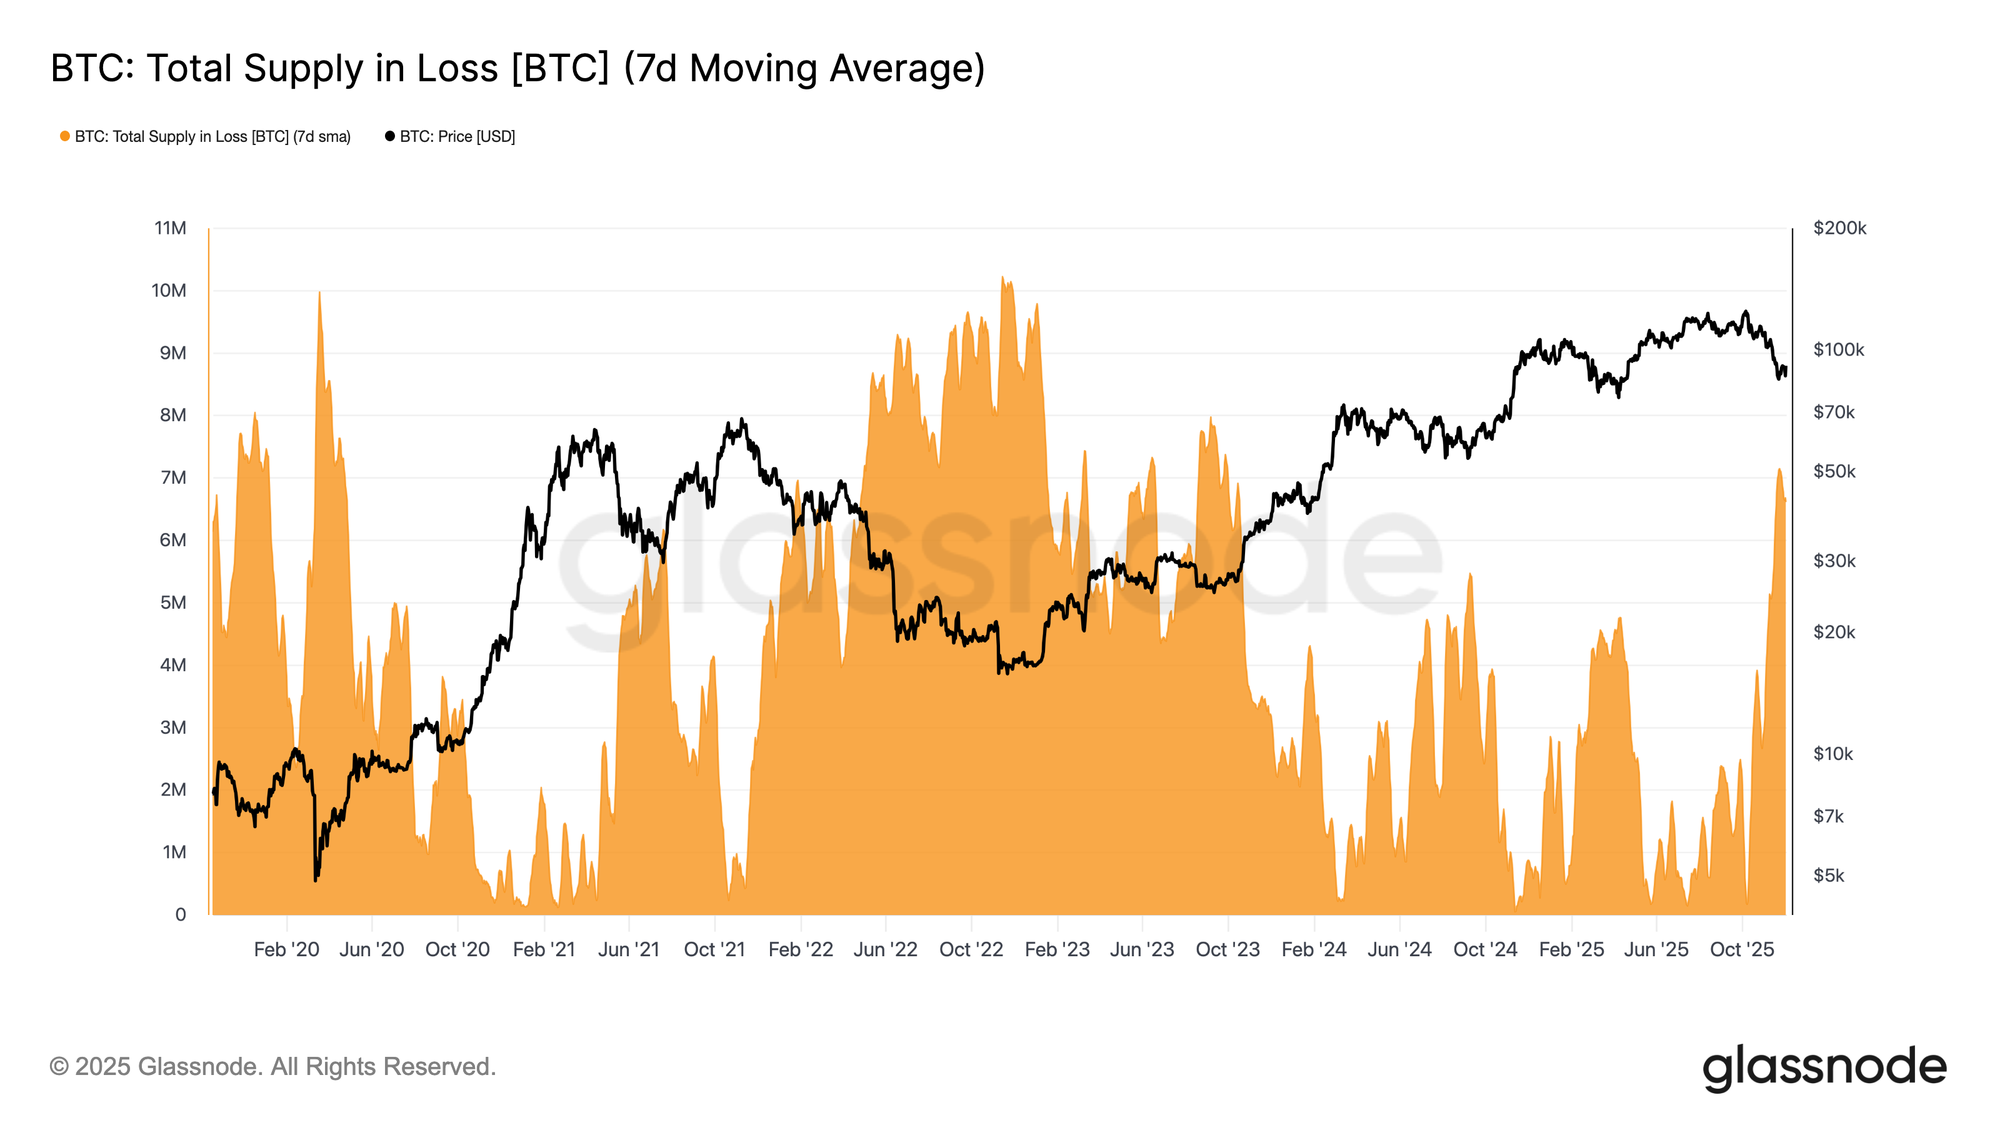
Building on this structural view, we can zoom in on the top-buyer supply to gauge the dominance of loss, and therefore unrealized pain, using Total Supply in Loss. The 7D-SMA of this metric climbed to 7.1M BTC last week — the highest level since September 2023 — highlighting that more than two years of bull market price expansion now sit against two shallow bottom-formation phases.
The current scale of supply in loss, ranging between 5M–7M BTC, is strikingly similar to the early-2022 sideways market, further reinforcing the resemblance noted above. This comparison once again underscores the True Market Mean as the key threshold separating a mild bearish phase from a transition into a more definitive bear market.
Momentum Remains Positive
Despite the strong similarities to Q1 2022, the momentum of capital flowing into Bitcoin remains slightly positive, helping explain the support at the True Market Mean and the subsequent recovery above $90K. This capital momentum can be measured using the Net Change in Realized Cap, which currently sits at +$8.69B per month — far below the $64.3B/month peak of July 2025, yet still decisively positive.
As long as capital momentum remains above zero, the True Market Mean can continue to serve as a consolidation area and potential bottom formation zone, rather than the beginning of a deeper breakdown.

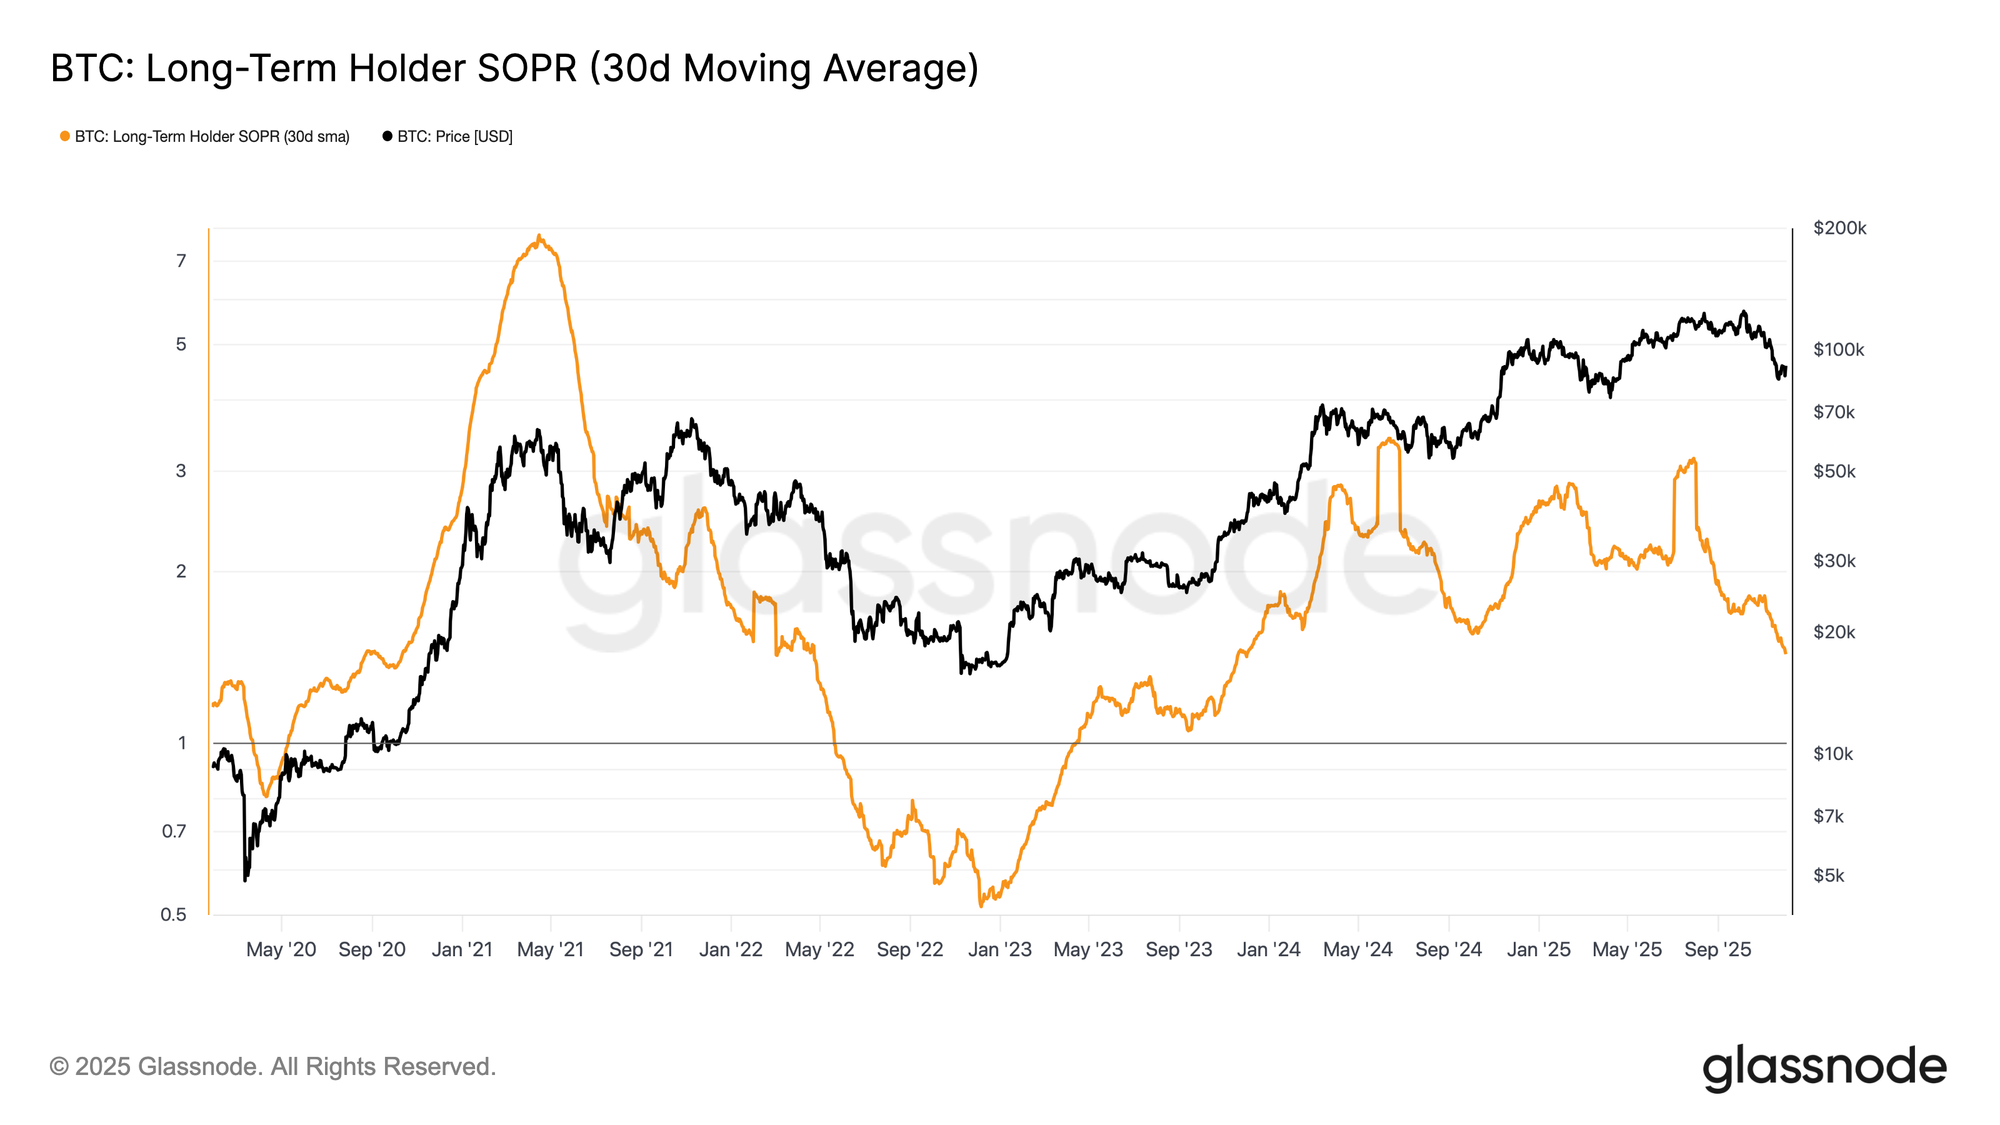
Long-Term Margins Fade
Remaining in a regime of positive capital inflow implies that new demand is still able to absorb the profit realization by long-term investors. The Long-Term Holder SOPR (30D-SMA), which measures the ratio between spot price and the cost basis of long-term holders who are actively spending, has declined sharply alongside price but remains above 1 (currently 1.43). This emerging trend in profit margins once again mirrors the Q1 2022 structure: long-term holders continue to spend in profit, but at a shrinking margin.
Although demand momentum is comparatively stronger than in early 2022, liquidity continues to trend lower, making it essential for bulls to hold above the True Market Mean until a new wave of demand enters the market.
Off-Chain Insights
ETF Demand Softens
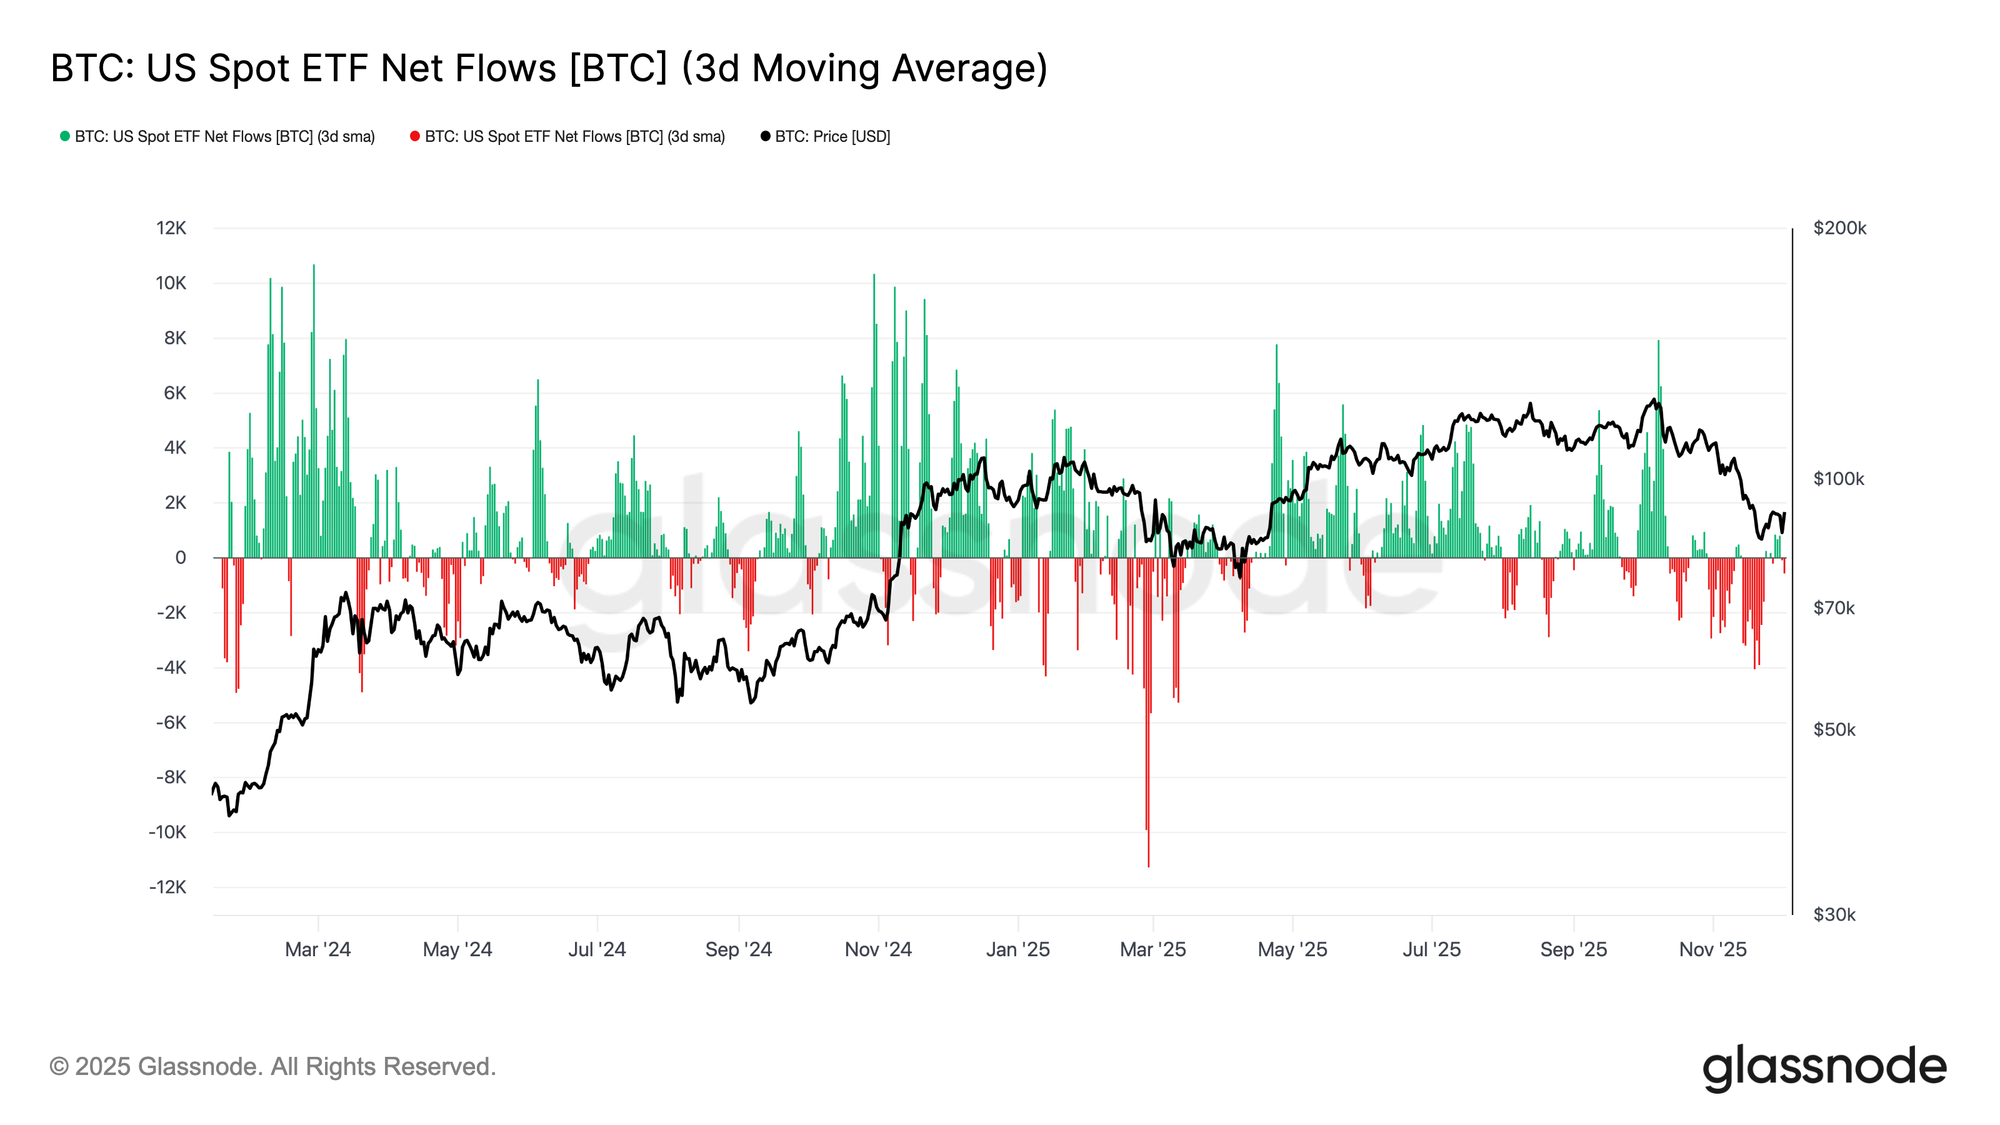
Turning to spot markets, US Bitcoin ETFs have seen a notable deterioration in net flows, with the 3-day average slipping firmly into negative territory throughout November. This marks a clear reversal from the persistent inflow regime that supported price earlier in the year, and reflects a cooling of new capital allocation into the asset. Outflows have been broad-based across issuers, indicating a more cautious stance from institutional participants as market conditions have weakened.
The spot market now faces a lighter demand backdrop, which reduces immediate buy-side support and leaves price more sensitive to external shocks and macro-driven volatility.
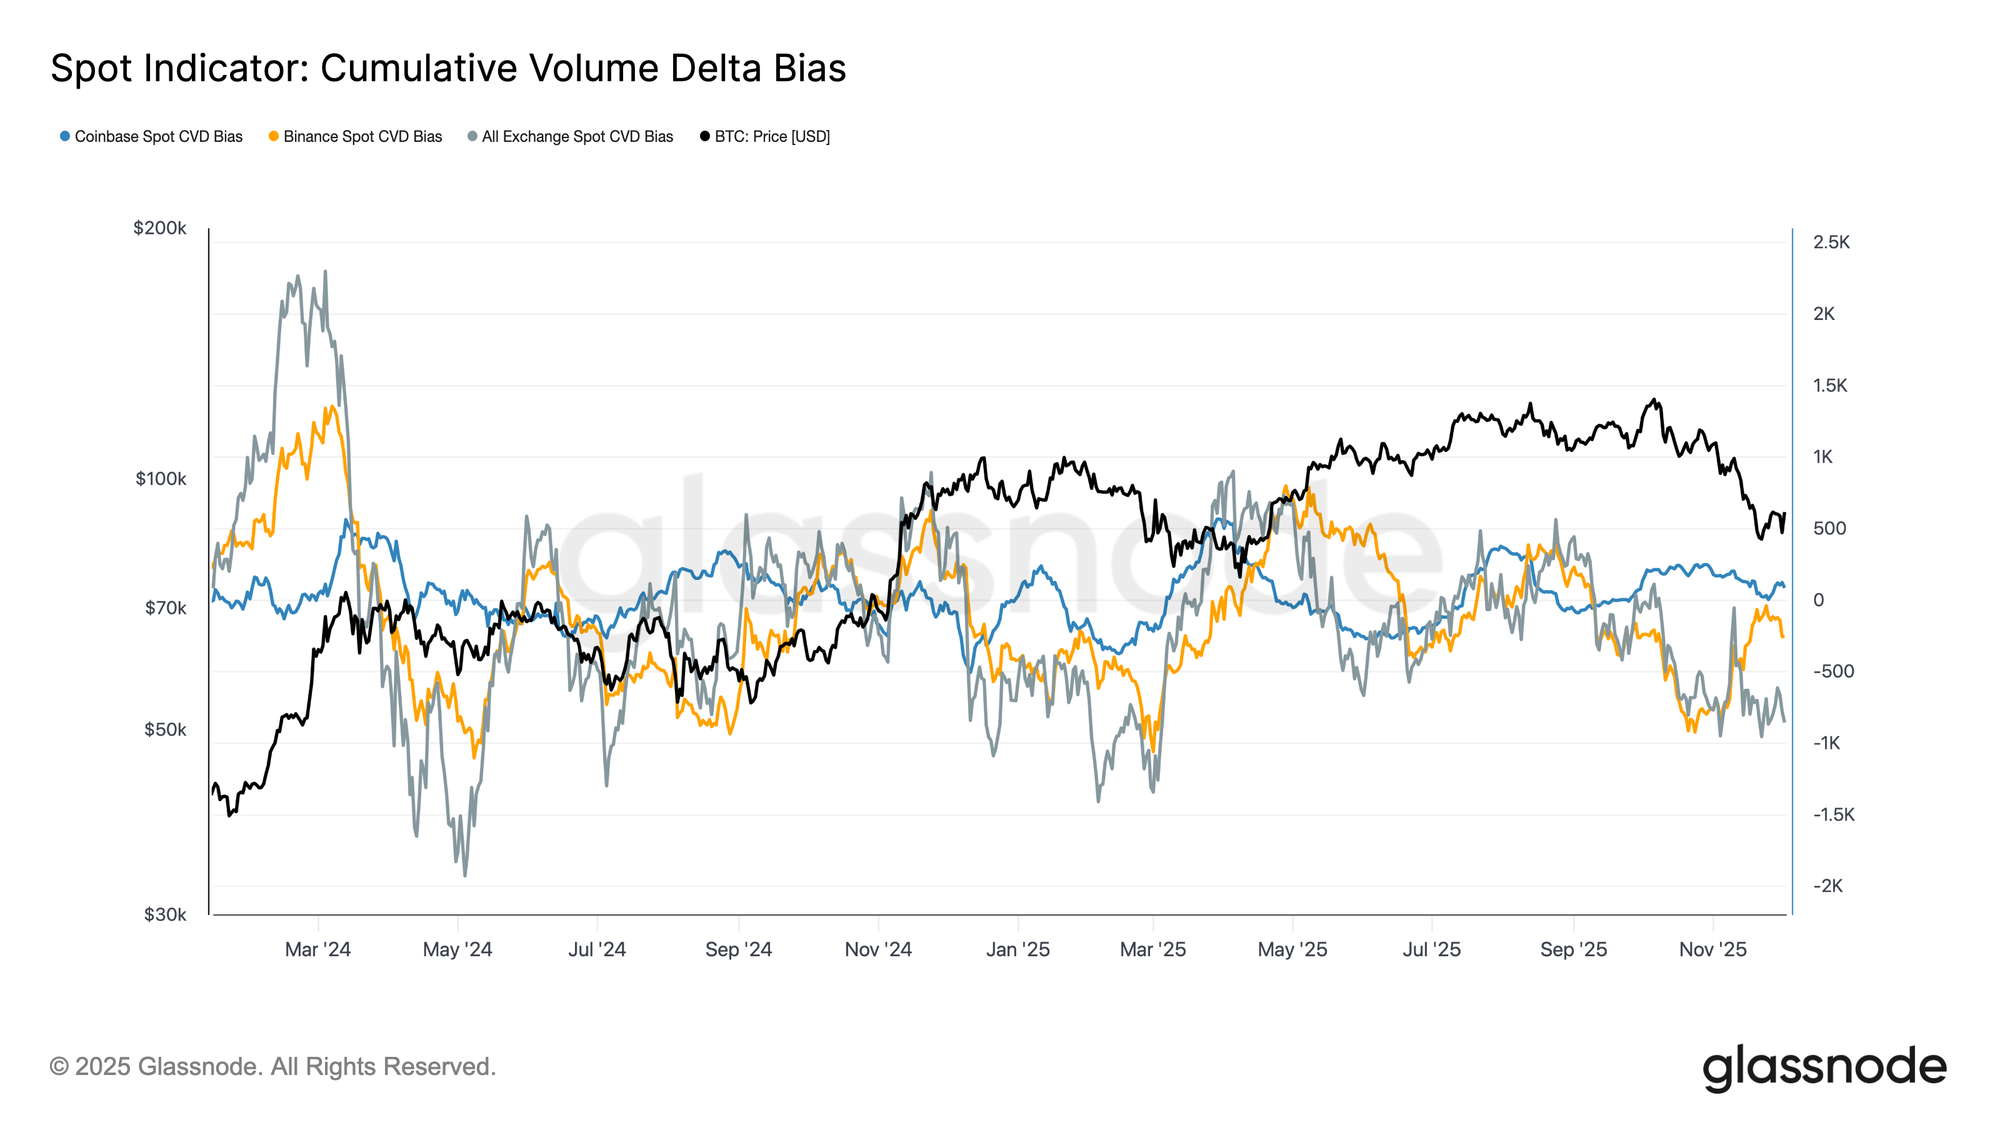
Spot Bid Weakens
Building on the deterioration in ETF demand, Cumulative Volume Delta (CVD) has also rolled over across major exchanges, with both Binance and the aggregated cohort trending persistently negative. This points to a steady increase in taker-driven sell pressure, as traders cross the spread to reduce risk rather than accumulate. Even Coinbase, often a bellwether for U.S. bid strength, has flattened, signalling a broader retreat in spot-side conviction.
With both ETF flows and spot CVD bias turning defensive, the market now rests on a thinner demand foundation, leaving price more vulnerable to continuation moves and macro-driven volatility.
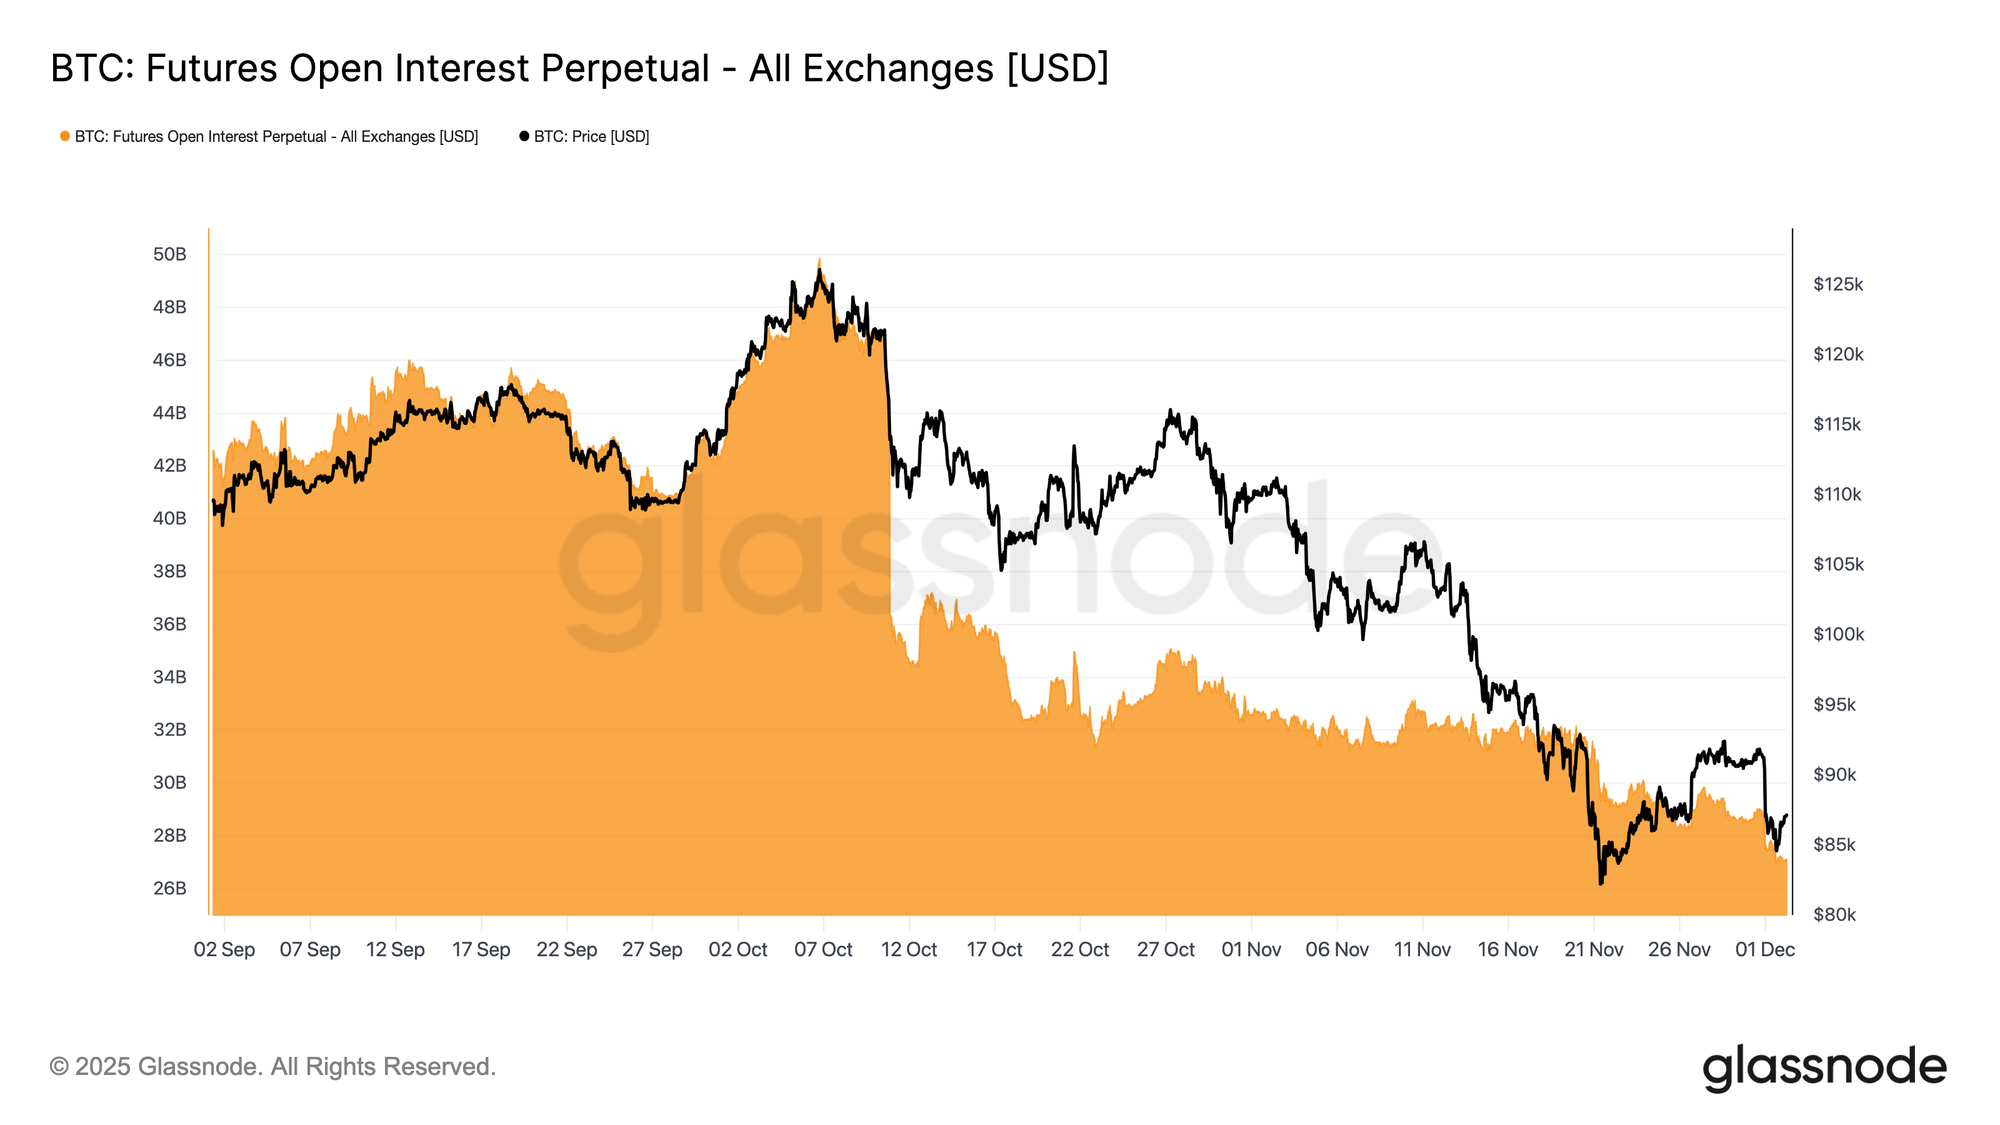
Open Interest Slips Lower
Extending this weakening demand profile into derivatives, futures open interest has continued its steady decline through late November. The unwind has been orderly but persistent, erasing much of the speculative build-up that accumulated during the prior uptrend. With no meaningful new leverage entering the market, traders appear reluctant to express directional conviction, instead favouring a conservative, risk-off stance as price grinds lower.
The derivatives complex now sits in a notably lighter state of leverage, signalling a clear absence of speculative appetite and reducing the probability of sharp, liquidation-driven volatility.
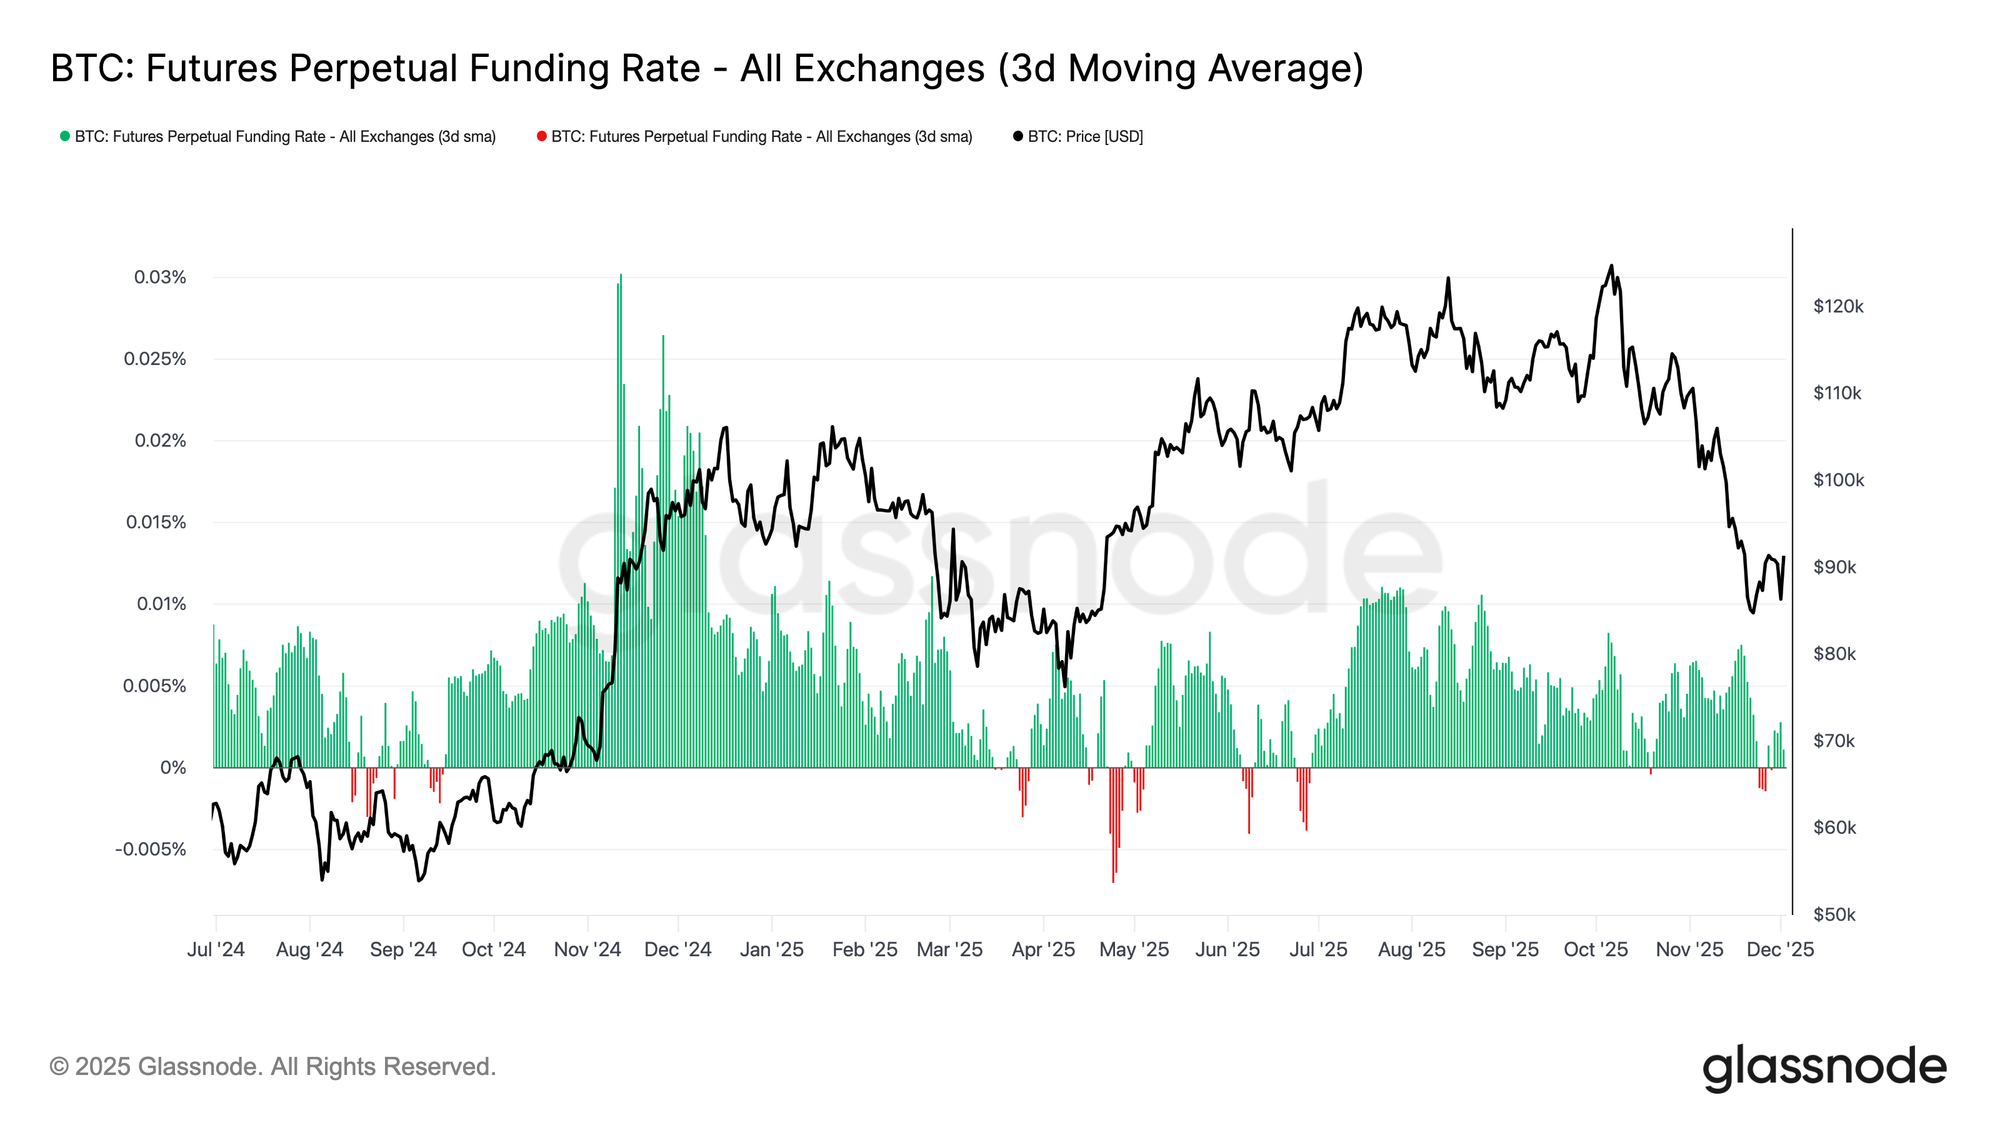
Neutral Funding Signals a Reset
With open interest continuing to contract, perpetual funding rates have cooled into broadly neutral territory, oscillating around zero for much of late November. This marks a clear shift from the elevated positive funding seen during prior expansions, suggesting that excess long positioning has largely been unwound. Importantly, periods of modestly negative funding have remained shallow and short-lived, indicating that traders are not aggressively leaning short despite the price drawdown.
This neutral-to-slightly-negative funding structure points to a more balanced derivatives market, where the absence of crowded long exposure reduces downside fragility and may set the stage for more constructive positioning should demand begin to stabilize.
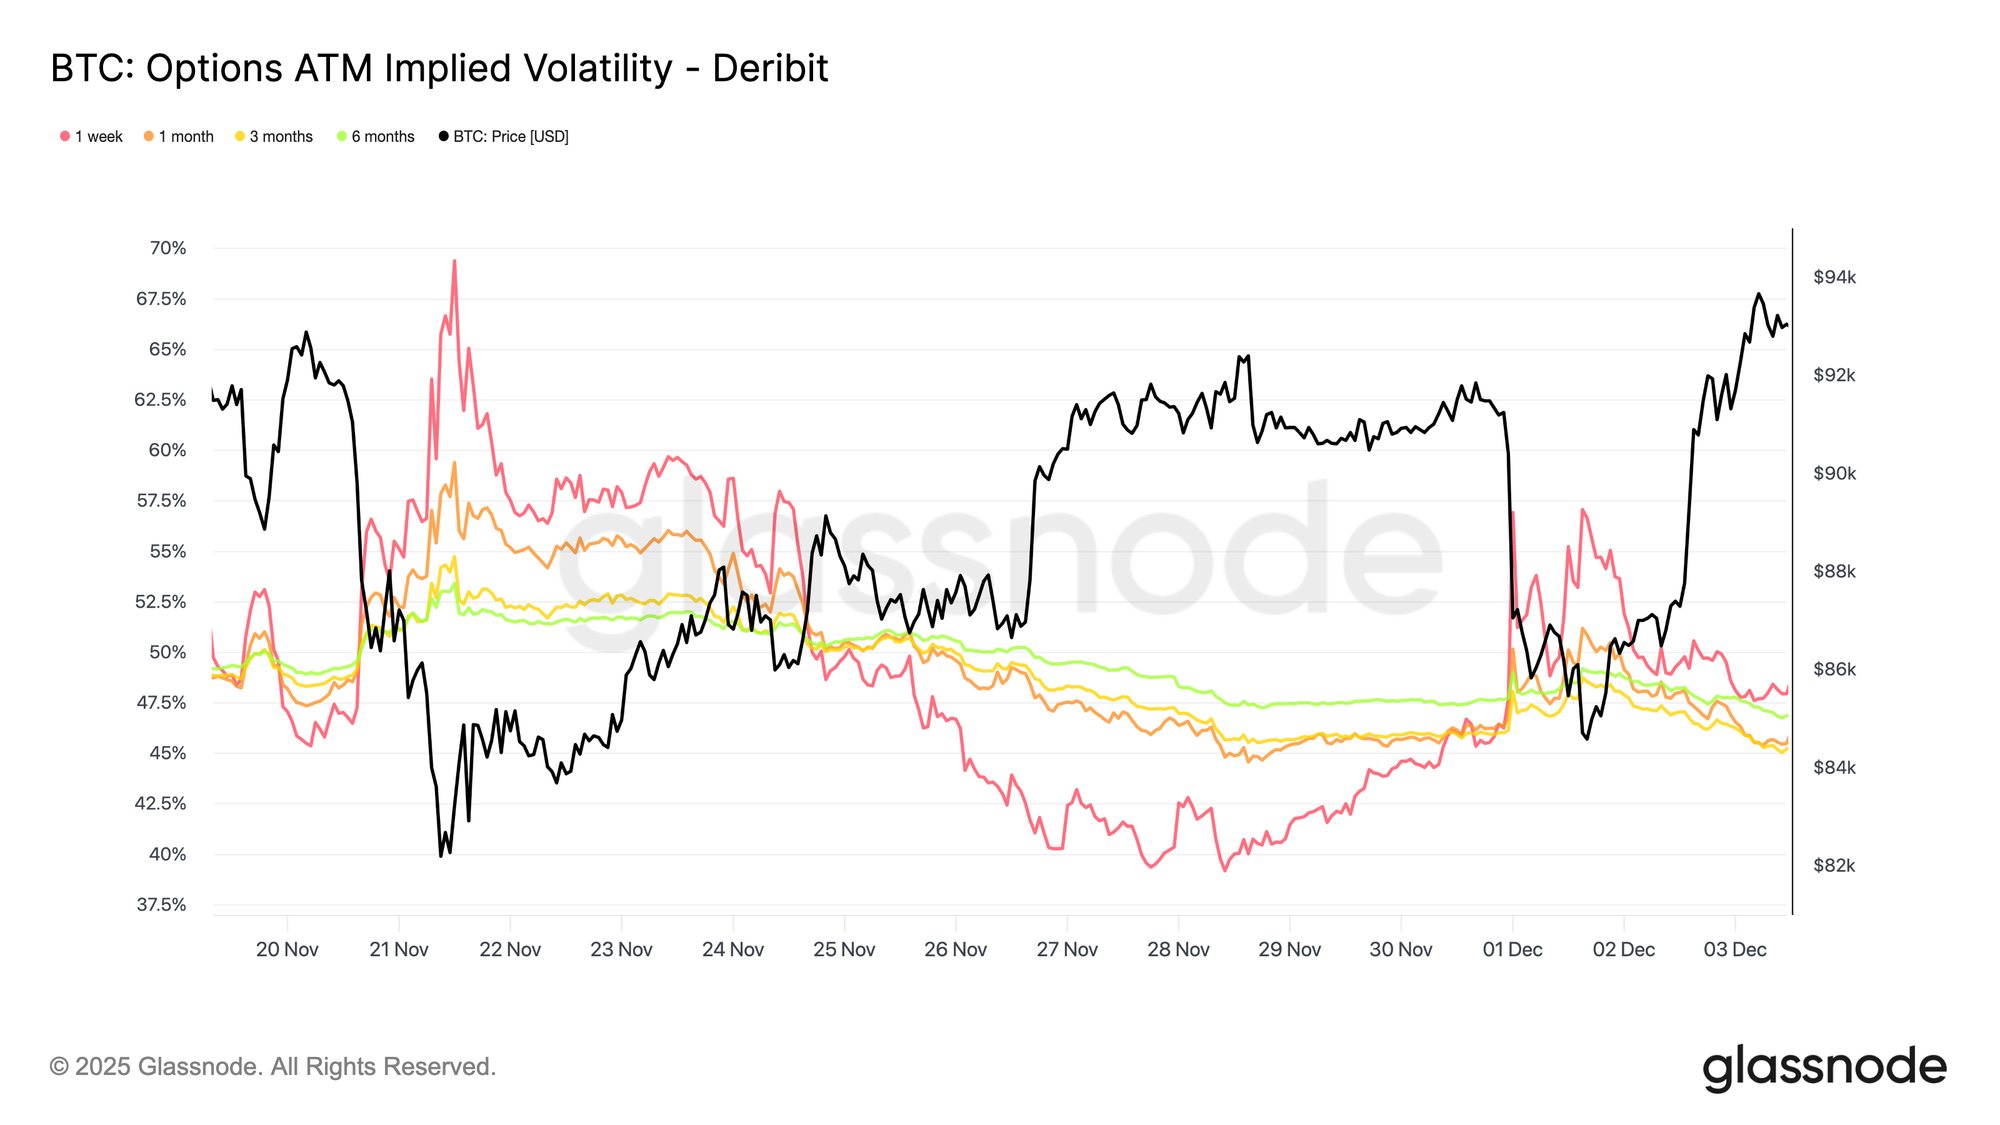
IV Resets Across the Curve
Moving to the options market, implied volatility offers a clean window into how traders are pricing future uncertainty. As a starting point, it is useful to track implied volatility since it reflects the market’s expectation of future price movement. Implied volatility has reset lower after last week’s elevated readings. Price has struggled to break above the 92K resistance, and the lack of follow-through on the rebound encouraged volatility sellers to step back in, pushing implied volatility lower across maturities.
Implied volatility declined meaningfully across the curve:
- Short-dated contracts fell from 57% to 48%
- Mid-tenor maturities declined from 52% to 45%
- Longer-dated expiries eased from 49% to 47%
This consistent reduction suggests traders see a lower probability of a sharp downside and expect a calmer near-term environment. The reset also signals a shift toward a more neutral stance, with the market moving away from the heightened caution seen last week.
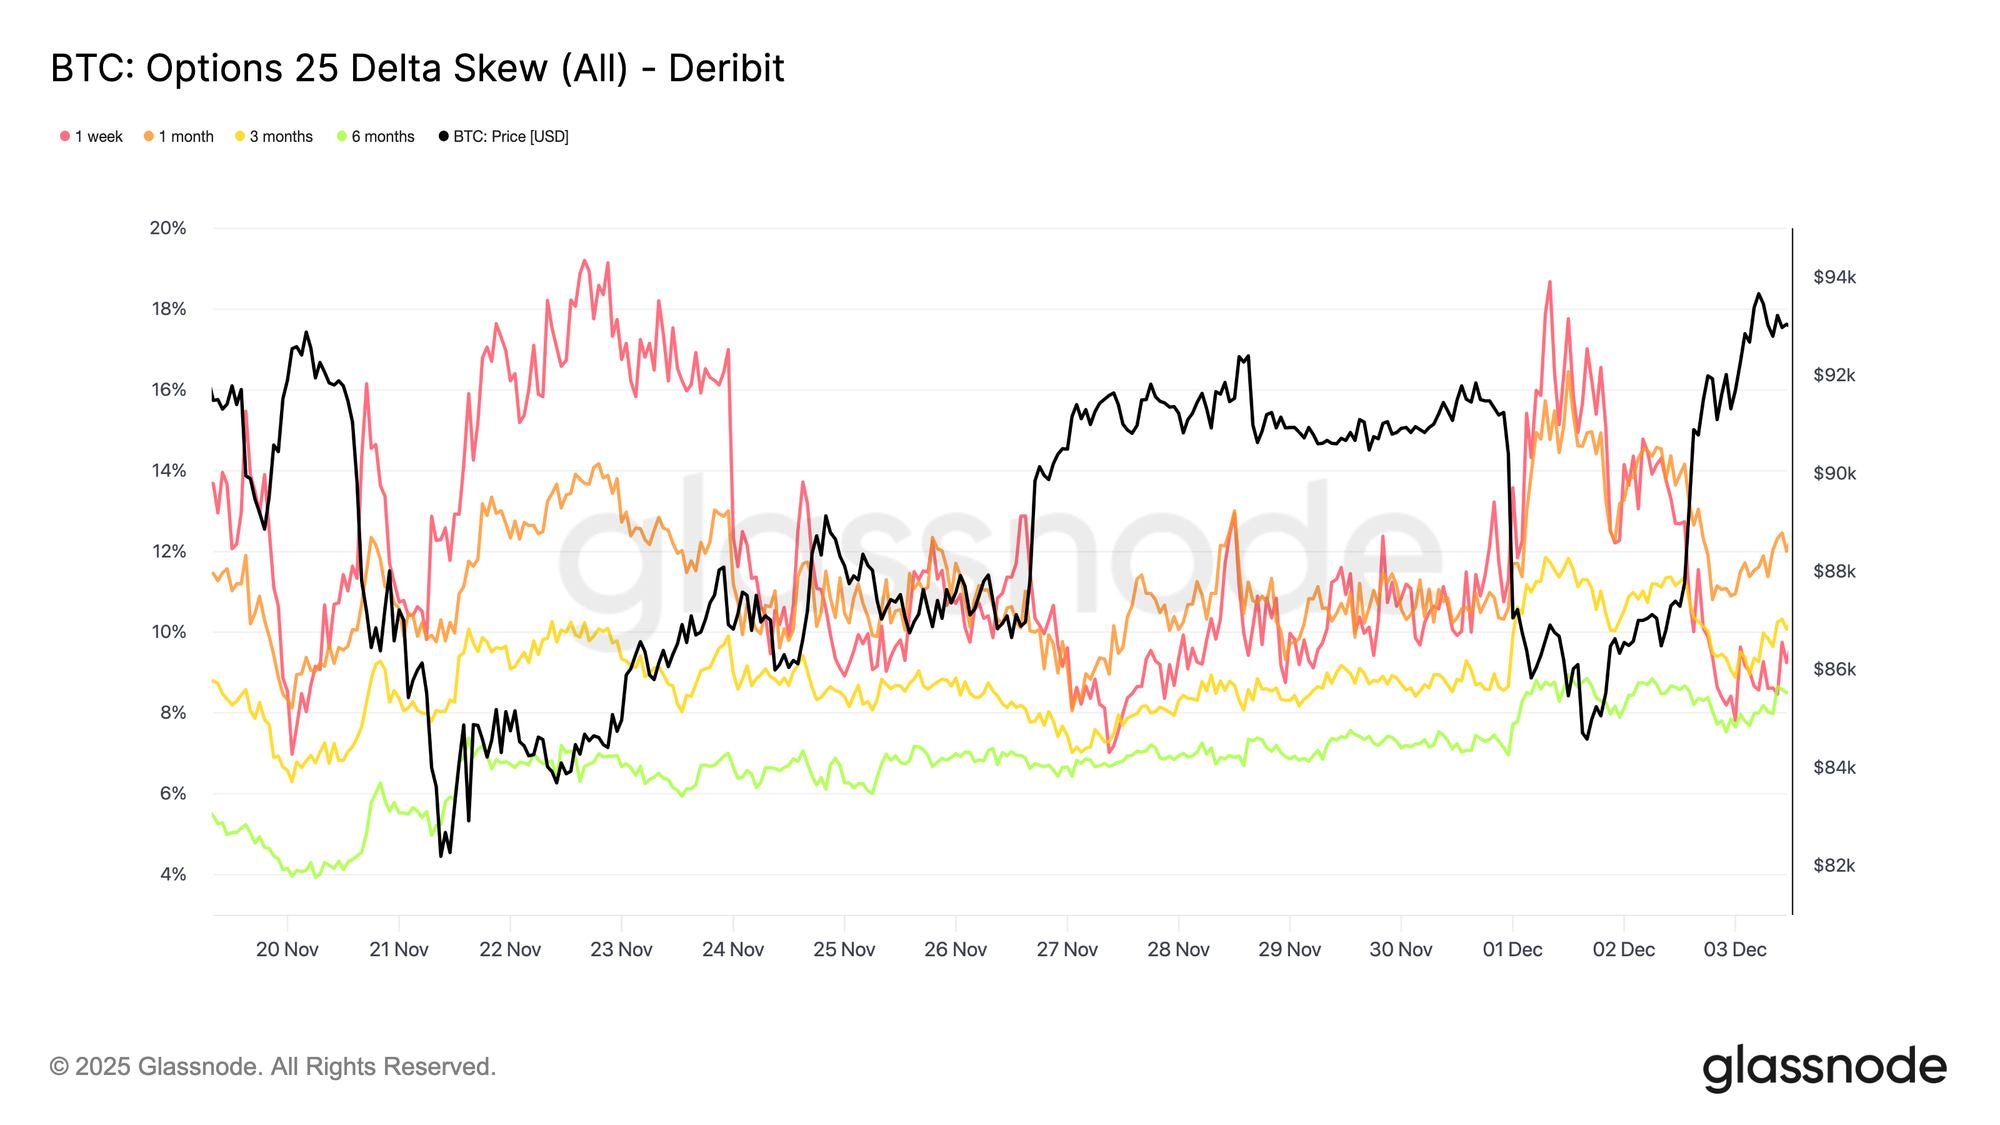
Bearish Skew Eases
After looking at implied volatility, skew helps clarify how traders assess downside versus upside risk. It measures the difference between the implied volatility of puts and calls. When skew is positive, traders are paying a premium for downside protection; when it is negative, they are paying more for upside exposure. The direction of skew matters as much as the level. For example, a short-dated skew of 8 percent carries a very different message if it has fallen from 18 percent in two days rather than risen from a negative reading.
Short-dated skew moved from 18.6% on Monday, during the decline to 84.5K driven by the Japanese bond narrative, to 8.4% on the rebound. This suggests the initial reaction was exaggerated. Longer maturities adjusted more slowly, indicating that traders are willing to chase short-term upside but remain unsure about its durability.
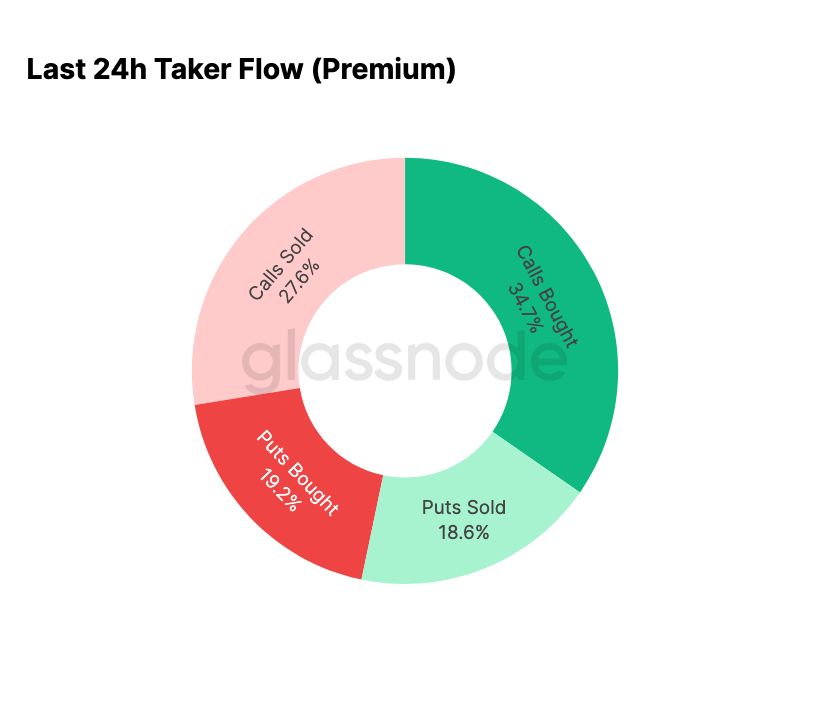
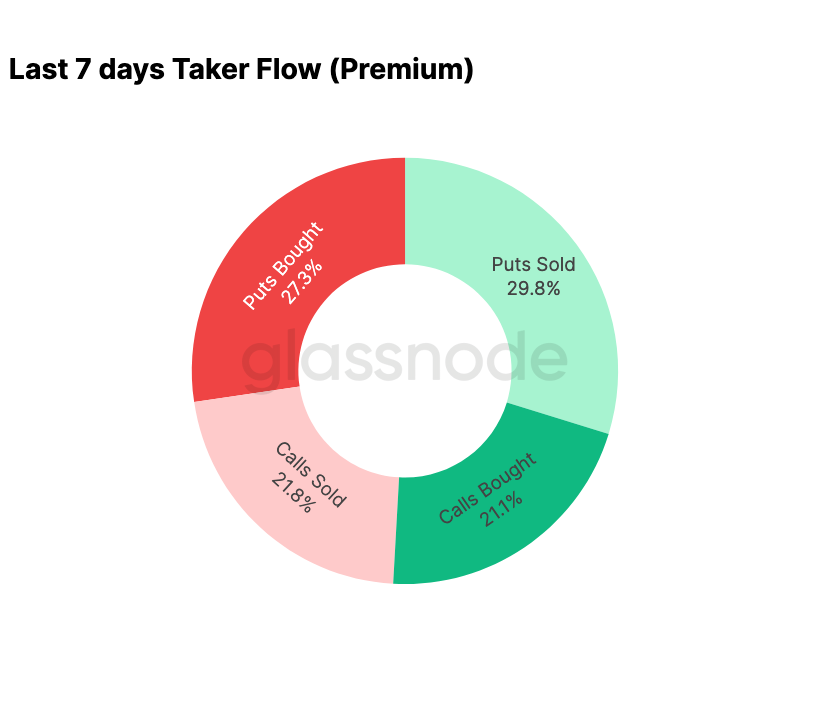
Fear Unwinds
The flow data shows a clear contrast between the past seven days and the rebound that followed. Early in the week, activity was dominated by put buying, reflecting fears of a repeat of the August 2024 price action tied to concerns over a potential Japanese carry-trade unwind. Because this risk has been experienced before, the market already had a sense of how far such contagion could spread and what kind of recovery typically follows. Once price stabilized, flows shifted quickly: the rebound brought a decisive tilt toward call activity, almost perfectly reversing the pattern seen during the stress period.
It is also worth noting that dealers remain long gamma at current levels and are likely to stay long into the year’s largest expiry on 26 December. This positioning typically keeps price movements contained. Once that expiry passes, positioning will reset, and the market will enter 2026 with a new set of dynamics.
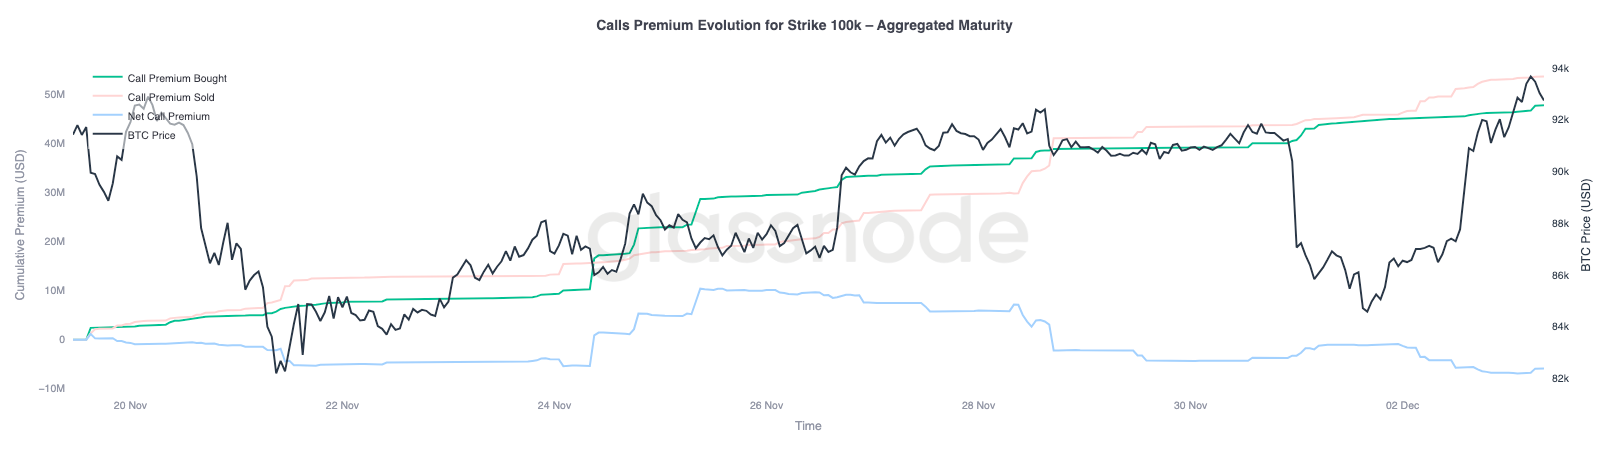
100K Call Premium Evolution
Focusing on the call premium at the 100K strike helps clarify how traders are approaching this key psychological level. On the right side of the chart, call premium sold remains above call premium bought, and the gap between the two has widened during the rebound over the past 48 hours. This widening suggests that conviction to reclaim 100K is still limited. The level is likely to attract resistance, especially with implied volatility compressing during upward moves and rebuilding during downward moves. This pattern reinforces the mean-reverting behaviour of implied volatility within the current range.
The premium profile also shows that traders are not positioning for an aggressive breakout ahead of the FOMC meeting. Instead, flow reflects a more cautious stance, where upside is being sold rather than chased. The recent recovery, therefore, lacks the conviction typically needed to challenge a level as significant as 100K.
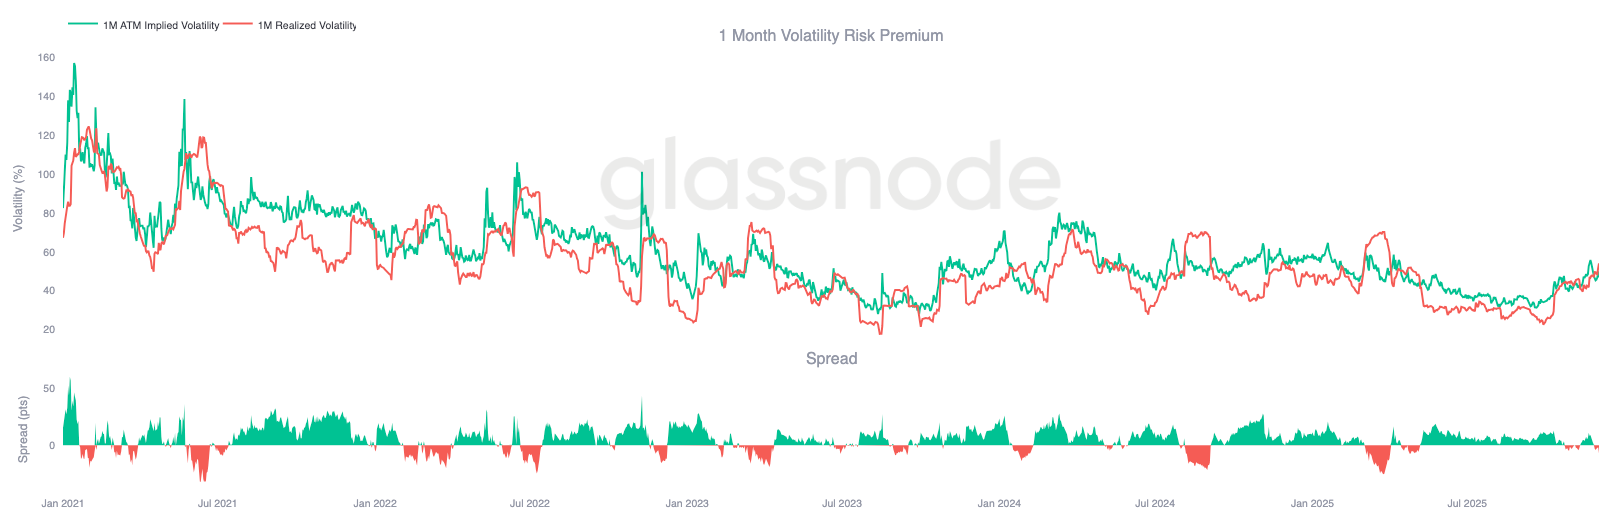
Underpriced Volatility
When we combine the reset in implied volatility with the sharp swings in both directions this week, the result is a negative volatility risk premium. The volatility risk premium is normally positive because traders require compensation for the risk of volatility spikes. Without that premium, traders who are short volatility cannot monetize the risk they assume.
At current levels, implied volatility is below realized volatility, meaning options are pricing in smaller moves than the market is delivering. This creates a favourable environment for being long gamma, since each swing can be monetized when realized moves exceed what was implied in the option price.
Conclusion
Bitcoin continues to trade within a structurally fragile environment where on-chain weakness and thinning demand intersect with a more cautious derivatives landscape. Price has briefly stabilized above the True Market Mean, yet the broader structure now closely resembles Q1 2022, with over 25% of supply underwater, rising realized losses, and heightened sensitivity to macro shocks. Positive capital momentum, though much softer than earlier in the year, remains one of the few constructive signals preventing a deeper breakdown.
Off-chain indicators reinforce this defensive tone. ETF flows have turned negative, spot CVD has rolled over, and futures open interest is steadily unwinding. Funding rates sit near neutral, reflecting neither bullish conviction nor aggressive short pressure. In the options market, implied volatility has compressed, skew has softened, flows have reversed, and options currently trade underpriced relative to realised volatility, signalling caution rather than renewed risk appetite.
Looking ahead, holding within the 0.75–0.85 quantile band ($96.1K–$106K) is critical for stabilizing market structure and reducing downside vulnerability into year-end. Conversely, the True Market Mean continues to serve as the most probable bottom-formation zone, unless a negative macro catalyst disrupts the market’s already delicate equilibrium.
Disclaimer: This report does not provide any investment advice. All data is provided for informational and educational purposes only. No investment decision shall be based on the information provided here, and you are solely responsible for your own investment decisions.
Exchange balances presented are derived from Glassnode’s comprehensive database of address labels, which are amassed through both officially published exchange information and proprietary clustering algorithms. While we strive to ensure the utmost accuracy in representing exchange balances, it is important to note that these figures might not always encapsulate the entirety of an exchange’s reserves, particularly when exchanges refrain from disclosing their official addresses. We urge users to exercise caution and discretion when utilizing these metrics. Glassnode shall not be held responsible for any discrepancies or potential inaccuracies.
Please read our Transparency Notice when using exchange data.