The Week Onchain (Week 52, 2021)

Bitcoin closes the year up 78%, having experienced a tumultuous, and volatile 2021. We provide a macro review of 2021 across the onchain, exchange, derivatives, and mining markets.

The Week Onchain (Week 52, 2021)

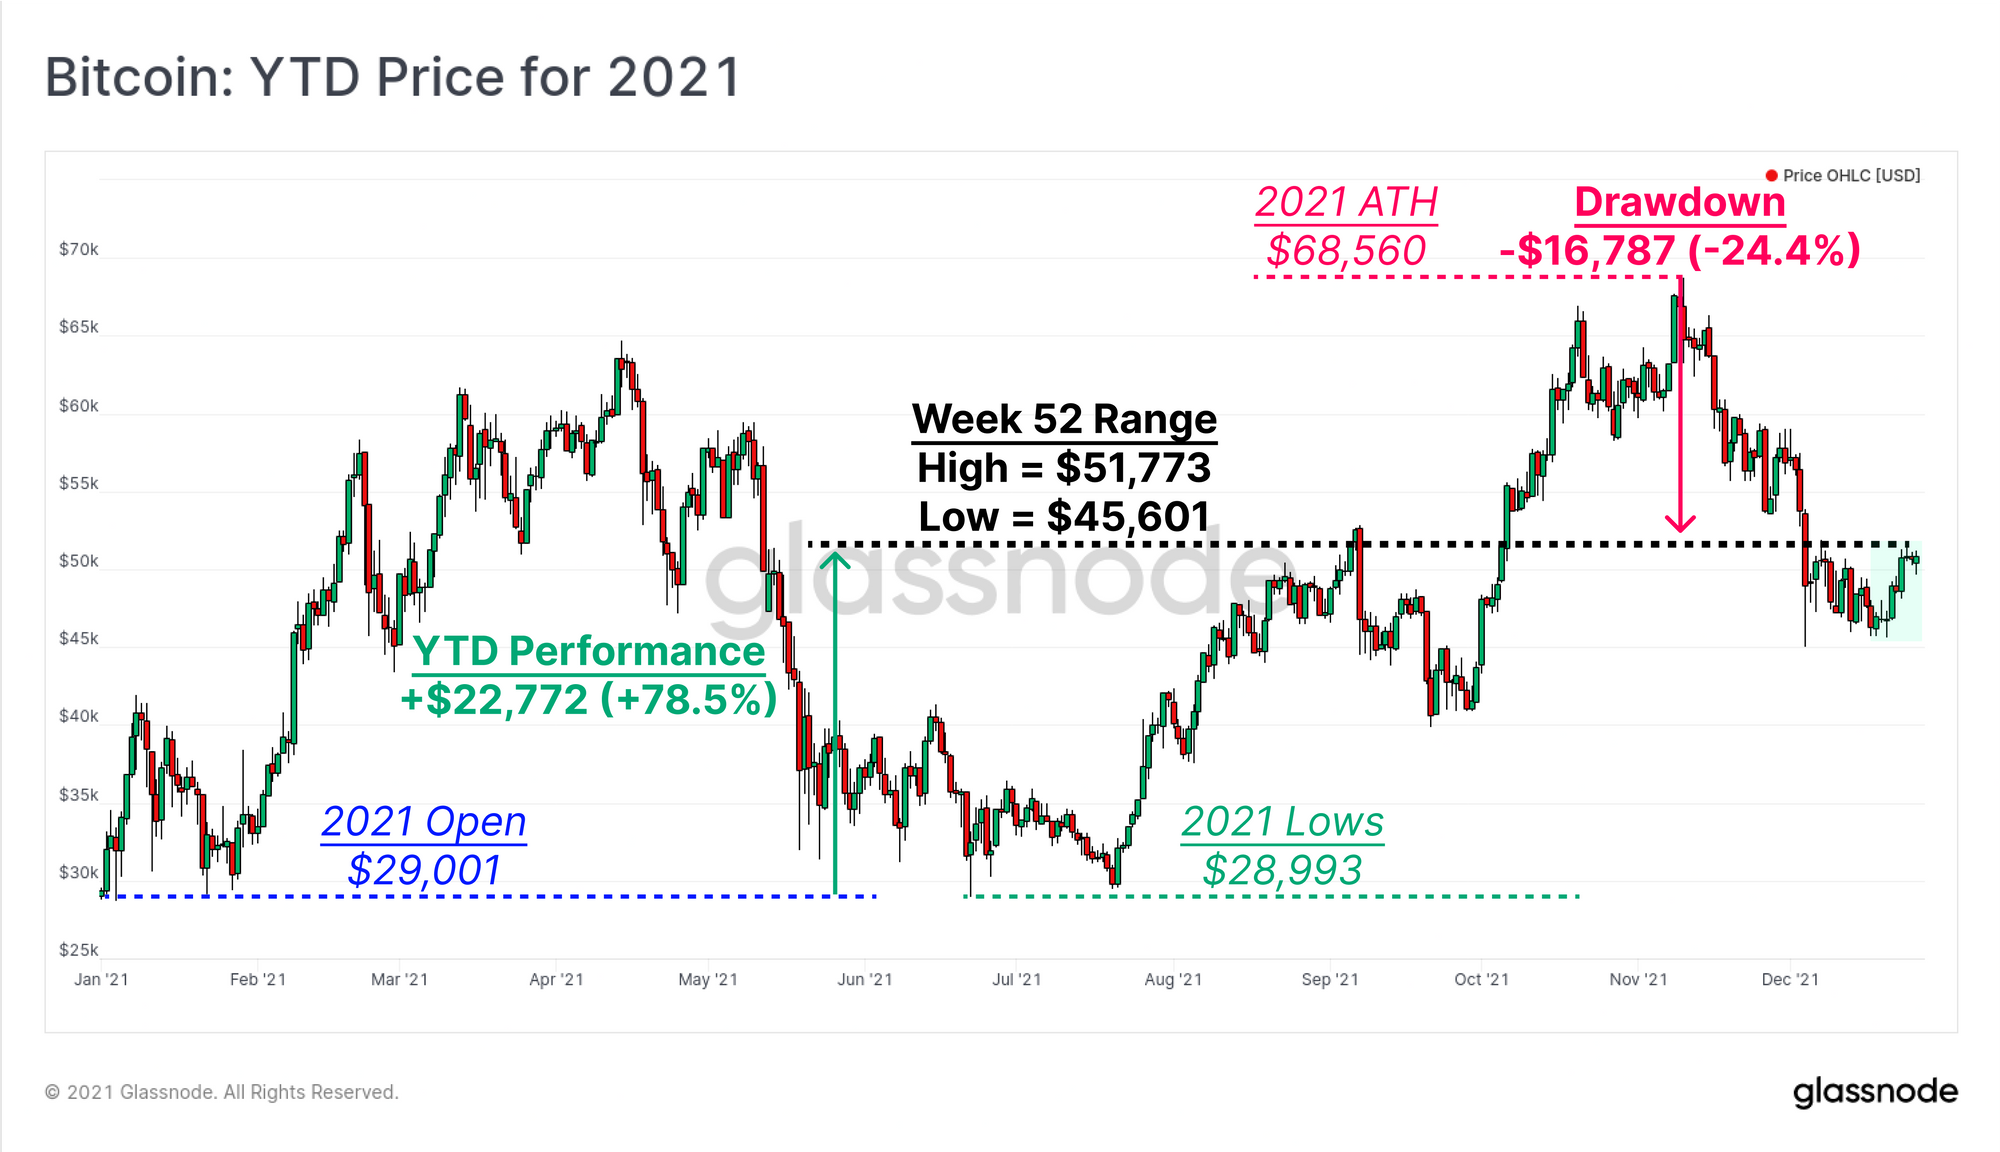
The Bitcoin market has traded only slightly higher over the end of year holiday season. The week opened at the consolidation low of $45,601, before rallying to local highs, hitting $51,773.

For our final newsletter of the year, we will provide a brief 2021 review of some year-to-date changes across both on-chain, exchange, derivatives, and mining datasets. When looking back at 2021, it interestingly appears to be a year best described as a macro, high time-frame consolidation, albeit a volatile one. The year-to-date summary for Bitcoin is:

  • Prices are up 78.5% from 1-Jan with a current drawdown of 24.4% from 10-Nov ATH.
  • The total Supply currently held at a loss is 3.480M BTC, equivalent to 18.34% of circulating supply.
  • Exchange balances saw a net yearly outflow of 67.8k BTC, a decline of just 2.5%.
  • Long-Term Holders added 1.846M BTC to their holdings, whilst Short-Term Holder supply declined by 1.428M BTC.
  • Futures Open Interest almost doubled, increasing by $9.57B (97%) whilst futures trading volume actually declined by 16% to $36.7B/day.
  • Mining hash-rate has finished 2021 up 27% on the year, after recovering entirely from the great migration where around 53% of miners were shut-off almost overnight.
  • Meanwhile, aggregate miner revenue is up 58% YTD, and up over 440% since in the halving event in May 2020.

Week On-chain Dashboard

The Week On-chain Newsletter now has a live dashboard for all featured charts here. We have also started production for Week On-chain video analysis to provide a deeper dive into the thesis and logic behind each weeks analysis. Visit and subscribe to our YouTube channel, and visit our Video Portal to see our video content.


A Brief Review of Bitcoin in 2021

As the recent correction from the ATH progressed lower, it put an increasingly large proportion of supply into an unrealised loss. Coins have been spent and redistributed through this time, which reshuffles the UTXO realised price distribution (URPD). At the time of writing, approximately 3.7M BTC, representing 19.5% of the supply are underwater.

On a more constructive note, a reasonably large volume cluster has been established in this weeks price range, equivalent to 2.214M BTC (11.7% of supply). This indicates that a non-trivial degree of demand has been mobilsed during the consolidation, with a large proportion of coins changing hands between $45k and $50k.

Live Chart

As price rallies to the top end of the consolidation range, we can see the percent of coins in an unrealised profit increased by 10.34%. We can use this to estimate an upper bound on the accumulation that has occurred lately (upper bound since some portion of these coins are likely held from previous instances where price was in this range).

Similar events of large increases (blue), or decreases (pink) in profitable supply are highlighted below, which typically follow periods of relatively heavy redistribution amongst the coin supply.

Live Chart

With respect to on-chain cohorts, there has been a noticeable redistribution in coin supply from Short-Term Holders, to Long-Term Holders. At the time of writing:

  • Long-Term Holders added 1.846M BTC to their holdings, bringing their total stack to 13.33M BTC. This reflects an increase of 16% over the year.
  • Short-Term Holder supply has declined by 1.428M BTC, with this cohort currently holding 3.01M BTC. This reflects a decline of 32% on the year.
  • Sovereign Supply, defined as all coins held outside exchange reserves, is currently at an all-time-high of 13.34M BTC.
Live Workbench Chart

As a proportion of Sovereign Supply, Long-Term Holders have seen their ownership stake increase by 4.8% to reach 74.8% of sovereign supply. To close out the year, LTHs now own 74.8% of all coins outside of exchange reserves, whilst STHs ownership has declined from 28.0% in Jan, to 25.2% today.

This modest transfer of wealth from Short-Term, to Long-Term Holders, despite multiple price ATHs, suggests that 2021 is best described as a macro consolidation, and a period of modest accumulation. Such on-chain behaviour is more typically observed during Bitcoin bear markets, which in hindsight are effectively lengthy periods of coin redistribution from weaker hands, to those with stronger, and longer-term conviction.

Live Chart

The counterpart to Sovereign Supply, is Exchange Balances, which impressively have seen very little net change over the course of the year. Exchange reserves have declined from 2.623M BTC at the start of the year, to 2.560M BTC. This is a net decline of 67.8k BTC, a reduction of just 2.5% from the opening balance. The chart of coins held in exchanges shows a general oscillation over time, with net inflows from May to July, and net outflows otherwise.

Live Chart

We can see this behaviour more clearly in the Net Volume in/out of exchanges, which has spent 2021 oscillating between ±5k BTC. In fact over the course of the last week, we have seen another reversal from net exchange outflows, back to net exchange inflows. In the immediate term, this is something to keep an eye on to see if the trend softens, or strengthens as we head into the new year.

Live Chart

Next we will look into the very intriguing YTD changes occurring in futures markets. Total open interest in futures has almost doubled this year, rising by $9.57B (97%) to a total of $18.87B. This week alone has seen an increase of some $2.5B in open interest, primarily led by traders on Binance.

Whilst futures open interest is still some way off all-time-highs, rapid increases in leverage can indicate a clustering of stop-losses and liquidation levels in close proximity to the current price. This adds higher probabilities to a potential short, or long squeeze in the more immediate term.

Live Chart

Alongside an elevated possibility of a leverage squeeze, we also have a general decline in trading volume. Quieter trading activity is typical towards years end, however on a 7-day average basis, futures market volumes have seen a YTD decline of 16%. Thinner volume, and rising open interest (in a concentrated exchange) is a combination that can be favourable to at least a localised leverage squeeze over the coming weeks.

Live Chart

And finally, we look to the mining industry to close out our review. The mining market has experienced a truly unbelievable shake-up in 2021. An estimated 53% of the industry was banned from the once dominant Chinese jurisdiction in May, and forced to relocate almost overnight.

Hash-rate started 2021 at around 143 EH/s, and increased to what was then an ATH of 180 EH/s in mid-May. This was followed by a precipitous decline of 53%, as miners in China were forced to cease operations, and relocate, or redistribute their hardware to new jurisdictions. Incredibly, the mining market has completely recovered from this enormous shift, with hash-rate pushing to new ATHs at 182 EH/s, closing out the year 27% higher.

Live Chart

The success of this transition in the mining market is driven by the free-market incentive of miner revenue, offered by the Bitcoin protocol as a  reward for solving blocks. Some key statistics relating to the aggregate mining revenue (USD denominated, fees plus block subsidy):

  • $8.5M/day following the May-2020 halving.
  • $29.1M/day at the start of 2021, up 242% since the halving.
  • $46.0M/day at the time of writing, up 441% since the halving, and up 58% YTD.
Live Chart

All-in-all, 2021 has been a wild ride for Bitcoin investors, traders, HODLers, analysts, miners, and critics alike. The protocol saw Taproot implemented, miners relocate out of the historically dominant location, and multiple rolls of the FUD dice, landing on all sides at least twice. As is tradition, Bitcoin comes out of the year stronger and more resilient, ready to solve more blocks, and create more opportunities in 2022.

From the team at Glassnode, we wish you all a very Merry Christmas, and a happy holiday season with your friends and families. See you in 2022.


Product Updates

All product updates, improvements and manual updates to metrics and data are recorded in our changelog for your reference.


Disclaimer: This report does not provide any investment advice. All data is provided for information purposes only. No investment decision shall be based on the information provided here and you are solely responsible for your own investment decisions.