Over 75% of Bitcoin’s On–Chain Volume Doesn’t Change Hands
Using advanced entity–adjusted metrics we assess Bitcoin's true transfer volume and show that only up to 25% of BTC moved on–chain actually changes owners.

Assessing Bitcoin’s True Transfer Volume
Even though blockchain data is publicly accessible, it is a non–trivial challenge to make sense of it in a meaningful way.
On–chain data is without a doubt highly valuable — but in its raw form it’s just not good enough.
It contains a substantial amount of noise, and careful preprocessing and contextualisation is required in order to distil useful information from it.
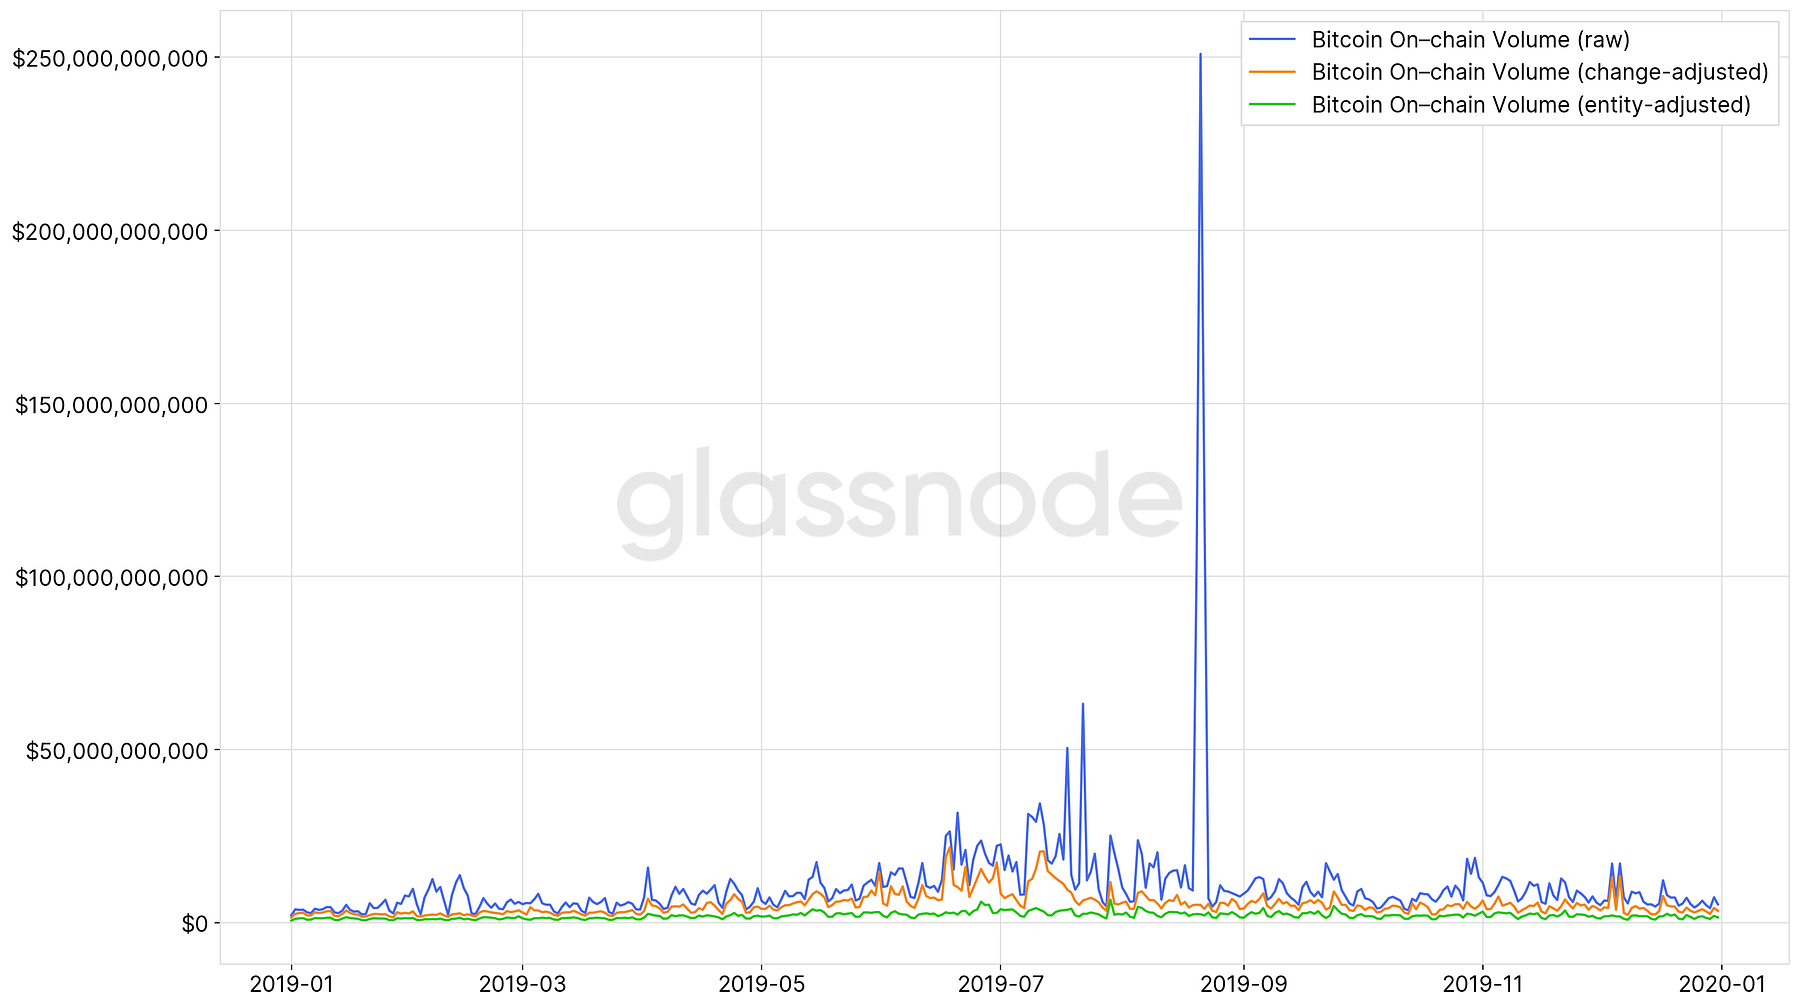
Consider on–chain transaction volume: Figure 1 shows Bitcoin’s raw daily on–chain transaction volume (USD value) for 2019.
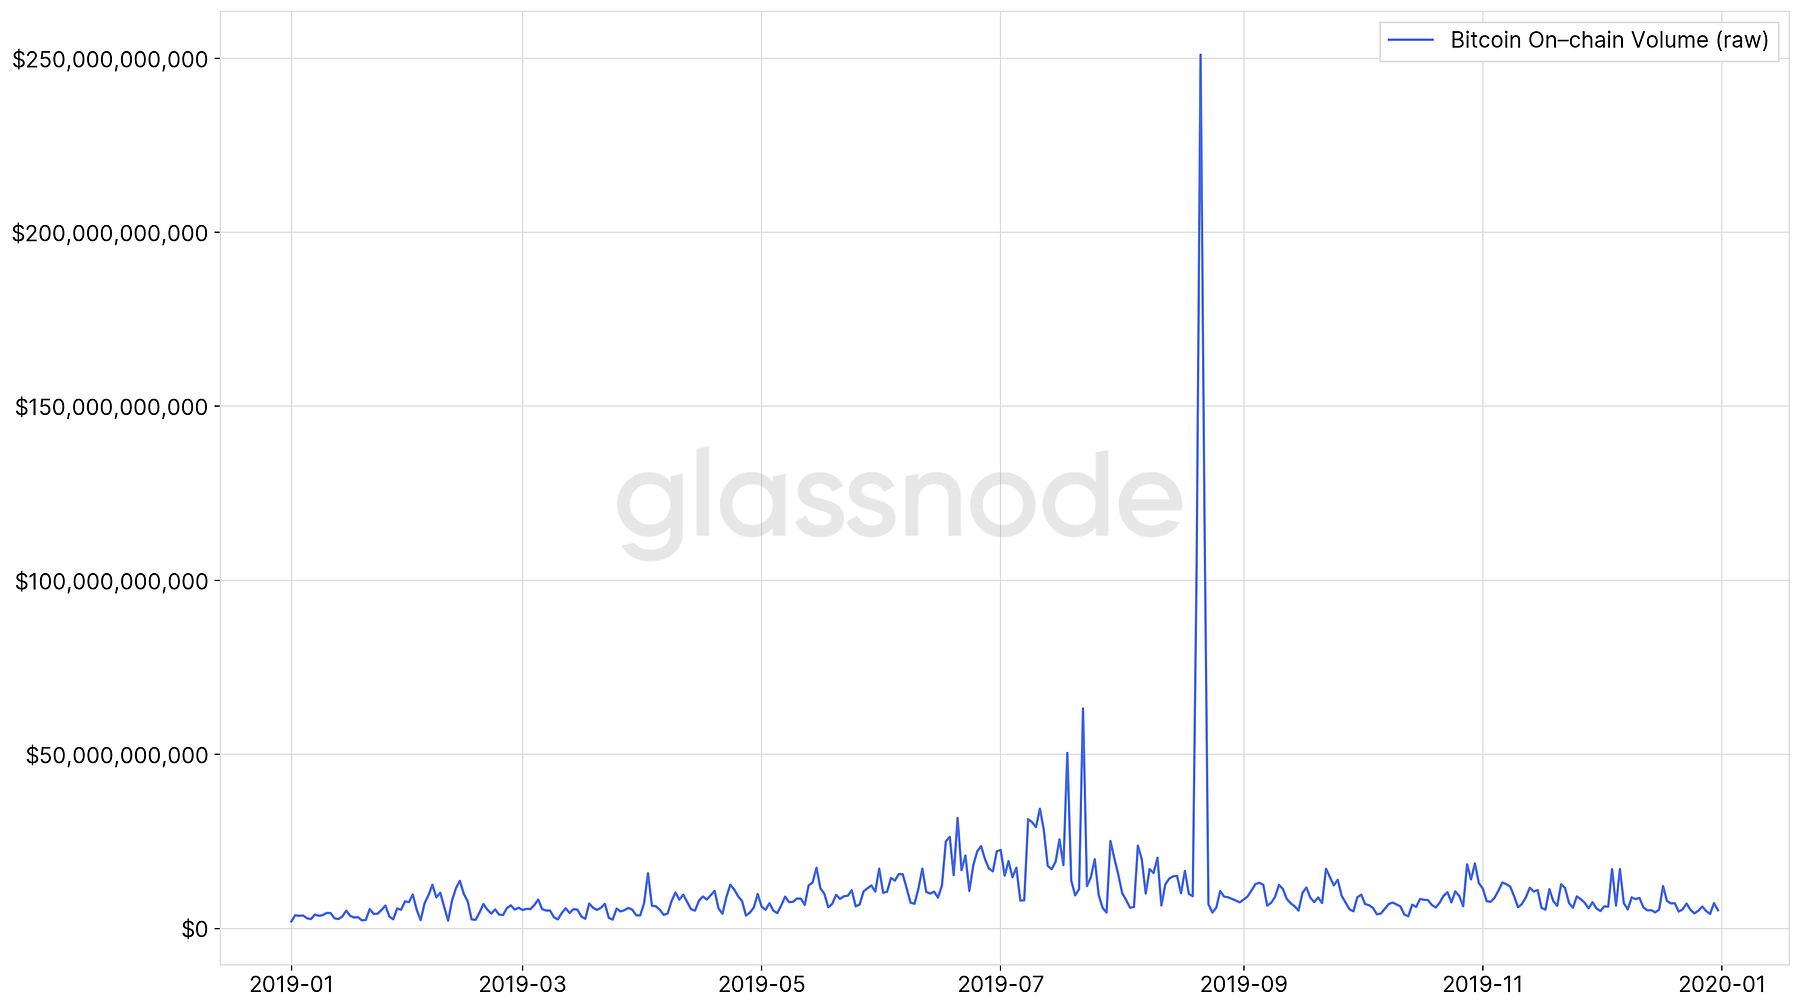
On August 21st an enormous spike occurred, leading to a recorded on–chain volume of over $250 billion USD in a single day.
Without context, this might seem like a significant event.
However, this volume was simply caused by Bitcoin “change”, associated to a crypto exchange creating new cold wallets and reshuffling their funds internally — no actual Bitcoins were transferred between different participants in the network.
Therefore, if we are interested in assessing the value of bitcoin that is actually being transferred across different holders, proper processing and sophisticated methods need to be applied to the raw blockchain data.
Change–Adjusted Volume
Adjusting for (obvious) change is a commonly applied heuristic to obtain a more accurate measure for on–chain volume.
This adjustment is applicable to transactions in which the sending address is present in both the inputs and the outputs of the transaction, i.e. a transaction output returns Satoshis back to an address of the sender (see Figure 2 for an example).
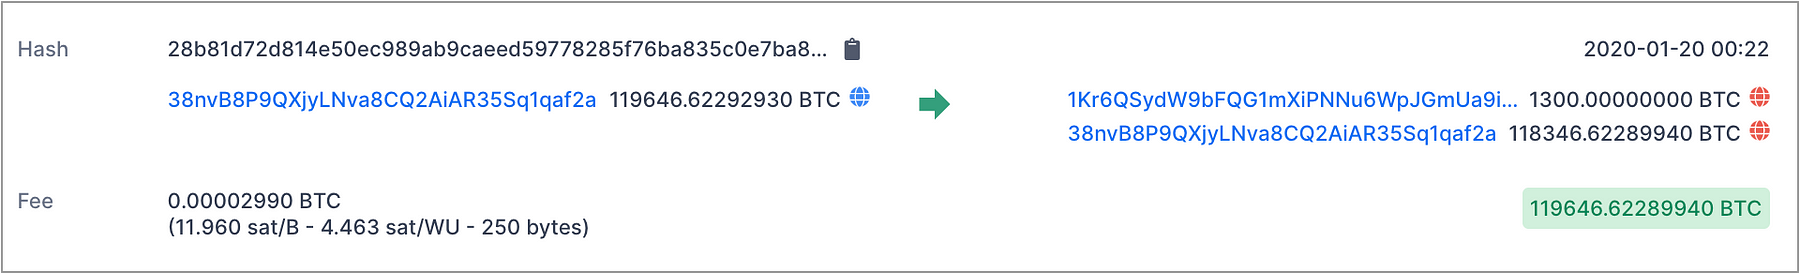
The change is considered “obvious” because the sender is re–using an existing sending address within the same transaction to receive the bitcoin change in return.
Figure 3 shows the daily change–adjusted on–chain volume for 2019.
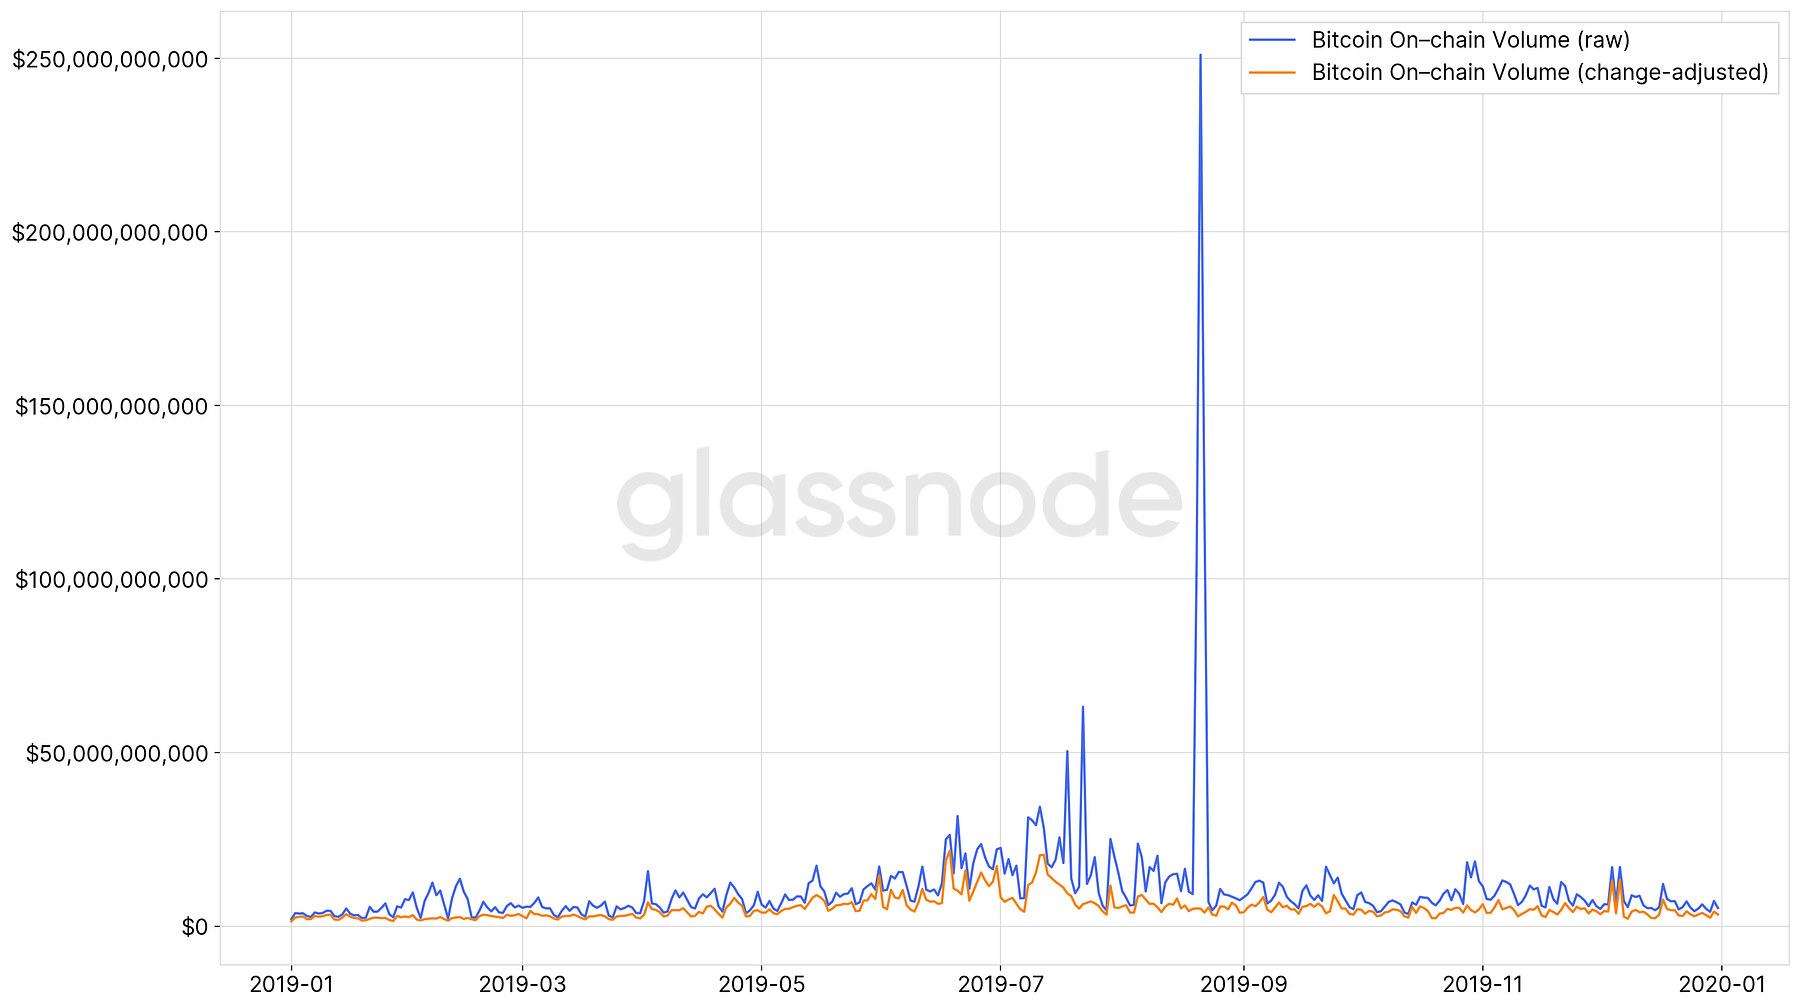
Note how the volume spike vanishes, and in addition change–adjusted volume is consistently lower compared to the raw volume.
In fact, within the denoted time period above, the daily change–adjusted volume is, on average, 43% lower.
A live chart comparing raw and change–adjusted Bitcoin volume can be found on Glassnode Studio here.
Beyond Change: Adjusting by Entities
The problem with the above heuristic is that it doesn’t go far enough. There are other cases in which on–chain bitcoin volume does not represent actual transfer of Bitcoin between different holders.
For one, a single user can send bitcoin between different addresses that he/she controls. Furthermore, many wallets nowadays send change back to the spender using newly created addresses instead of re–using an existing one.
At Glassnode we use more advanced techniques and heuristics in order to estimate an upper bound for the “true” on–chain volume of Bitcoin — volume that actually changes hands.
To do so, we employ what we coin entity–adjustment and refine this methodology by accounting for so–called relay addresses as well.
Entity–Adjustment
In our previous article we introduced the concept of “entities” in the Bitcoin network: Clusters of addresses that are controlled by the same entity.
Entity–adjustment therefore makes use of this knowledge and discards volume moved between addresses that belong to the same entity cluster (“in–house volume”). This is volume that does not represent value transferred between distinct users in the network. Because one address belongs to a single entity, this adjustment entails, by definition, the aforementioned change–adjustment as well. (Note: We ignore multisig addresses in this analysis).
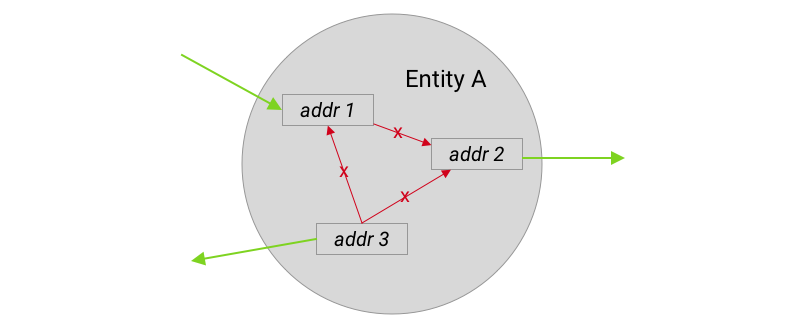
Consider the example transaction in Figure 2 above: While it contains obvious change, our algorithms actually detect that all input and output addresses are controlled by the same entity — therefore the whole transaction does not contribute to the true BTC transfer volume at all.
Moreover, this implies that this transaction is discarded in the computation of entity–adjusted transaction counts, since it is a transaction that only transfers BTC internally.
Relay–Adjustment
In addition to adjusting for entities, we take into account so–called “relay addresses” as well. Relay addresses are addresses whose sole purpose is to forward (relay) funds to a subsequent address. Hence, the volume of relay addresses is usually double–counted: once moving into and once moving out of the relay address.
Through the identification of addresses with this behaviour, we are able to remove this added of noise in volume aggregates. To do so, we discard all outputs that are spent by relay addresses.

Technically, we define relay addresses as addresses whose mean spent output lifespan is less than 1 hour, and whose current balance is zero (excluding UTXOs which were created within the last hour).
Figures 6–8 show the difference between between our entity–adjusted volume (incl. relay–adjustment), change–adjusted volume, and raw volume for the the years 2016, 2017–2018, and 2019, respectively.
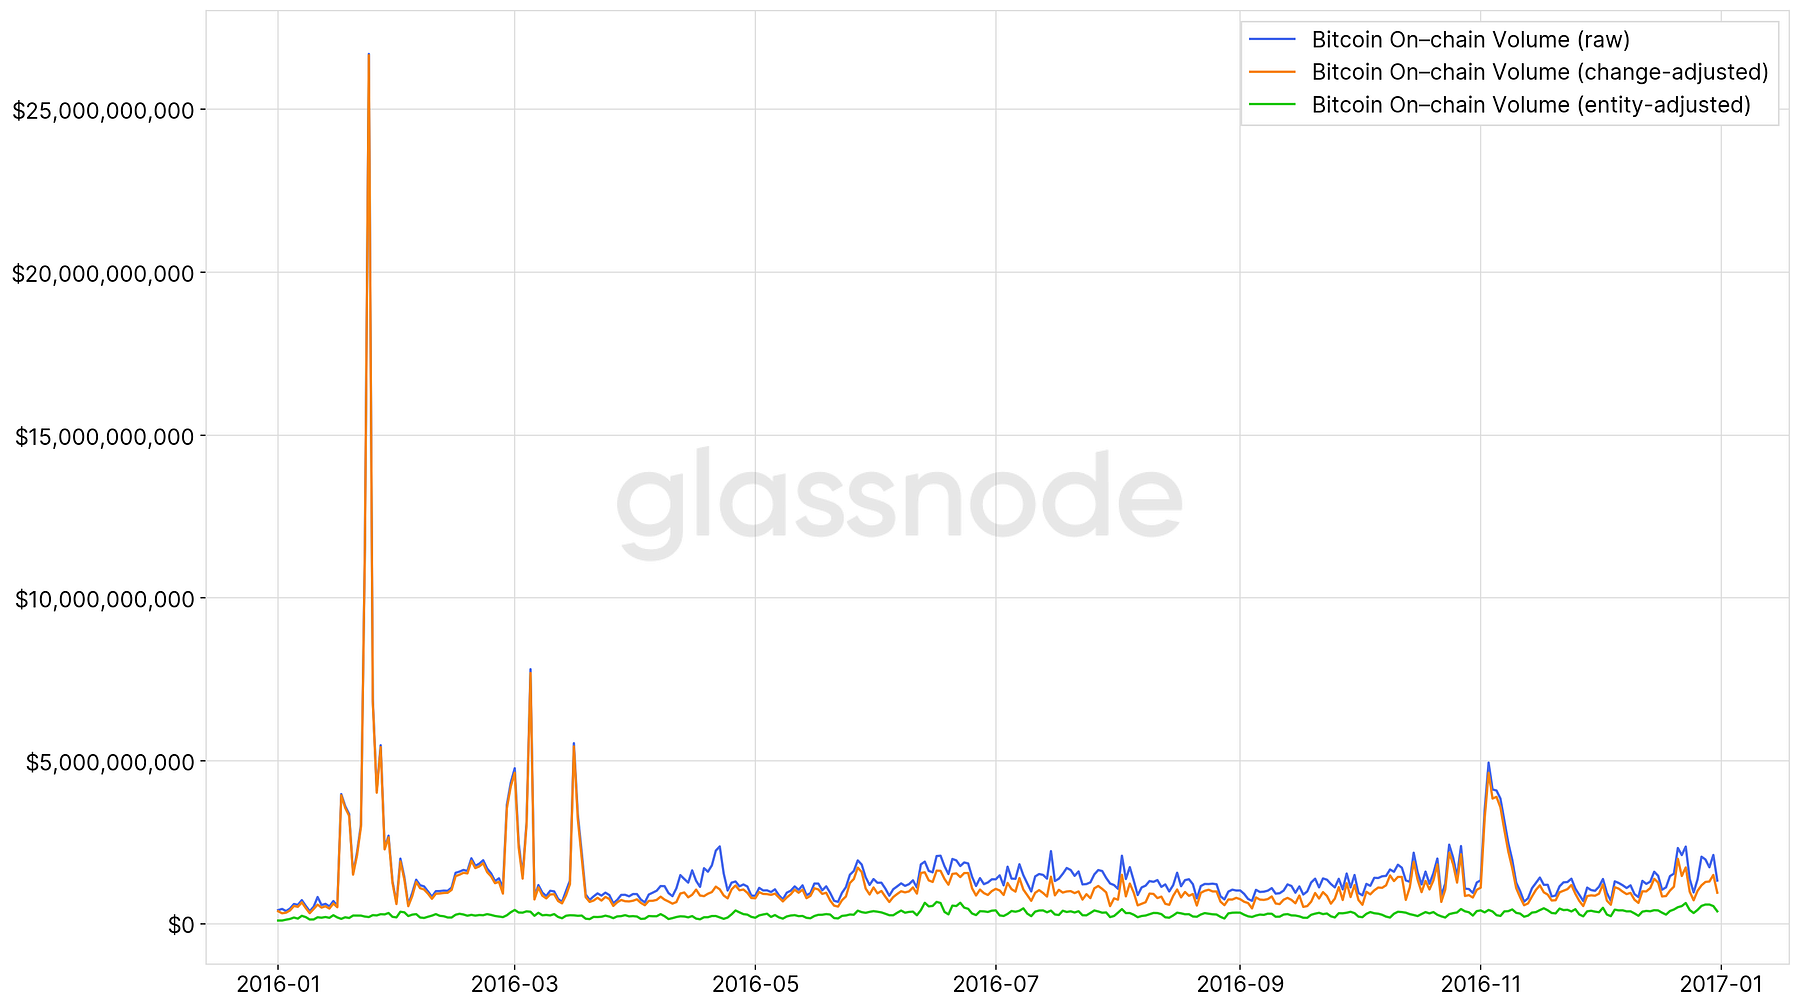
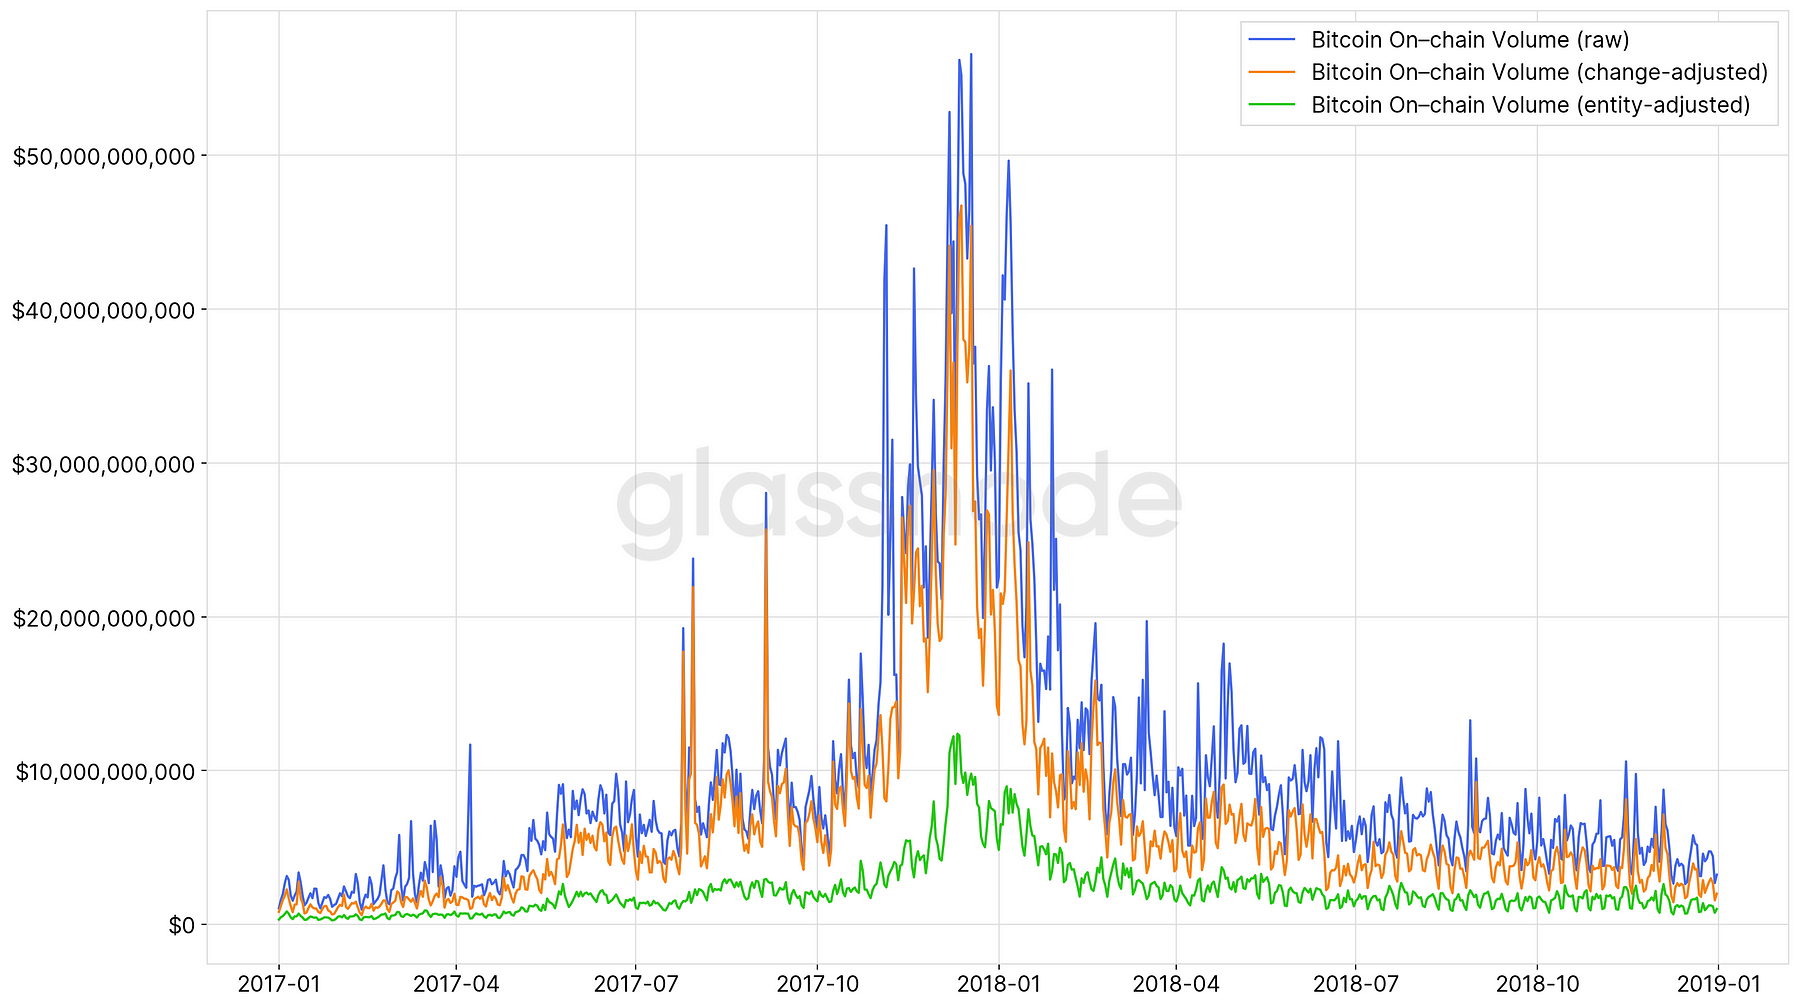
The results speak for themselves, and the differences are compelling.
The 2016 data illustrates the removal of significant volume spikes that are not accounted for by change–adjusted volume only. Similarly, volume during the bull market in 2017 shows substantial discrepancies (5x) between entity–adjusted and raw/change–adjusted Bitcoin volume.
Over the period from 2016–2019 the daily on–chain transaction volume using our entity–adjusted methodology has been
- 75.5% lower than the raw volume and
- 63% lower than change–adjusted volume.
This means that less than 25% of Bitcoin volume that is recorded on–chain represents actual value transfers between network participants.
Our entity–adjusted metrics show that the true Bitcoin on–chain volume is on average only 25% of the raw volume recorded on the blockchain.
For a complete picture, Figure 9 shows the ratio between raw volume and entity–adjusted (as well as change–adjusted) over time. The entity–adjusted ratio has been relatively stable fluctuating around 0.25 since 2016.
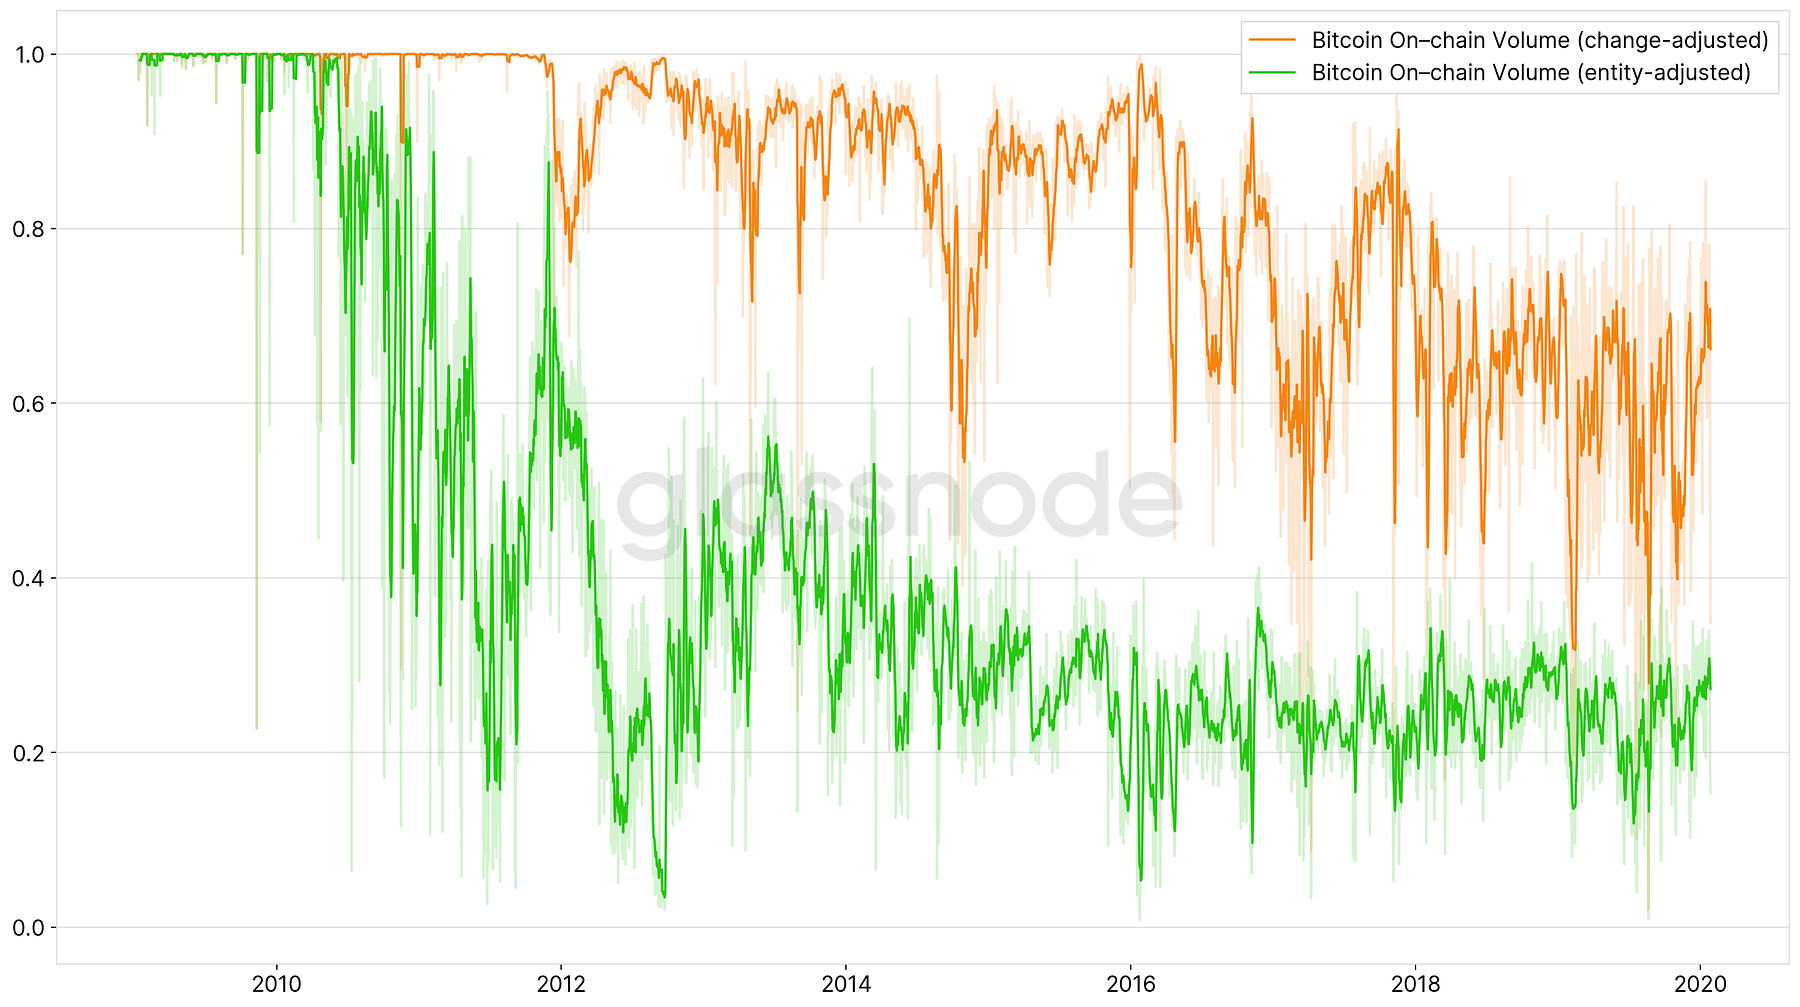
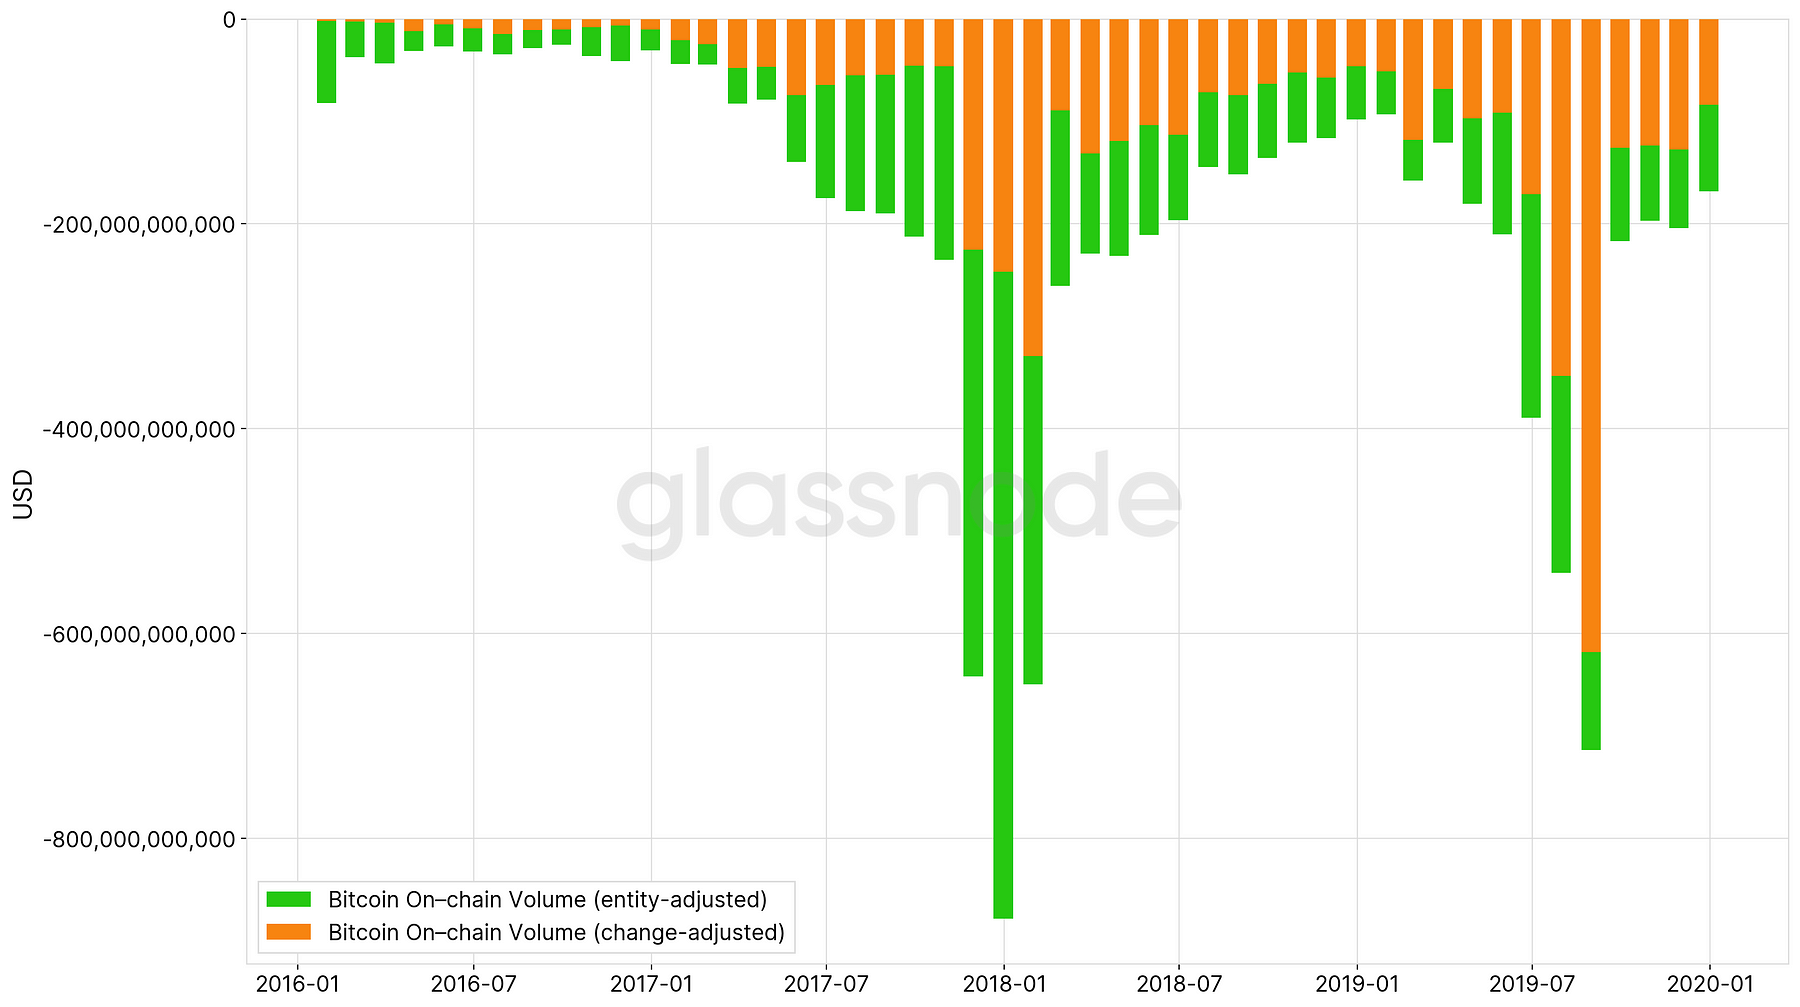
Figure 10 depicts the monthly difference between raw and entity–adjusted (as well as change–adjusted) volume in USD. It shows that on a monthly basis our entity–adjusted volume is up to a compelling $875 billion and $629 billion lower compared to the raw volume and the change–adjusted volume, respectively.
Conclusion
The data and analyses presented here are in no way intended to lessen Bitcoin’s value proposition and should not be interpreted as such.
The purpose of this work is merely to signify that advanced methods are required to meaningfully make sense of on–chain data. In order to accurately understand the underlying state of the Bitcoin network and its events it is essential to contextualise and scrutinize this data properly.
Note the in the present work we exclusively refer to bitcoin moved on the blockchain. We don’t account for BTC that is bought or sold on exchanges. Technically, on a network level, those bitcoin are still controlled by the same entity — the exchange itself.
In Bitcoin’s economy the implications of moving funds within the same entity, and actually transferring ownership of bitcoin (and therefore value) across network participants, are very different — they represent very different things in terms of economic activity.
Any investor, trader, and researcher aiming to properly understand value and wealth transfers in Bitcoin’s economy should be undoubtedly making use of these fundamental differences drawn from on–chain volume.
All metrics presented in this work are live on Glassnode Studio as of today:
- Entity–adjusted Volume (Total)
- Entity–adjusted Volume (Mean)
- Entity–adjusted Volume (Median)
- Entity–adjusted Transaction Count
For change–adjusted volume visit:

- Follow us and reach out on Twitter
- For on–chain metrics and activity graphs, visit Glassnode Studio
- For automated alerts on core on–chain metrics and activity on exchanges, visit our Glassnode Alerts Twitter
Disclaimer: This report does not provide any investment advice. All data is provided for information purposes only. No investment decision shall be based on the information provided here and you are solely responsible for your own investment decisions.