Post-ATH Distribution
Bitcoin continues to face persistent sell pressure, especially from recent buyers. The asset has seen weak demand and fading accumulation since January. Short-term holders are capitulating, driving STH-SOPR into loss territory, mirroring the August 2024 crash to $49k.


Executive Summary
- Bitcoin entered a phase of strong investor distribution in early January, with the Accumulation Trend Score confirming persistent sell-side pressure.
- Heightened volatility, weak demand, and liquidity constraints have prevented meaningful accumulation from restarting, reinforcing downside risks.
- Panic-driven selling has intensified, with STH-SOPR spiking well below the break-even level of 1, signalling fear and loss realization among recent buyers.
- A custom SOPR-adjusted CDD metric we developed shows that the intensity of the sell-off mirrors past capitulation events, notably the one in August 2024, as the market plunged to $49k.
Post-Euphoria Distribution
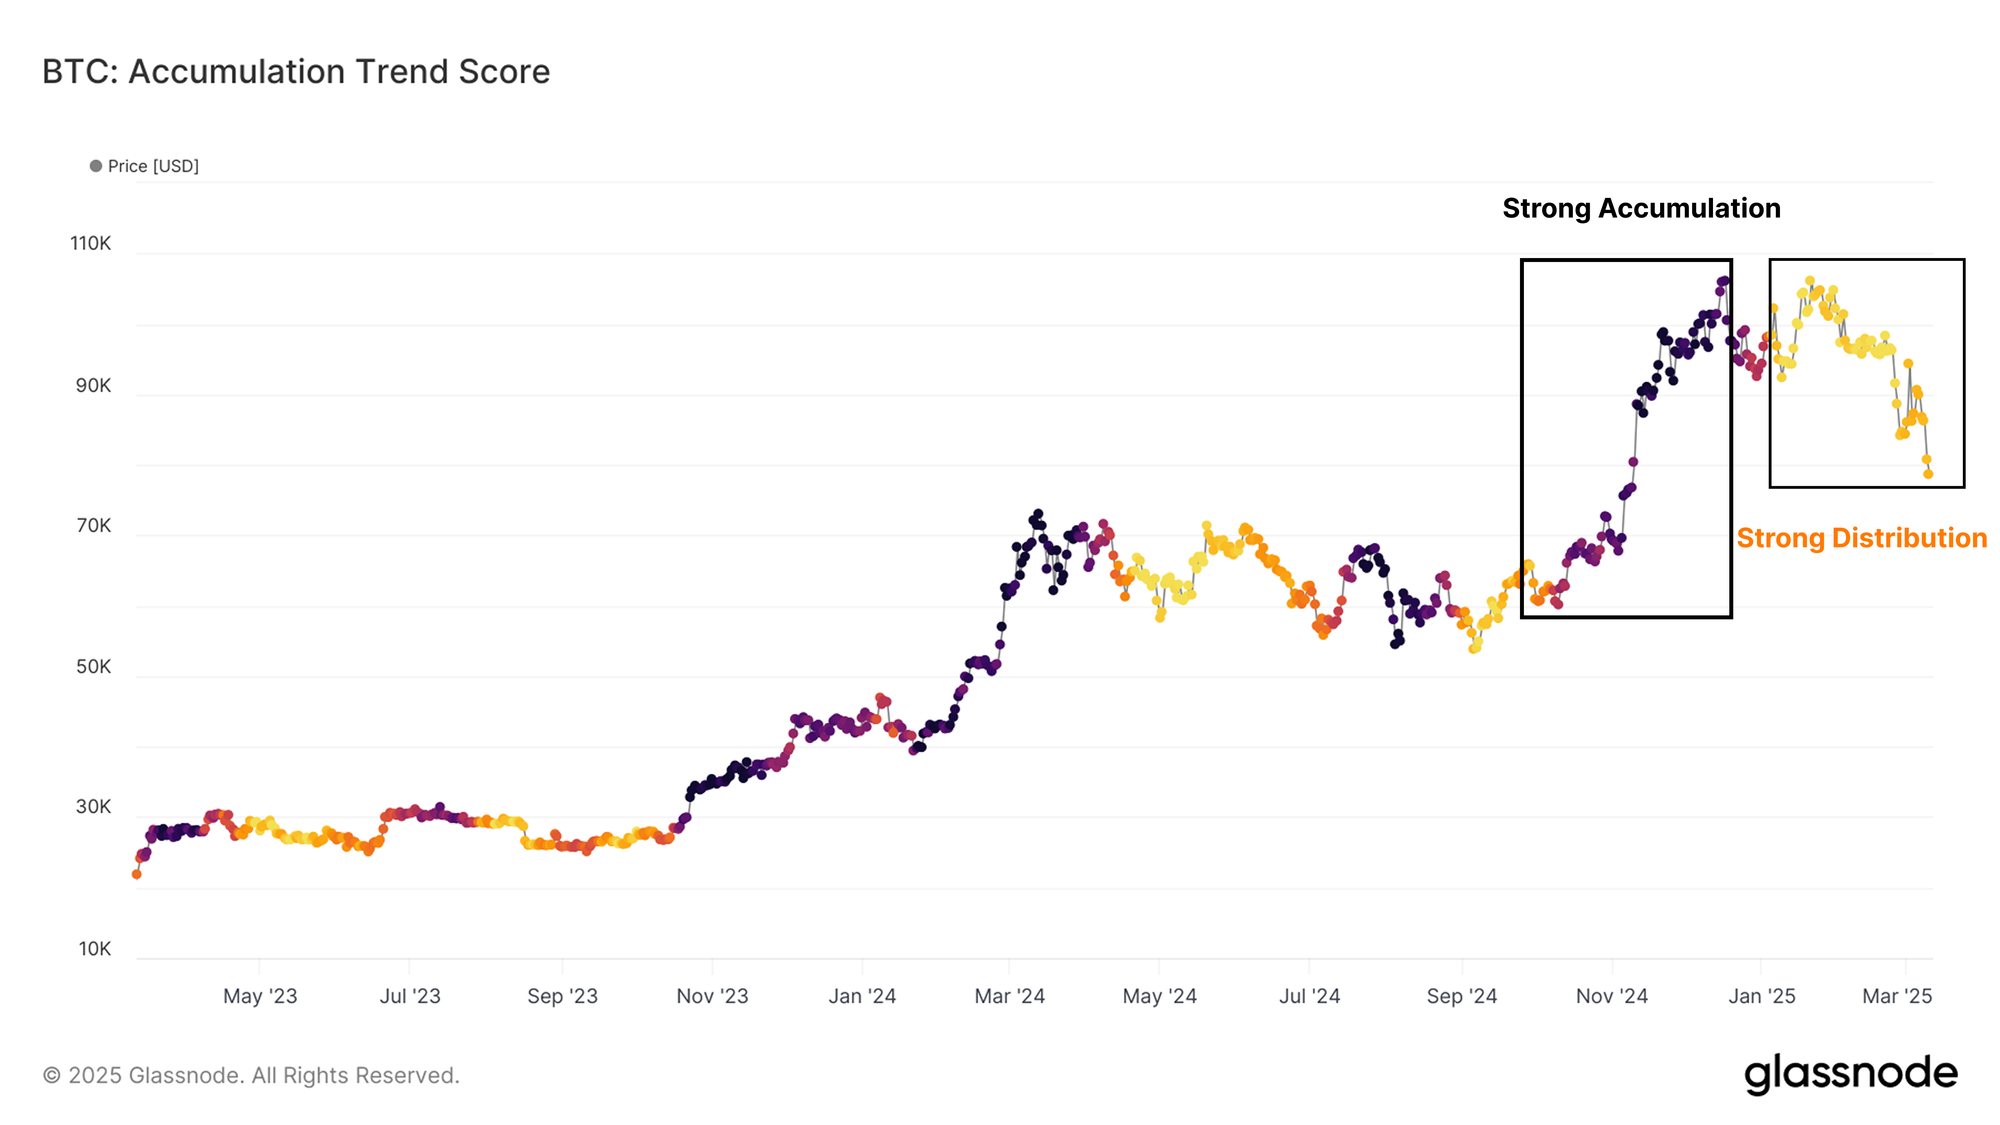
Bitcoin's cyclical behaviour is a product of both accumulation and distribution phases, with capital rotating between investor cohorts over time. The Accumulation Trend Score tracks these shifts, where values near 1 (dark purple) indicate substantial accumulation and near 0 (yellow) signal distribution.
The chart below shows how several accumulation cycles have been followed by distribution phases, which historically lead to weaker price action. The latest distribution phase commenced in January 2025, aligning with Bitcoin’s sharp correction from $108k to $93k.
The Accumulation Trend Score currently remains below 0.1, signalling persistent sell-side pressure is underway.
The Accumulation Trend Score measures the relative change in aggregate onchain balances. However, it is generally skewed by the behaviour of larger entities and does not reveal where Bitcoin was acquired. While it highlights overall accumulation or distribution trends, it lacks the granularity to pinpoint key cost-basis levels.
To gain deeper insights, we can turn to the Cost Basis Distribution (CBD) Heatmap, which visualizes where supply concentration has formed across different price ranges, helping us identify areas of potential support or resistance.
Market participants actively accumulated BTC during pullbacks between mid-December and late February, particularly in the $95k–$98k price range. This buy-the-dip behaviour suggests that investors still firmly believed in the bull trend, interpreting pullbacks as temporary pauses before further upside.
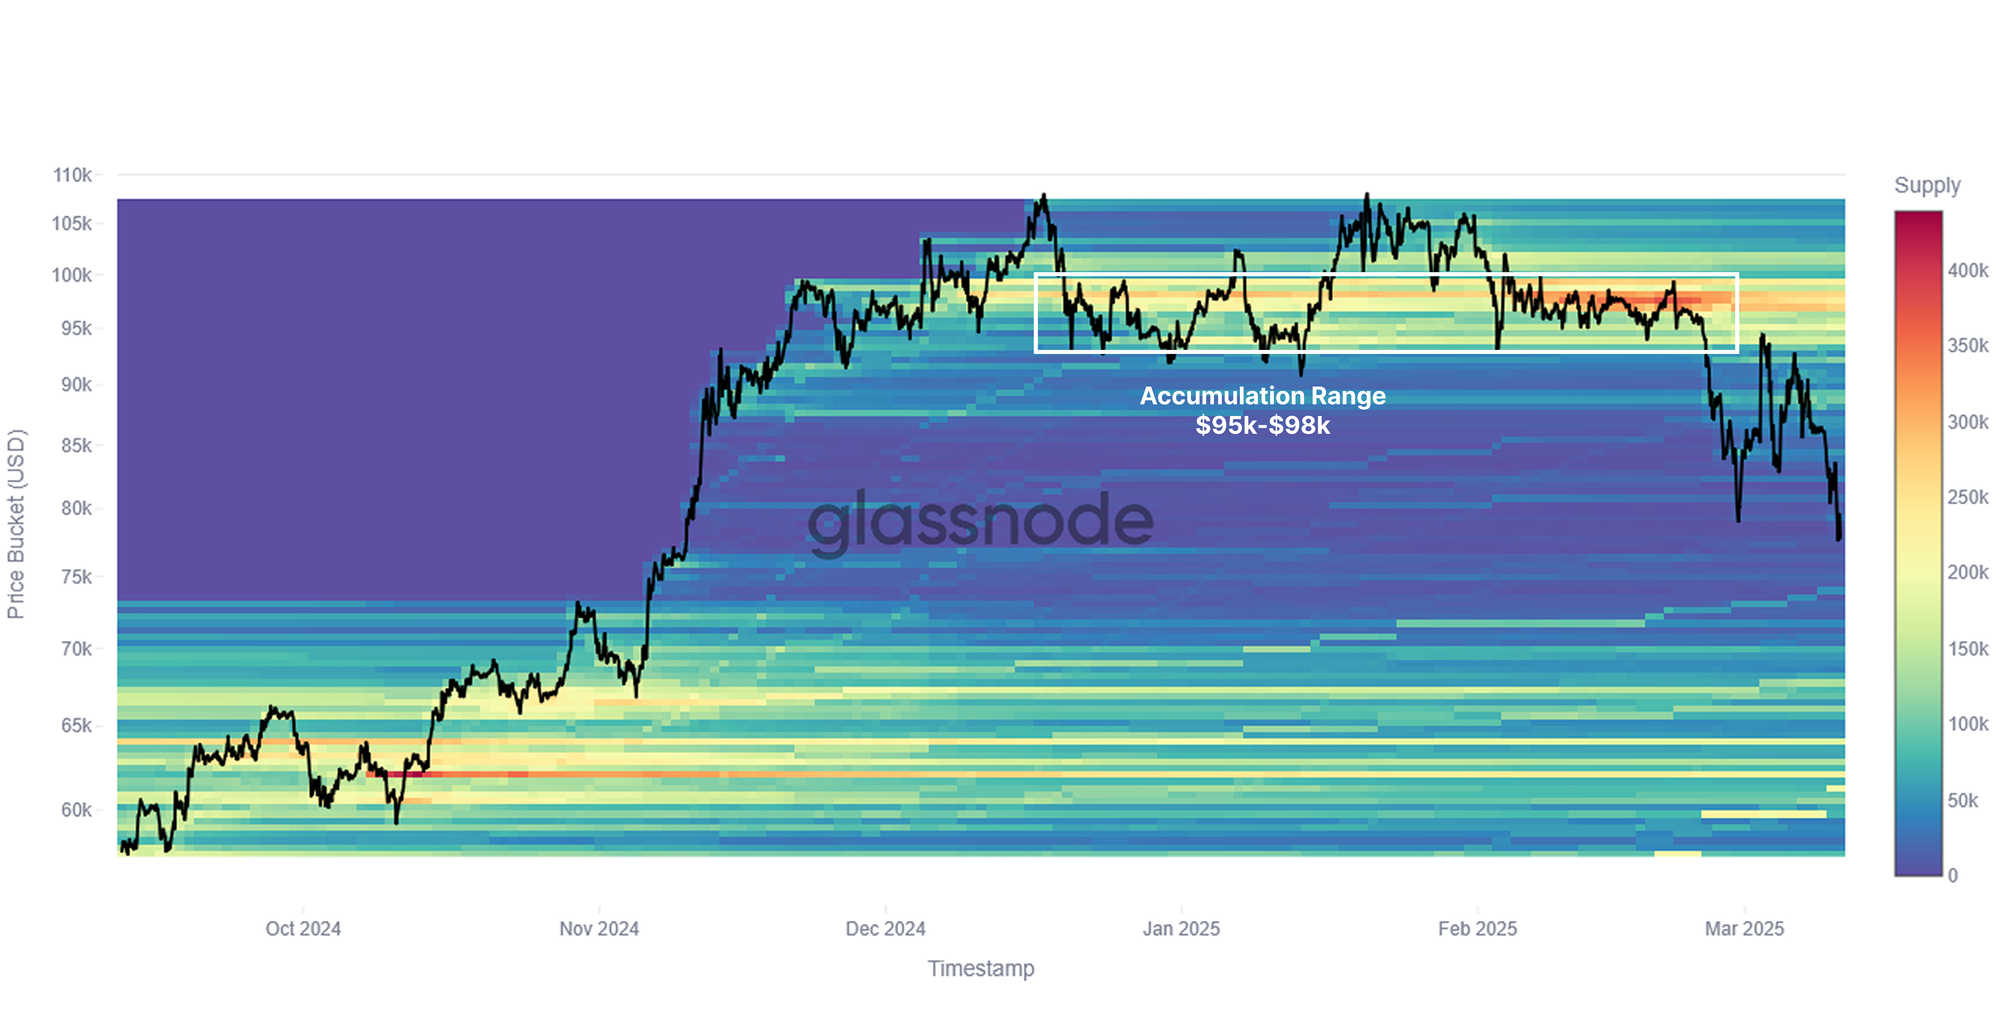
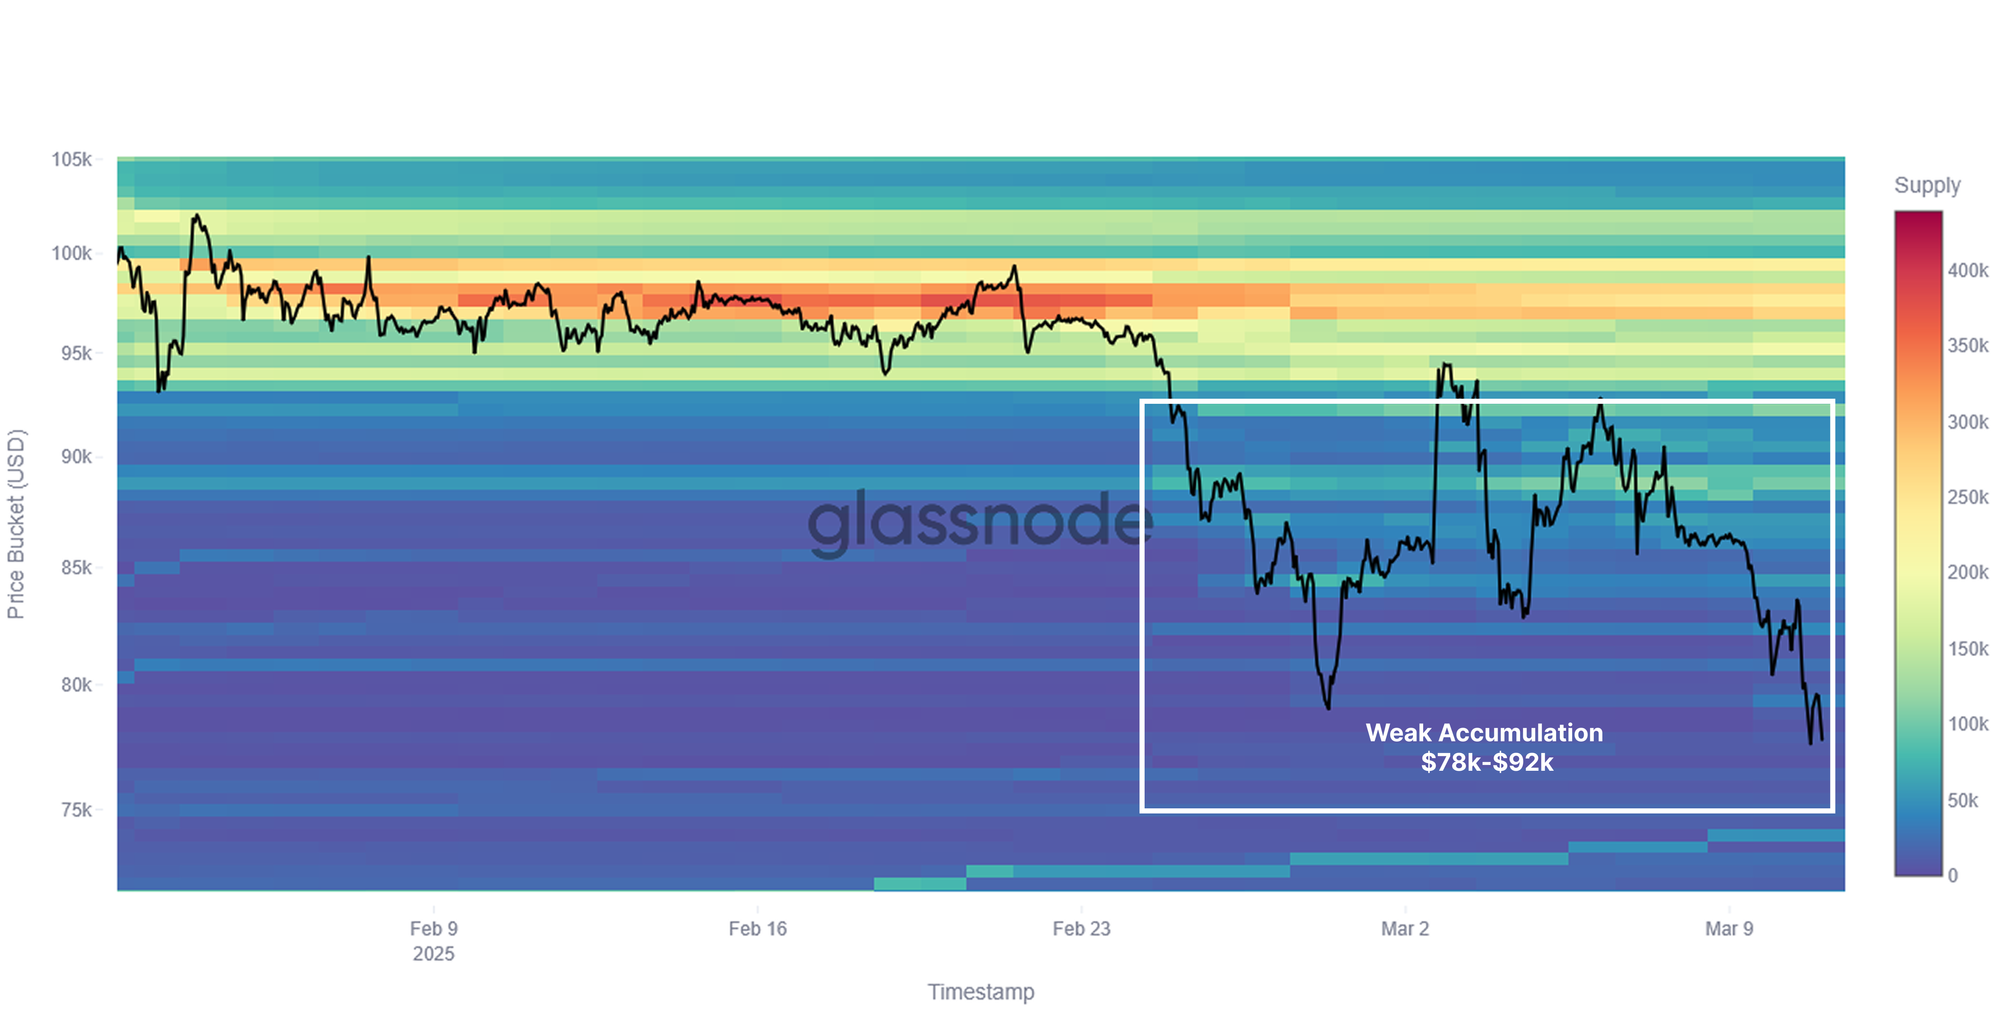
From late February onwards, as liquidity conditions tightened, confidence in accumulation started to deteriorate. External risk factors, including the Bybit hack and escalating U.S. tariff tensions, amplified market uncertainty and Bitcoin’s price trading below $92k. This level is crucial as it reflected the market breaking below the Short-Term Holder cost basis.
Unlike the earlier phase, there was no significant dip-buying response this time, indicating that sentiment had shifted toward risk aversion and capital preservation rather than continued accumulation.
The CBD heatmap confirms that as macro uncertainty increased, accumulation demand weakened, reinforcing that investor confidence is a critical driver of accumulation behaviour. The lack of dip-buying at lower levels suggests that capital rotation is underway, potentially leading to a more prolonged consolidation or corrective phase before the market finds a firm support base.
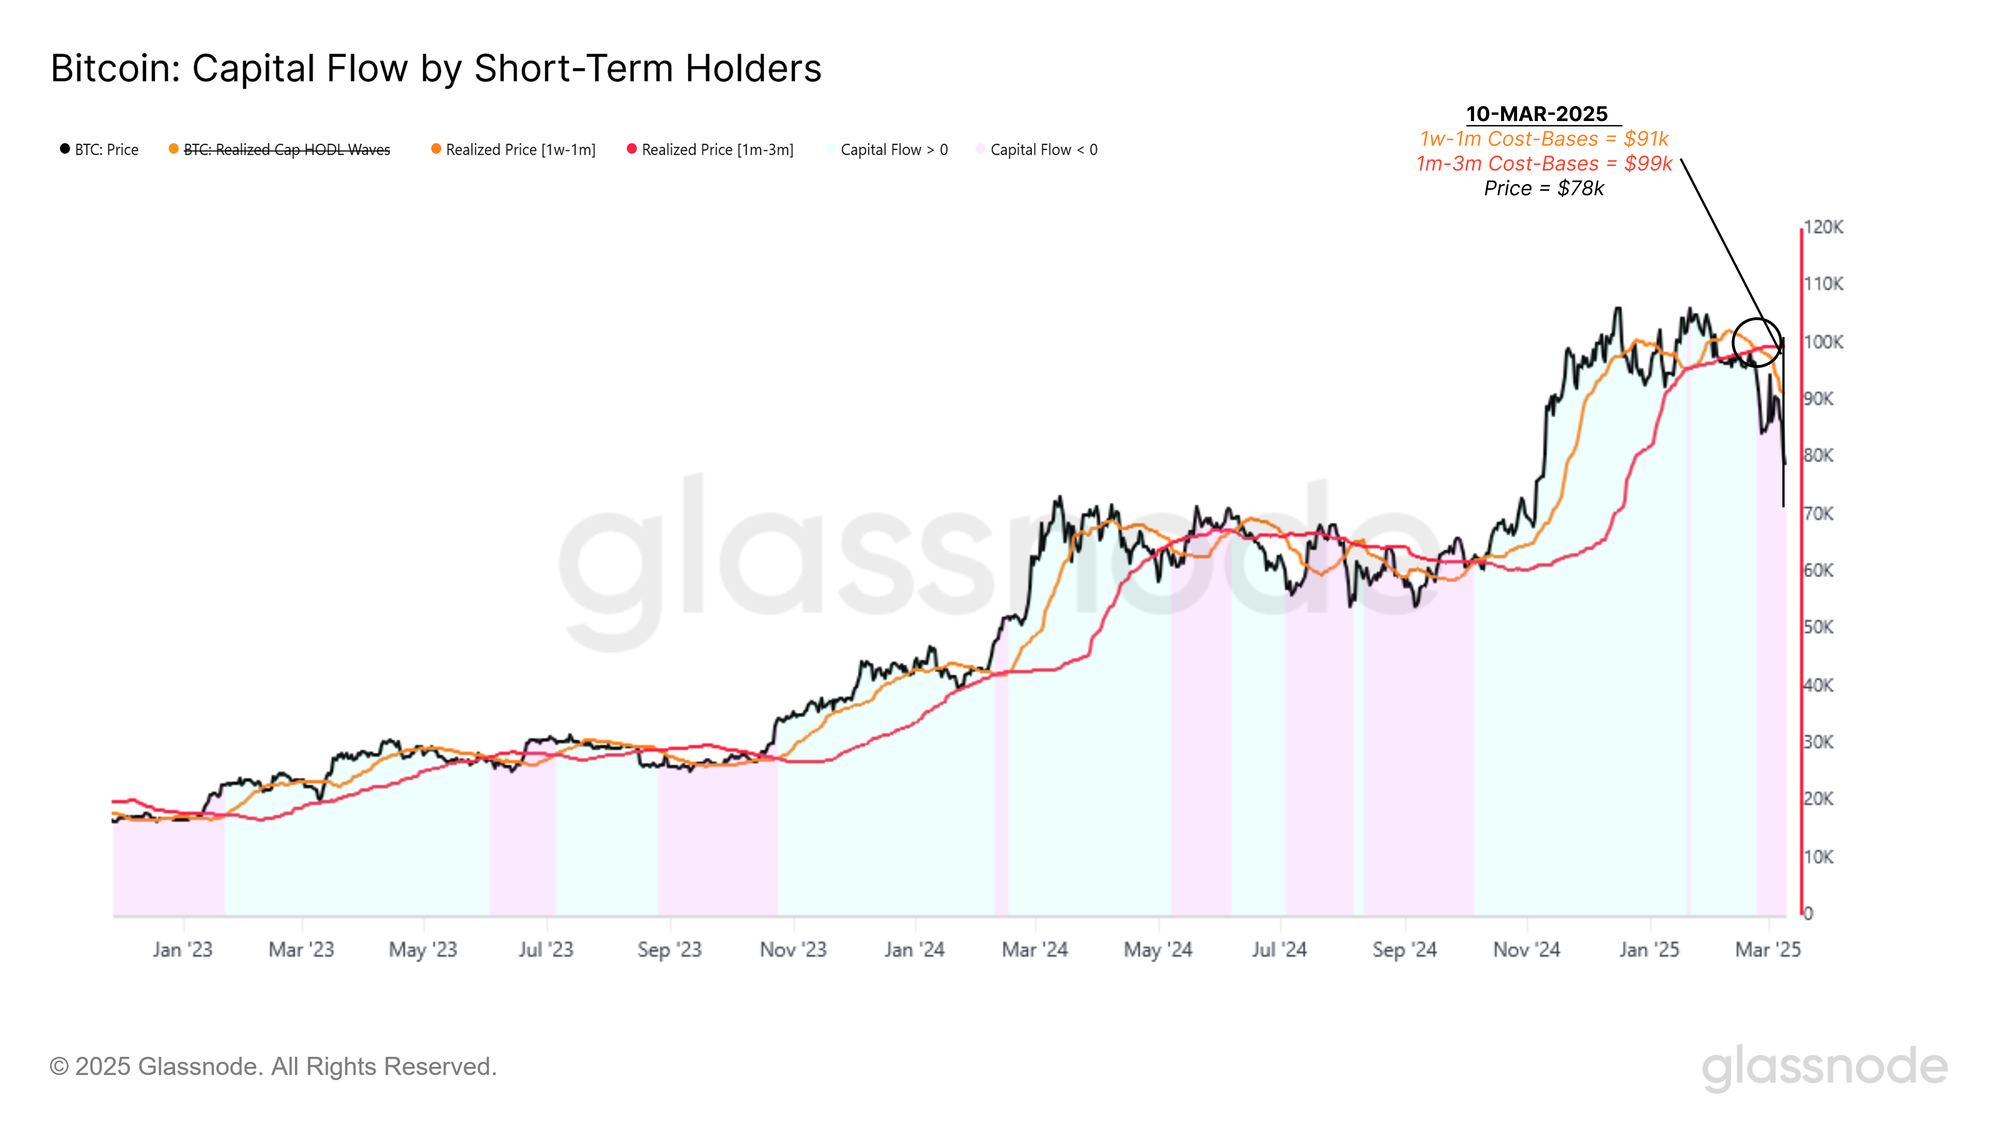
Declining Demand Momentum
We have now used the CBD Heatmap and Accumulation Trend Score to highlight a lack of substantial accumulation since late February. We can diver deeper into this behaviour by analyzing the cost basis of two short-term holders (STH) sub-cohorts:
- 1w–1m holders – Investors who acquired BTC in the past 7 to 30 days.
- 1m–3m holders – Investors who acquired BTC between 1 and 3 months ago.
During periods of strong capital inflow, the cost basis of the 1w–1m cohort typically rises above that of the 1m–3m cohort. This signals that newer investors are buying BTC at a relative premium, reflecting bullish sentiment and positive momentum. However, in Q1 2025, this trend started to flatten out, marking an early sign of weakening demand in the immediate term.
With Bitcoin prices dropping below $95k, this model also confirmed a transition into net capital outflows, as the 1w–1m cost basis fell below the 1m–3m cost basis. This reversal indicates that macro uncertainty has spooked demand, reducing new inflows and arguably increasing the probability of further sell pressure and a prolonged correction.
This transition suggests that new buyers are now hesitant to absorb sell-side pressure, reinforcing the shift from post-ATH euphoria into a more cautious market environment.
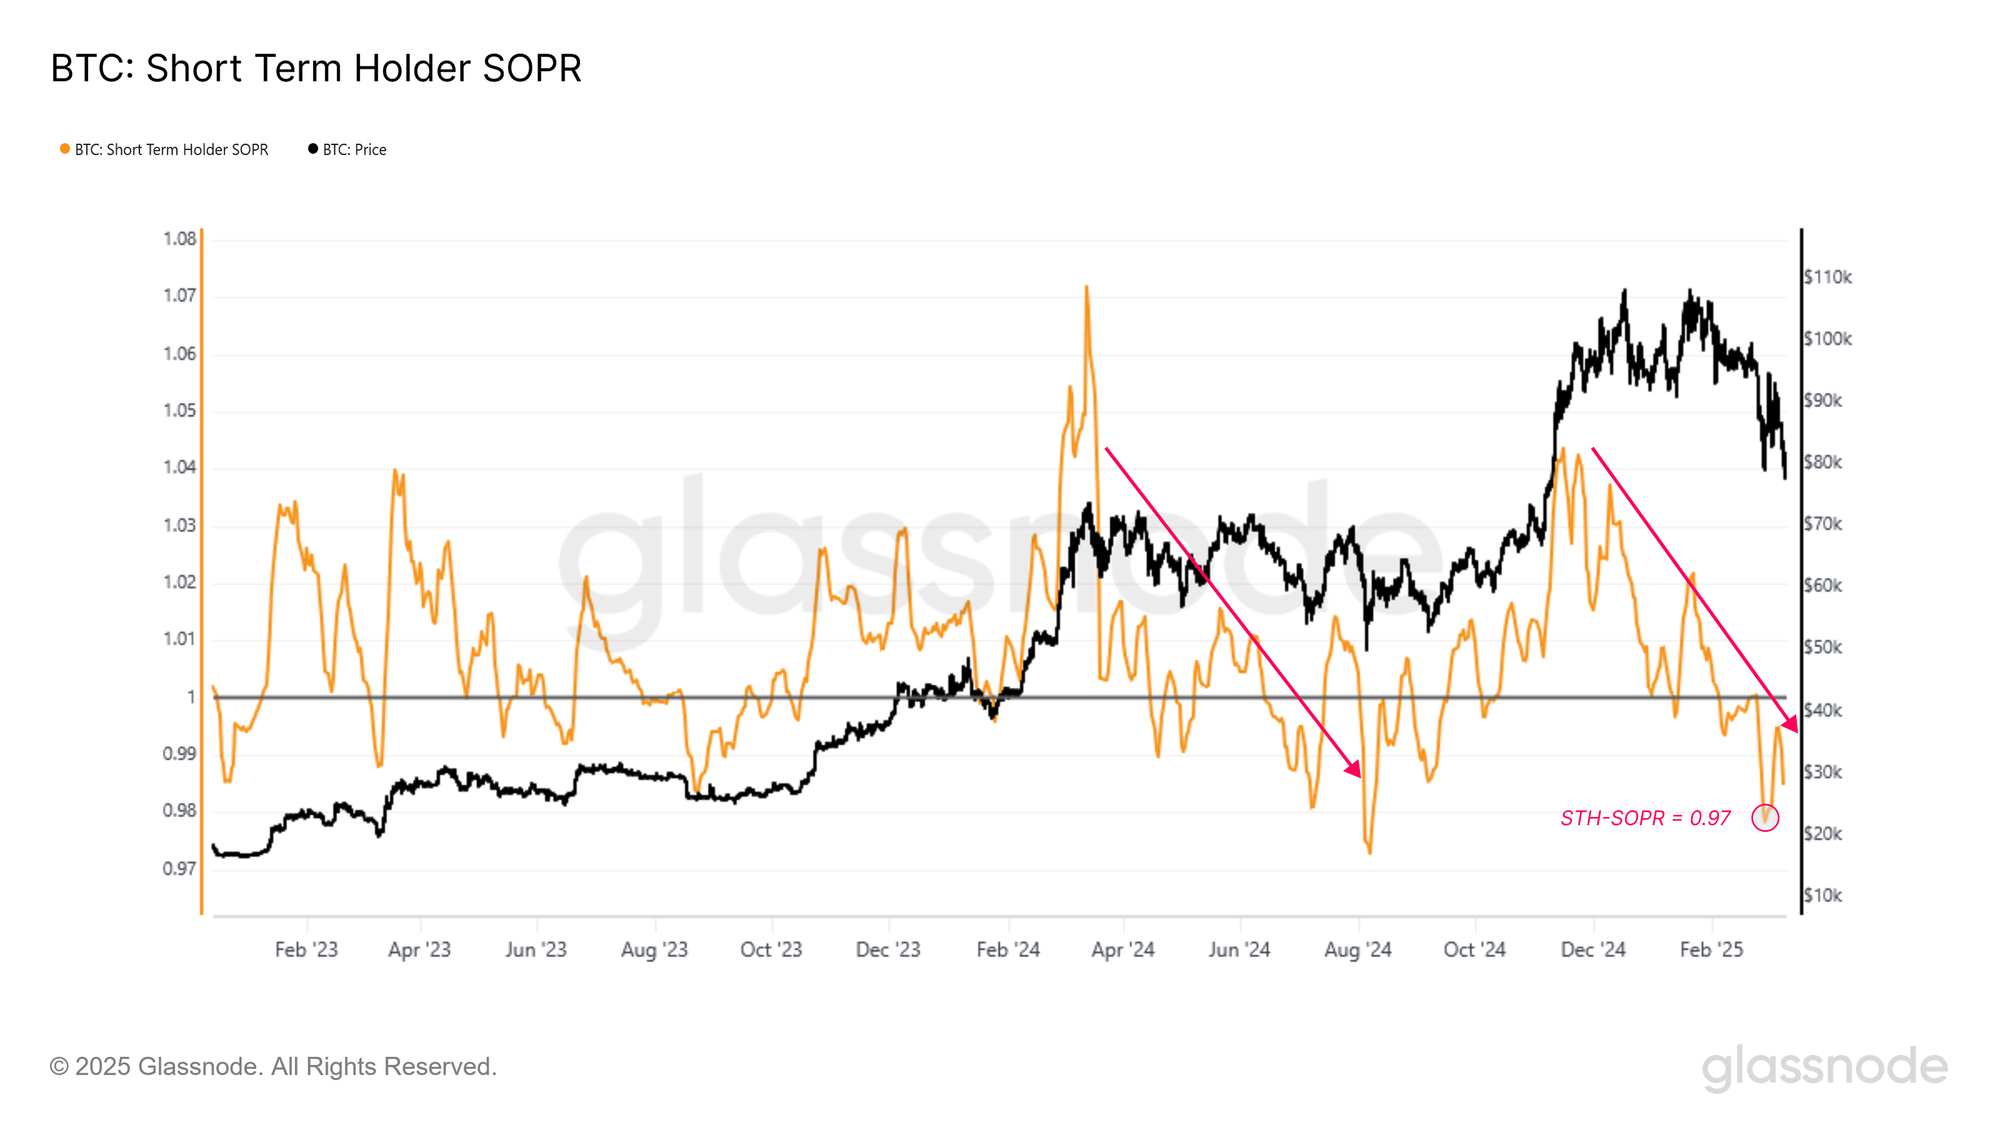
Sizing Up Fear
With the market undergoing a post-ATH distribution phase, it becomes crucial to gauge the extent of fear amongst the Short-term Holder cohort, especially those who entered most recently. Understanding this cohort’s behaviour helps market observers identify moments of extreme seller exhaustion, which have historically presented opportunities for longer-term investors.
A key metric for this analysis is the Short-Term Holder Spent Output Profit Ratio (STH-SOPR), which measures whether STHs are spending in profit (SOPR > 1) or at a loss (SOPR < 1).
Since prices dropped below $95k, the 196-hour moving average of STH-SOPR has remained below 1, suggesting that most short-term investors are realizing losses. In extreme moments, STH-SOPR dropped to 0.97 as the price crashed to $78K, underscoring the severity of capitulation.
This persistent downside momentum has left new investors on edge, leading to widespread panic selling at a loss. Such conditions often precede local seller exhaustion, a dynamic that long-term investors may monitor for potential re-entry opportunities.
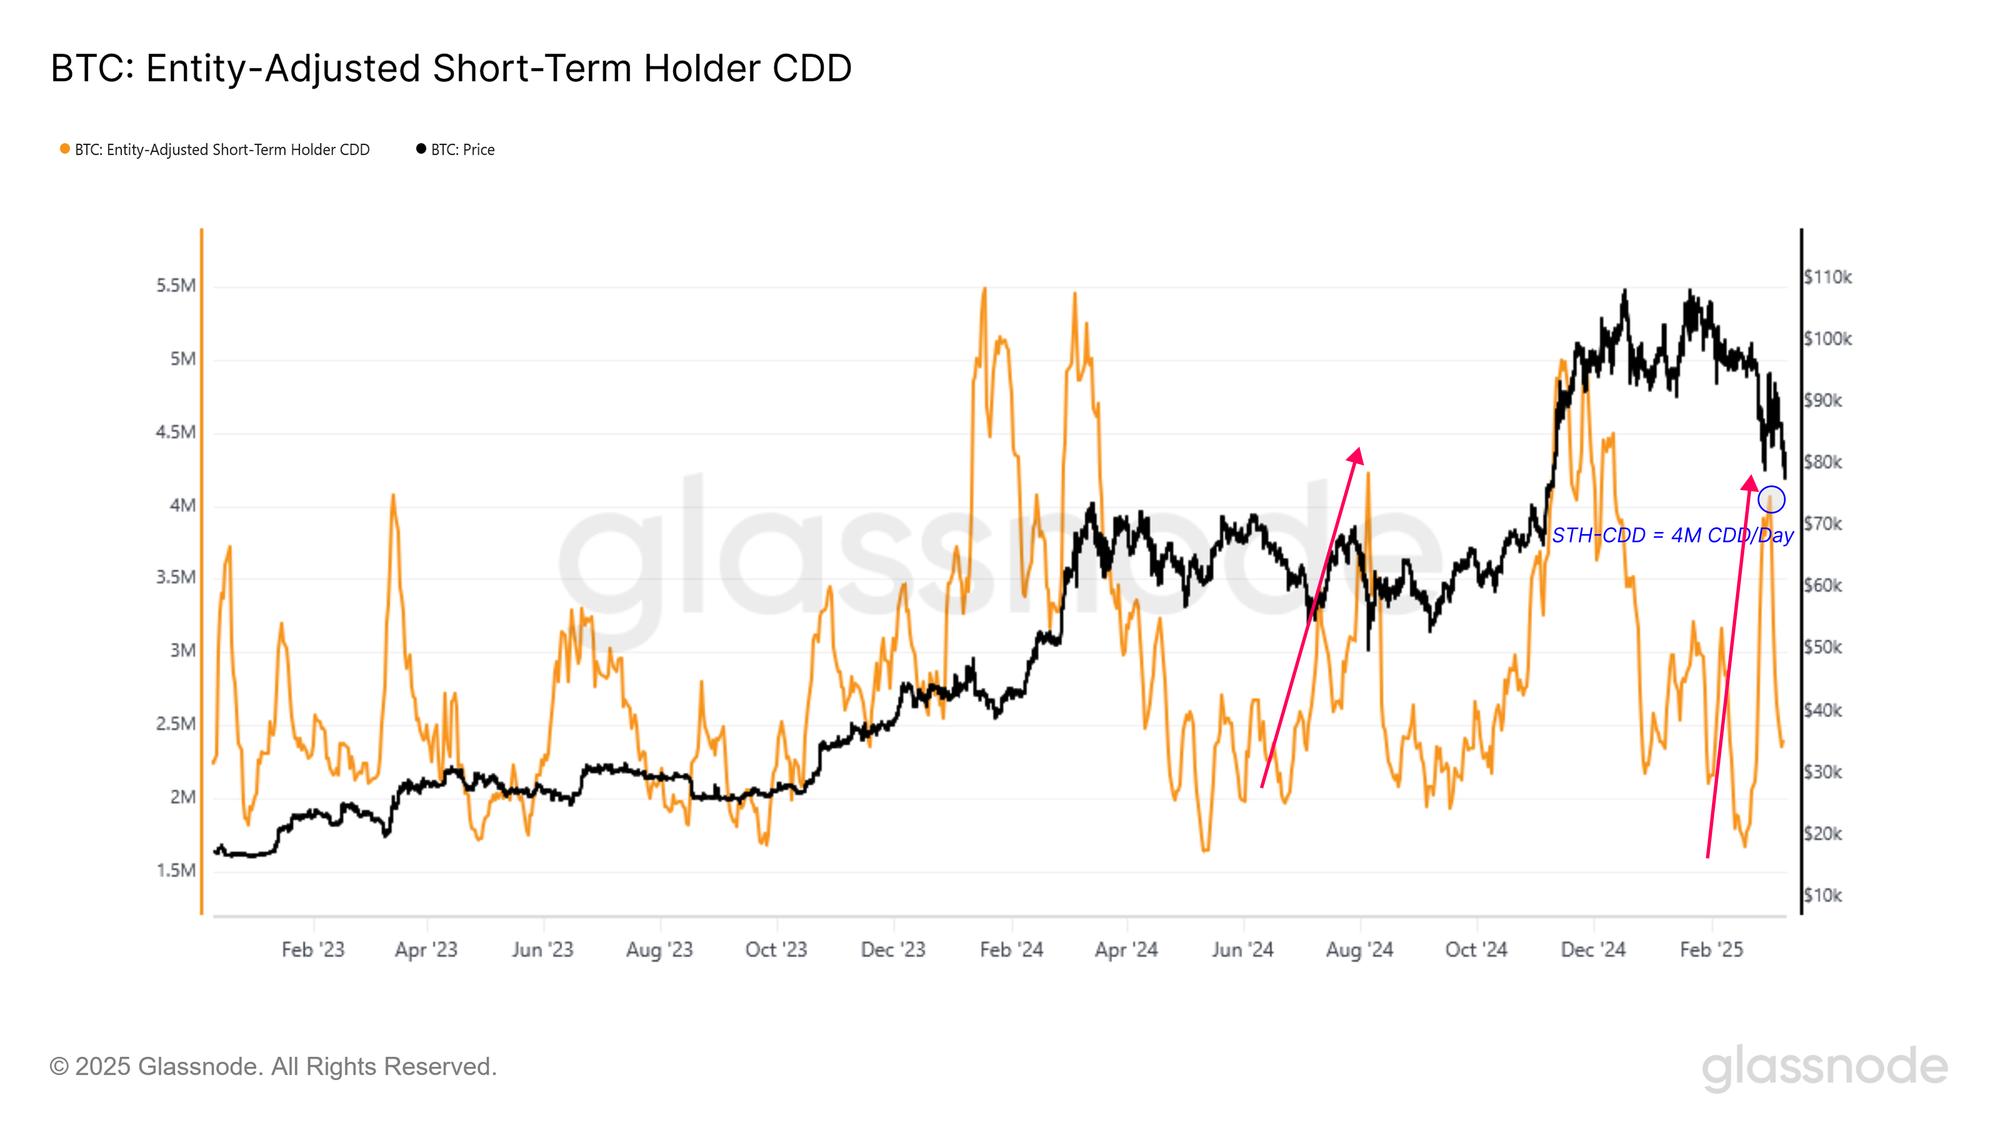
Beyond tracking loss realization, another key metric for fear-driven sell-offs is Short-Term Holder Coin Days Destroyed (STH-CDD), which measures the economic weight of new investors’ spent coins by factoring in both the volume and holding time of the coin.
During sharp market downtrends, STH-CDD spikes as investors are on the verge of becoming long-term holders panic-sell, destroying a large wave of coin days. This signals short-term holders who endured prior uncertainty capitulate, potentially adding to downward pressure.
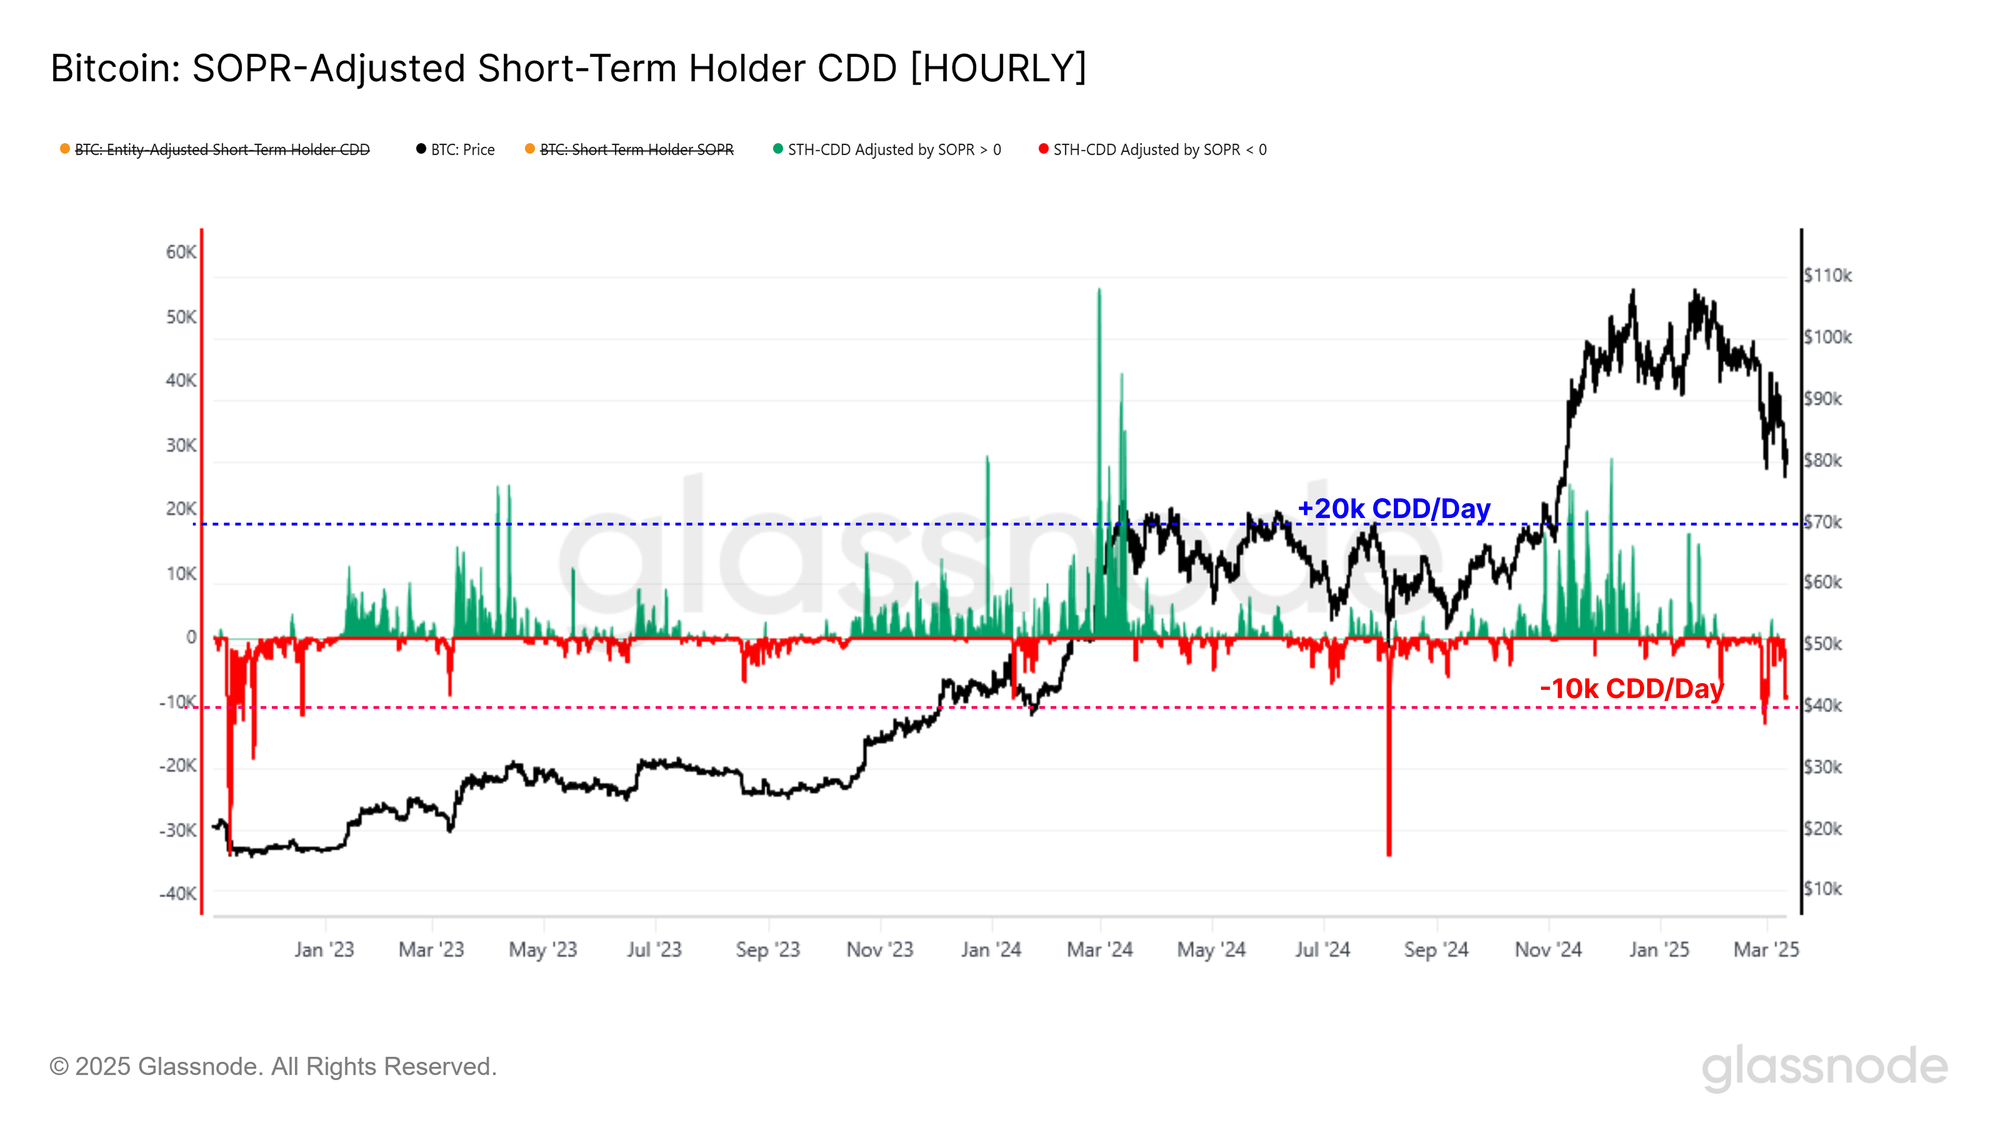
Combining these two concepts, we can construct an indicator that adjusts STH-CDD by incorporating profit/loss realization intensity, using the formula:
This metric refines STH-CDD by weighting it with the intensity and direction of realized profit or loss, providing a more precise signal of panic-driven sell-offs.
As shown in the chart below, the recent sell-off by top buyers has driven this indicator to -12.8K coin days per hour, reflecting intense loss realization and a moderate capitulation event. A similar pattern emerged in August 2024, when Bitcoin plunged to $49k amid market stress and macro uncertainty. The current structure suggests a comparable capitulation phase.
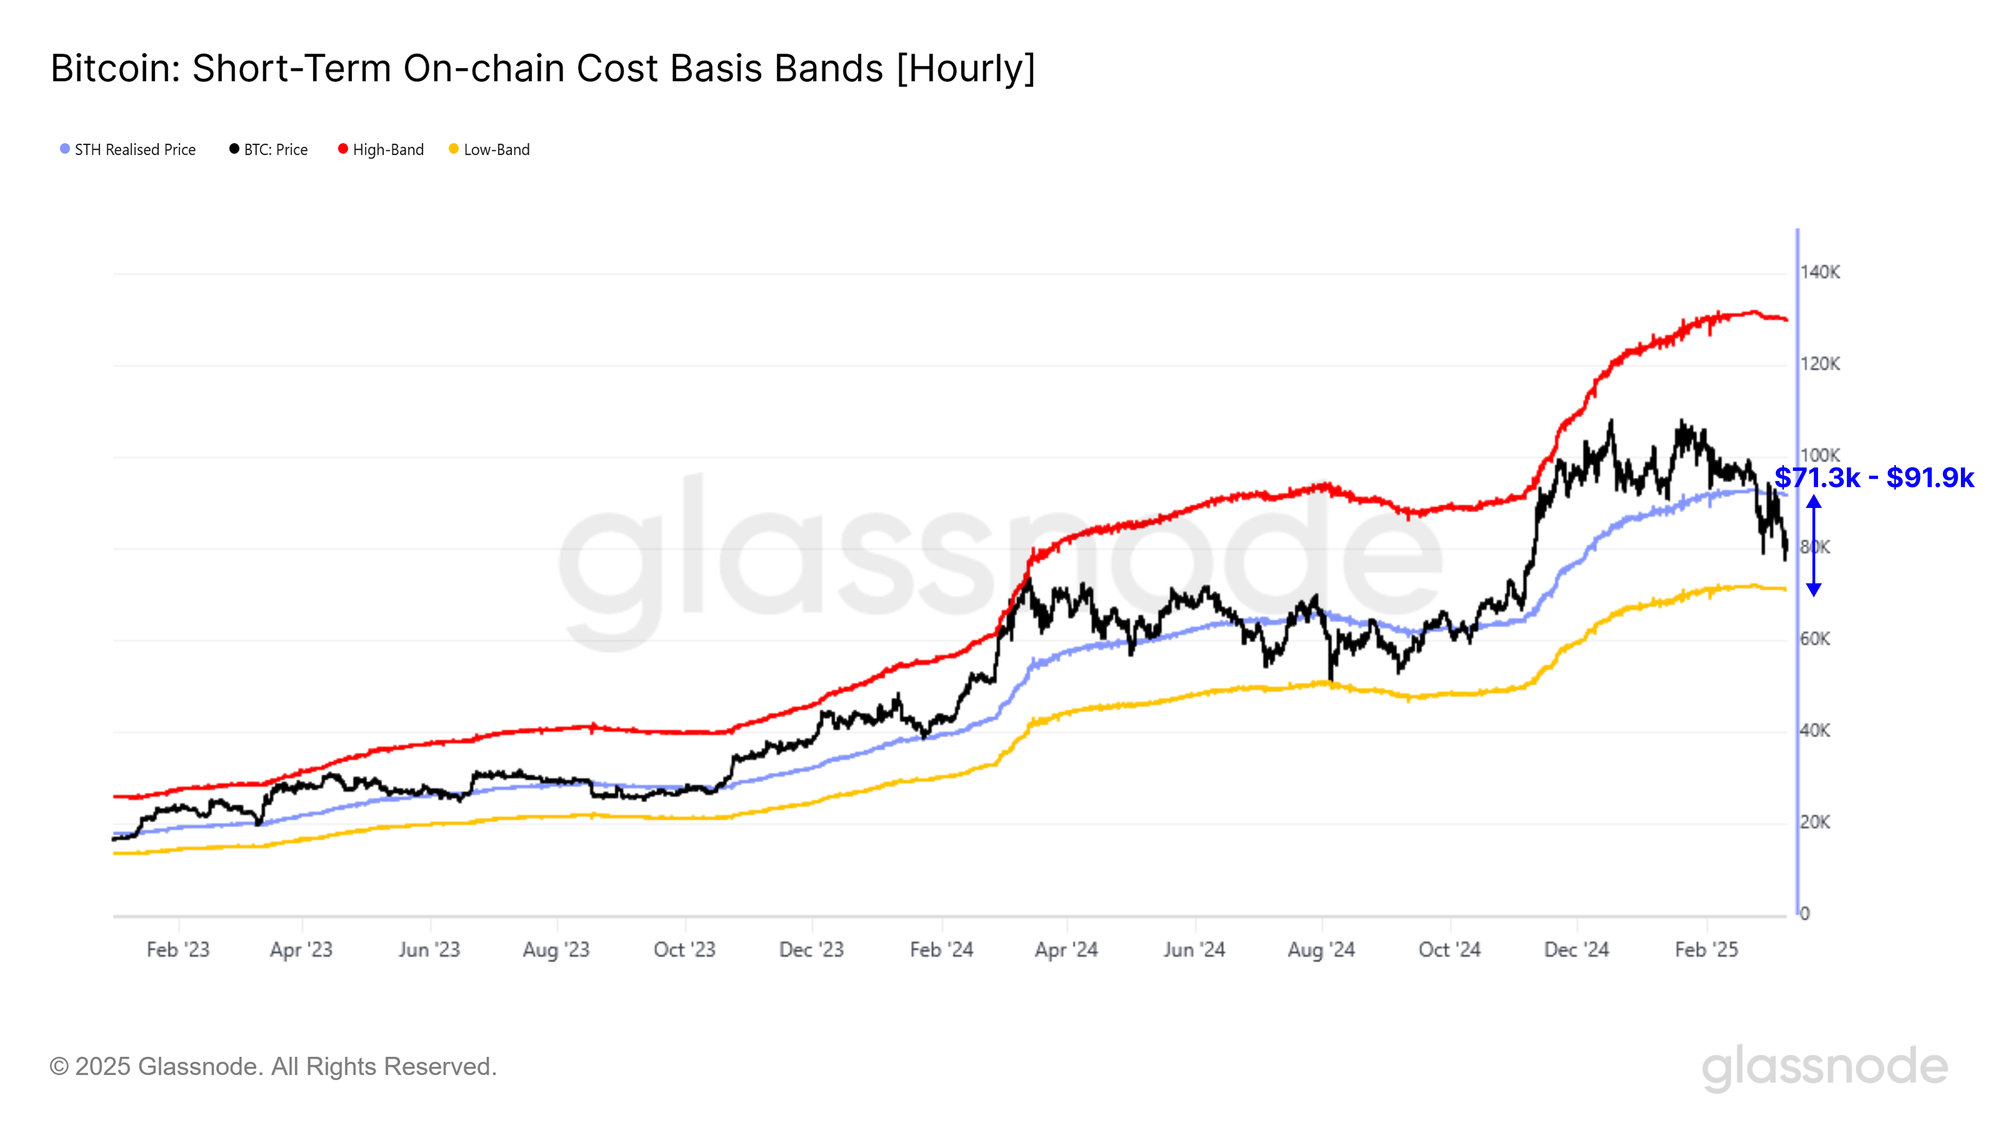
A Compass in the Bear
With sell-side pressure dominated by investors who recently acquired coins at relatively high prices, it becomes insightful to gauge how deep the current bearish phase may get. To assess this, we will use various statistical bands based on the Short-term Holders' cost basis as a read on psychological fair value extremes.
The chart below presents the statistical high and low range of price deviations derived from these cost basis models.
Currently, the lower bound of this model—where short-term holders are deeply underwater—sits between $71.3k and $91.9k. Notably, this range aligns with the previously discussed liquidity gap between $70k and $88k, suggesting that the probability of forming a temporary floor in this zone is meaningful, at least in the near term.
Summary & Conclusions
Bitcoin’s market structure has entered a post-ATH distribution phase, with weakness in aggregate demand and persistent sell pressure by recent top buyers. The Accumulation Trend Score has remained near 0.1 since early January, while the CBD Heatmap shows a fading buy-the-dip response from investors.
Using the cost-basis of Short-Term Holders, we can see that market momentum and capital flows have turned negative, signalling a decline in demand strength, and investor uncertainty is affecting sentiment and confidence.
A fear-driven capitulation of short-term holders is evident through STH-SOPR consistently trading below 1 and STH-CDD spiking. This local capitulation event also aligns with the market trading towards the lower statistical band, where recent investors are likely experiencing a high degree of financial stress.
Disclaimer: This report does not provide any investment advice. All data is provided for information and educational purposes only. No investment decision shall be based on the information provided here and you are solely responsible for your own investment decisions.
Exchange balances presented are derived from Glassnode’s comprehensive database of address labels, which are amassed through both officially published exchange information and proprietary clustering algorithms. While we strive to ensure the utmost accuracy in representing exchange balances, it is important to note that these figures might not always encapsulate the entirety of an exchange’s reserves, particularly when exchanges refrain from disclosing their official addresses. We urge users to exercise caution and discretion when utilizing these metrics. Glassnode shall not be held responsible for any discrepancies or potential inaccuracies. Please read our Transparency Notice when using exchange data.
- Join our Telegram channel.
- For on-chain metrics, dashboards, and alerts, visit Glassnode Studio.