The Week Onchain (Week 49, 2021)

Bitcoin markets have experienced another liquidation cascade, with prices falling $8.8k in a single day, forcing closed over $5.4B worth of futures contracts.

The Week Onchain (Week 49, 2021)

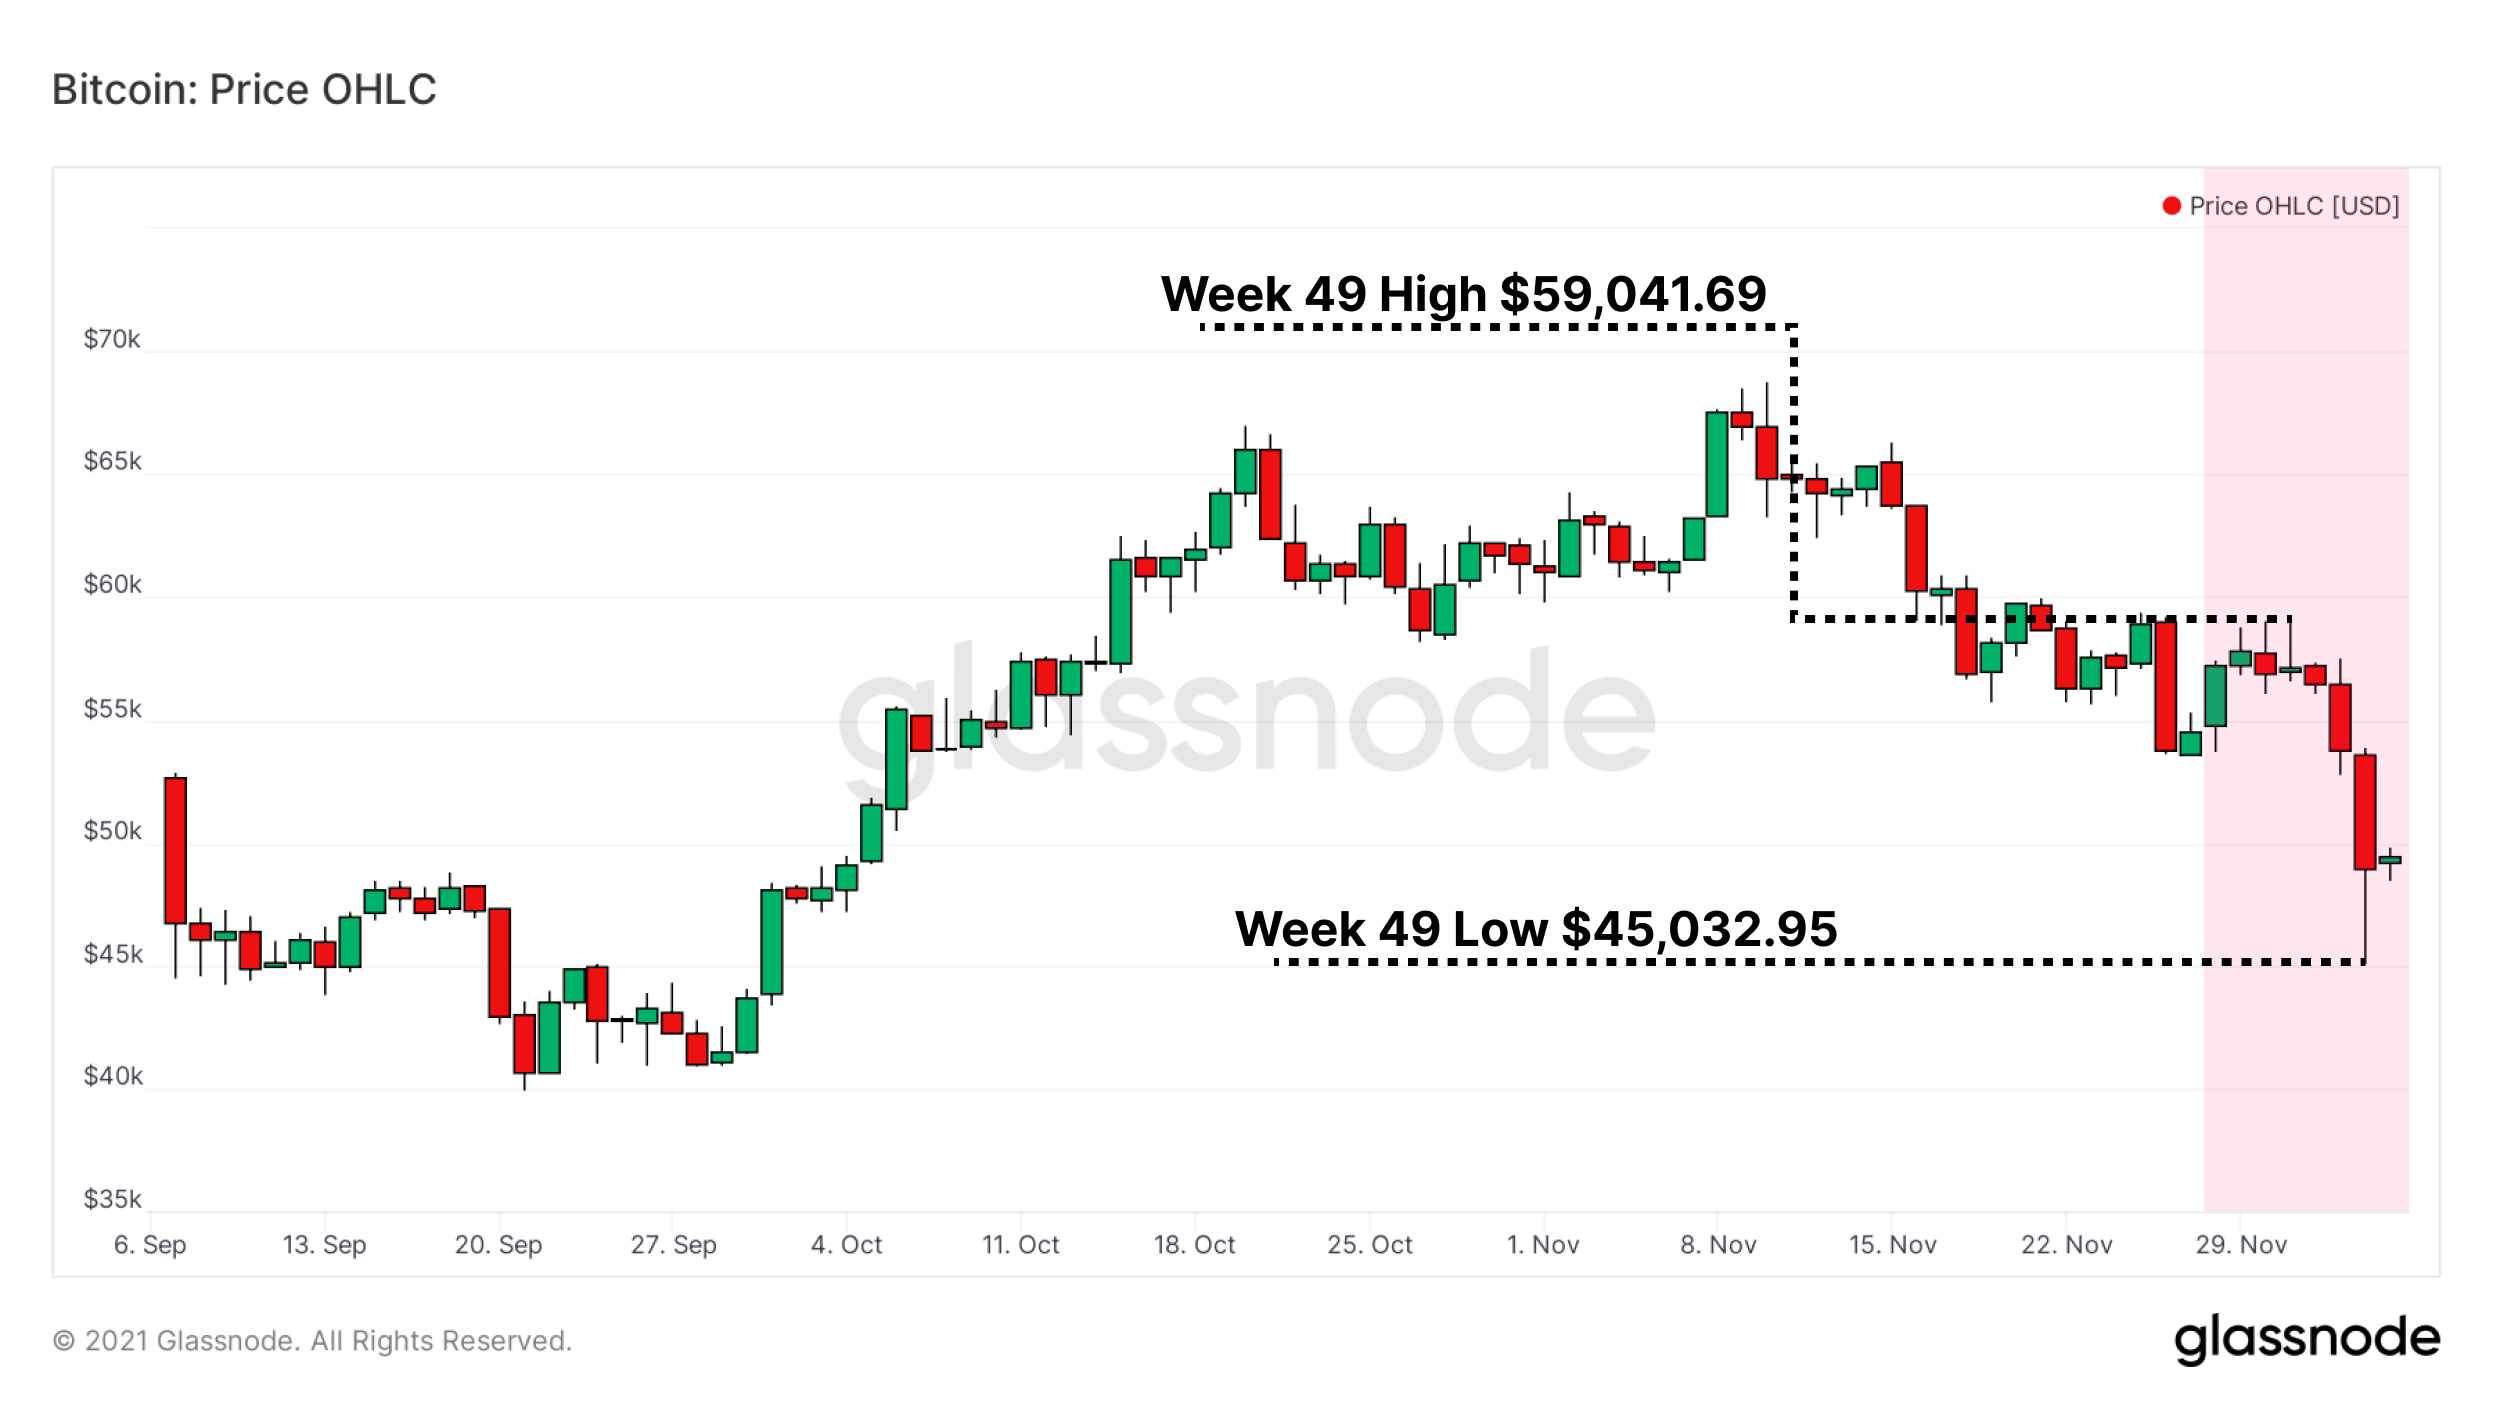
Bitcoin closed the month of November with extreme volatility and significant losses, exacerbated by a massive liquidation event in futures markets. This follows concerns about Federal Reserve tapering efforts, and the emergence of the Omicron virus variant, which has led to weakness across both Bitcoin and traditional markets.

Bitcoin opened the week at $54,815 and rallied to a high of $59,041, before plummeting to a low of $45,032 on Saturday. At the lows, this puts the market down -34.5% from the all-time high set on November 9.

To characterise this volatility, this week's newsletter will explore:

  • The de-leveraging event that occurred and drove much of the weekend sell-off,
  • Losses realized on-chain, assessed across various investor cohorts,
  • The impact on HODLer supply dynamics, and what coin holding patterns tell us about sentiment.
Live Chart

Week On-chain Dashboard

The Week On-chain Newsletter now has a live dashboard for all featured charts here. We have also started production for Week On-chain video analysis to provide a deeper dive into the thesis and logic behind each weeks analysis. Visit and subscribe to our YouTube channel, and visit our Video Portal to see our video content.


High Volume meets High Volatility

In last week's newsletter and video report, we covered the elevated risks posed by high open interest in Bitcoin futures markets, where sustained peak levels created the necessary fuel for a high volatility event. Legacy market weakness on Friday weighed on all assets globally, holding Bitcoin's price around $53K and near pivotal technical support.

When price failed to hold, sell pressure triggered a cascade of long liquidations. Within hours, Futures Open Interest had been flushed of $5.4 billion in contracts, a reduction if -24.5% in total value from the space.

Live Chart

The chain of contract closures on Saturday amounted to a total rinse of 58,202 BTC in value. In BTC denomination, this liquidation was the second largest single day change in Futures Open Interest in 2021, bested only by the historic sell-off on May 19 that totalled 79,244 BTC.

Other notable events this year include:

  • May 12 - The same day Tesla announced it would no longer accept Bitcoin as payment for electric vehicles.
  • July 26 - A short squeeze helped propel the rally out of the summer lows.
  • September 7 - The same day El Salvador began to accept Bitcoin as legal tender.
Live Workbench Chart

The futures market is not the only derivatives space that has seen high volume and interest in recent weeks. Options activity tends to spike on days of sell-offs and rallies where hedge traders look to capture volatility premiums. Last week's flush saw the second highest hourly options volume since mid-May—  more than $1.7 billion per hour.

Additionally, Options Volume has increased more than >250% since July, now regularly settling over $1 billion daily.

Live Chart

Perpetual Futures Hit Reset Button

The Futures Perpetual Funding Rate represents the directional bias of leveraged positions, and helps to manage balance in the perpetual futures market.

  • When the funding rates are positive, long traders are paying a premium to shorts for the privilege of keeping their positions open. In periods of sustained bullish price, this can be the cost of doing business.
  • Likewise, when the funding rates are negative, shorts are paying longs as a majority bear bias dominates futures.

When aggressive cascades of closures are ignited, the force of liquidations can push aggregate funding across the median line and in the opposite direction, which occurred on Saturday. After $5.4 billion in Open Interest was flushed, the Perpetual Funding Rate plummeted to -0.035%, demonstrating a complete reset of the funding bias.

The reset of funding represents the first negative aggregate rate since late September, and the deepest discount since the previous sustained negative regime in July.

Live Chart

Since the last funding reset, the perpetual market had maintained a premium regime for over two months. Confidence among traders can oscillate over time, and monitoring the trend of Long Liquidations Dominance can provide insights into the cyclical shifts in speculator sentiment.

As price rose out of the July lows, the existing short bias from summer carried into the rally. Short liquidations dominated futures for weeks as biases were tested, and it wasn't until early October when the trend began to reverse.

Confidence had fully shifted hands by late October, and a consistent premium regime led the market while long traders felt the pain of liquidations. These cyclical trends are part of the natural oscillation of markets.

Live Chart

Whenever price creates new highs, there are invariably traders who buy the top. These new investors are the first group tested by the next period of uncertainty, and nothing spells uncertainty like a flash sell-off in futures.

With cascading liquidations come spenders in loss, and last week's event set a recent high for Realized Losses on-chain. The sum of coins spent in loss for December 4 totalled $3 billion. Coming into Saturday, previous high marks were set on May 19 and June 25, with losses of $4.5B and $3.8B respectively.

Live Chart

HODLers Set the Floor

Now that we have assessed the derivatives space, we turn our eyes to the on-chain supply dynamics that illustrate HODLer behavior. The various cohorts of Bitcoin supply that comprise the HODLer class are the inertial bellwethers we use for determining macro market direction, and (assumed) smart-money sentiment.

The HODL Waves visualize the entirety of Bitcoin's supply divvied up by the age of coins. The interpretation is as follows:

  • Newly spent coins have lifespans of zero, and they appear in the younger bands (warmer colors) at the bottom to begin aging.
  • As coins lay dormant and mature, they graduate into older, higher cohorts (cooler colors).

When filtered to show coins younger than 3 months, we see that only 2.63% of older coin supply has been distributed into this group since October 27. That means that over 97% of the supply older than 3 months has remained unspent since the recent all-time high and pullback. HODLers of older coins are not spending them, by and large.

Live Chart

To add depth to this perspective, we look at Dormancy. Dormancy measures the average age of transactions (in days) on-chain per unit of BTC spent. It is similar to the Average Spent Output Lifespan, but with a volume weighting.

  • Rising Dormancy means older coins are being spent at higher volumes.
  • Declining Dormancy indicates a reduction in older coin spending volume.

The average baseline level for 2020 was a Dormancy level of 40 days, and we are well below that value now, sitting at an average of 25 days. In fact, Dormancy has been in a macro decline since the height of the bull run in January. The implication is that HODLer cohorts are exhibiting steady maturation behavior, and activity on-chain is dominated by younger coins.

Generally speaking, this demonstrates high conviction, despite extreme volatility and losses. Quite the contrast to this week's price action.

Live Chart

Knowing that older coins continue to sit dormant, we can look at exchanges to determine how much activity may be occurring there, and corroborate our theory of a lack of distribution.

Exchange Fee Dominance looks at total exchange activity as a percentage of on-chain fees each day. High activity can be interpreted as characteristic of elevated interest or urgency for holders.

  • When this value is high or rising, exchanges are producing elevated settlement activity on-chain, as seen in late 2020 and into spring 2021 during the bull run.
  • Flat or declining activity means that exchanges are experiencing a reduction in settlement on-chain, and could be seeing quieter activity overall as interest wanes or investors calm down.

The observation to make about Exchange Fee Dominance is the precipitous decline since the recent all-time high. Exchange fees are now at their lowest share of on-chain settlement activity since October 2020.

Live Chart

The balance of BTC on exchanges is a metric worth monitoring in periods of volatility, as it marks the primary barrier to exit for holders: placing coins on an exchange for sale.

We observe the flow of coins to/from exchanges here by looking at Exchange Net Transfer Volume. During the capitulation in May, exchanges saw a notable and sustained uptick of BTC inflows, with periods of 10.4k and 13.9k net BTC deposits. This contrasts with the present moment, where recent peak exchange inflows are a fraction of the size, at 2k and 3.2k BTC. Bitcoin holders aren't behaving as they have in prior moments of weakness, hinting at an underlying confidence, and largely confirming weakness was more heavily influenced by derivative markets rather than spot selling.

Live Chart

So if older coins are not being spent in notable size, and exchanges are not seeing elevated activity, then where are spent coins coming from?

They're coming from Short Term Holders— investors who bought in the past few months, most of whom are spending at a loss.

Short-Term Holder SOPR shows the profitability of coins spent by Short-Term Holders. The chart below is interpreted as:

  • Higher value prints indicate profit taking by coins spent from lower prices.
  • Bounces against a value of 1 are tests of holders' cost basis.
  • Prints below 1 indicate coins being spent in loss.

Short-Term Holder SOPR printed its lowest value since late July, which shows the hallmark signature of a capitulation by newer investors. For Short-Term Holders to be realizing losses here means they had to buy their coins at the recent tops, and are already spending them to new hands. This group appears to be the only cohort reacting significantly to the events of last week. More mature HODLers remain unmoved.

Live Chart

Through our observations of the data, last week's sell-off was driven by liquidations in the futures market, and the various on-chain cohorts that make up Bitcoin's supply remain largely unfazed. Those who are spending coins appear to be predominantly those who bought the top, and they are realizing losses and capitulating.

High levels of leverage followed by price volatility is a classic recipe for a correction, and capitulative moments like Bitcoin just experienced are unfortunately needed for markets to return to a healthy equilibrium. The key question we will seek to answer in the coming weeks, is whether market sentiment has taken a severe enough hit that the underlying conviction seen this week deteriorates, or does it hold on.


Product Updates

  • Workbench formulas can now refer to other formulas as f1, f2 etc.
  • Released Pi Cycle Top indicator.
  • Corrections for ETH and ERC20 exchange inflow and outflow data.

Disclaimer: This report does not provide any investment advice. All data is provided for information purposes only. No investment decision shall be based on the information provided here and you are solely responsible for your own investment decisions.