An On-Chain Distribution Analysis of Kyber Network Crystal (KNC)
An in-depth look into the KNC ecosystem; exploring recent growth, exchange balances and a broad token holder distribution analysis.


This report looks at the token holder distribution of Kyber Network Crystal and is based on block 9,685,690 (March 16th 2020) - at which point 50,437 addresses were holding more than 1 KNC.
What is Kyber Network?
Kyber is an on–chain liquidity protocol based on Ethereum that enables users to instantly trade between a wide range of token pairs. Liquidity is sourced from various on–chain reserves and the protocol is built to be integrated into decentralized applications.
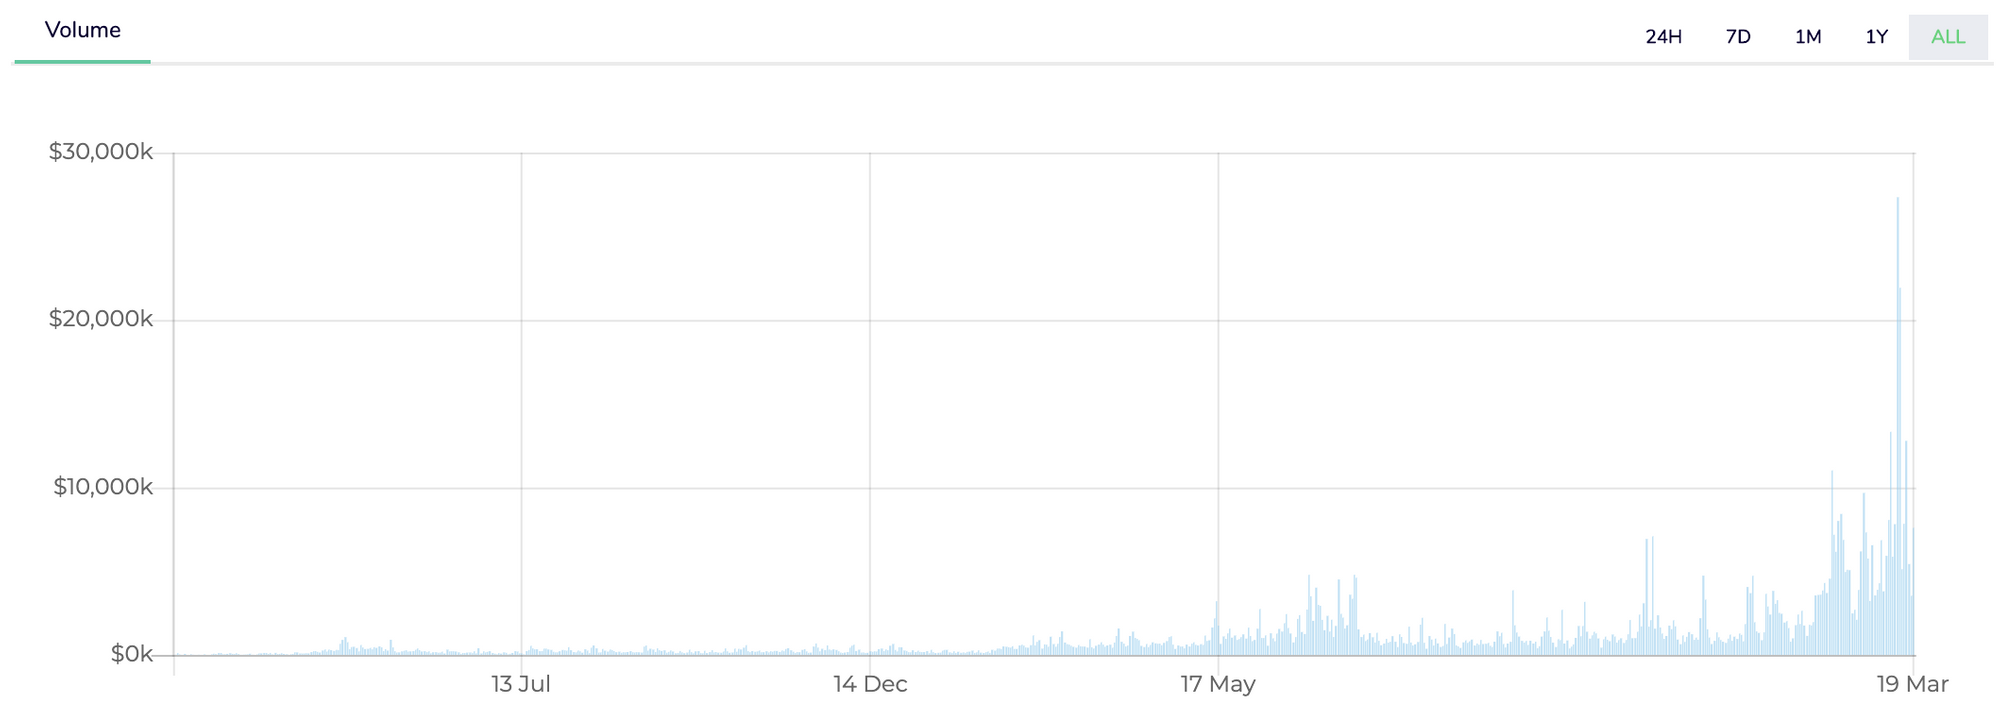
Since its mainnet launch in February 2018, Kyber has become a cornerstone of the decentralized finance (DeFi) ecosystem with a wide range of applications integrating the protocol. February 2020 saw trading volume through the platform boom and during the recent market crash, Kyber facilitated over $30m in trades over a period of 24 hours - a new record for the protocol.
The Kyber Network Crystal token (KNC) is used to operate liquidity reserves and pay network fees. In each Kyber powered transaction, part of the network fee is paid to the application that facilitated the trade, and the remainder is removed from circulation. With their upcoming Katalyst upgrade, KNC holders will also be able to stake their tokens and participate in protocol governance through the KyberDAO.
Total Supply Distribution
As mentioned above, Kyber has a deflationary token model whereby a portion of collected trading fees are burned and removed from circulation. 215,625,349 token were minted during the ICO - since then, 4,285,840 have been burned leaving KNC with a total supply of 211,339,508.
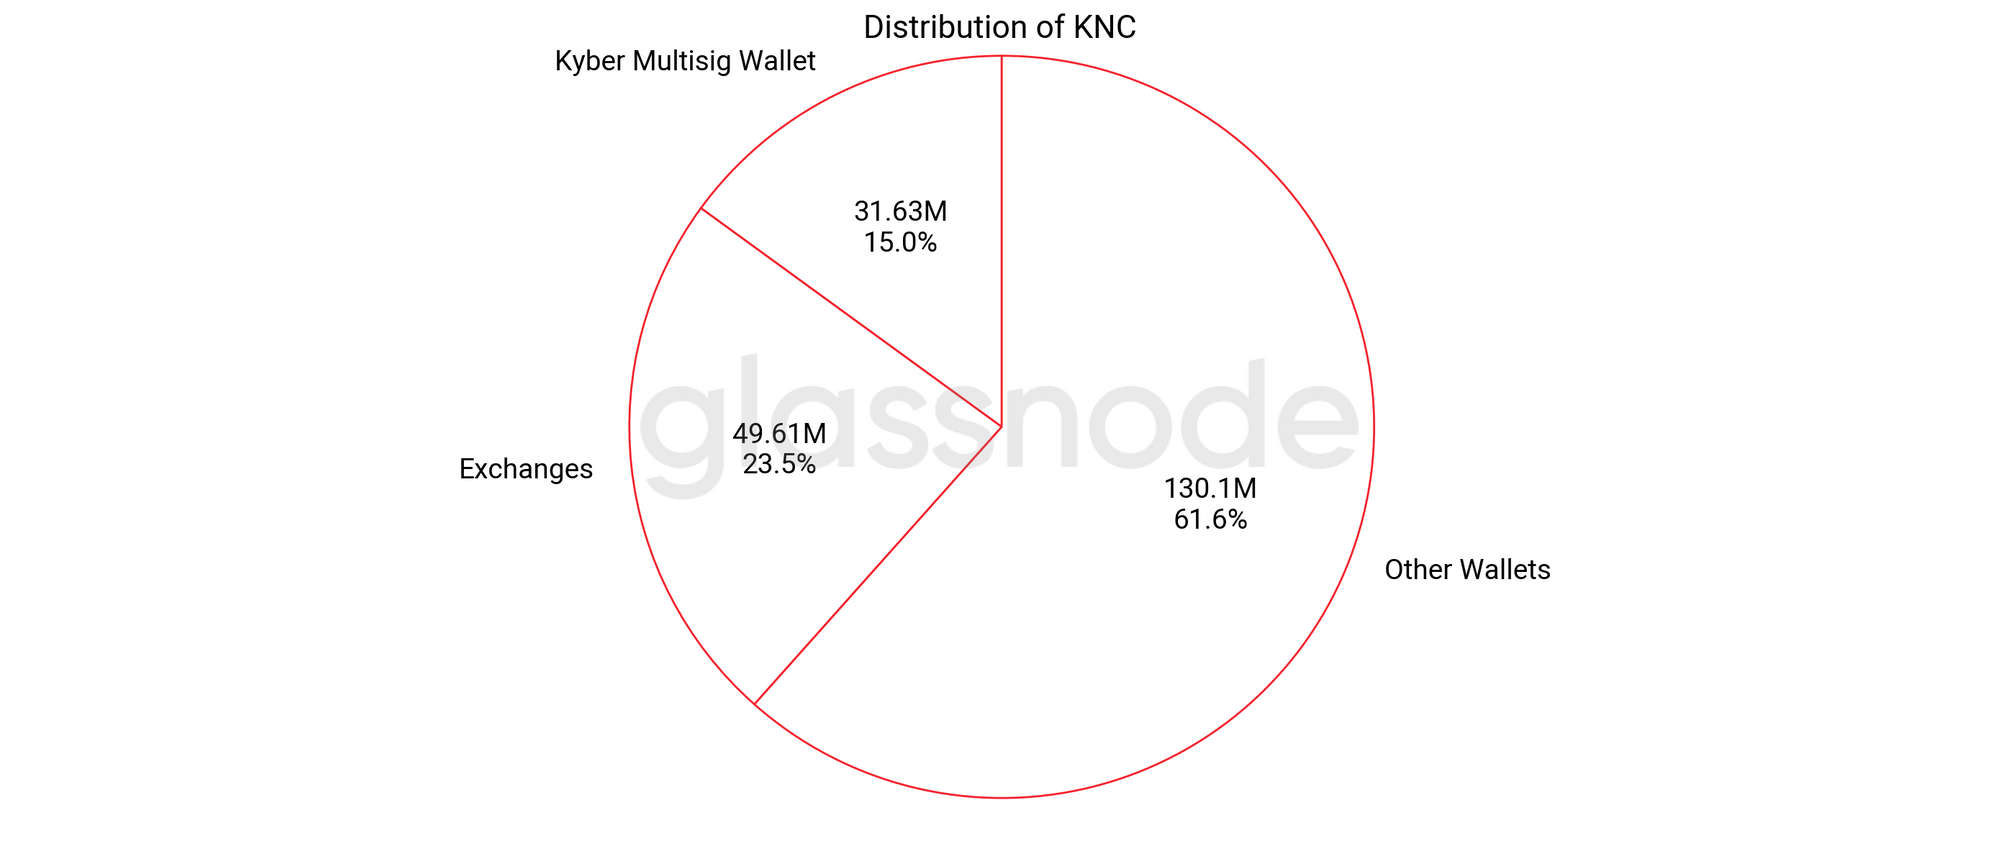
Below is the current distribution of KNC. It includes: the Kyber multisig wallet, known exchange wallets, and an aggregate of all other unlabelled wallets.
Exchanges
23.5% of the total KNC supply (49.61M) is stored in exchange wallets, at a similar level to many other popular ERC20 tokens with high trading volumes.
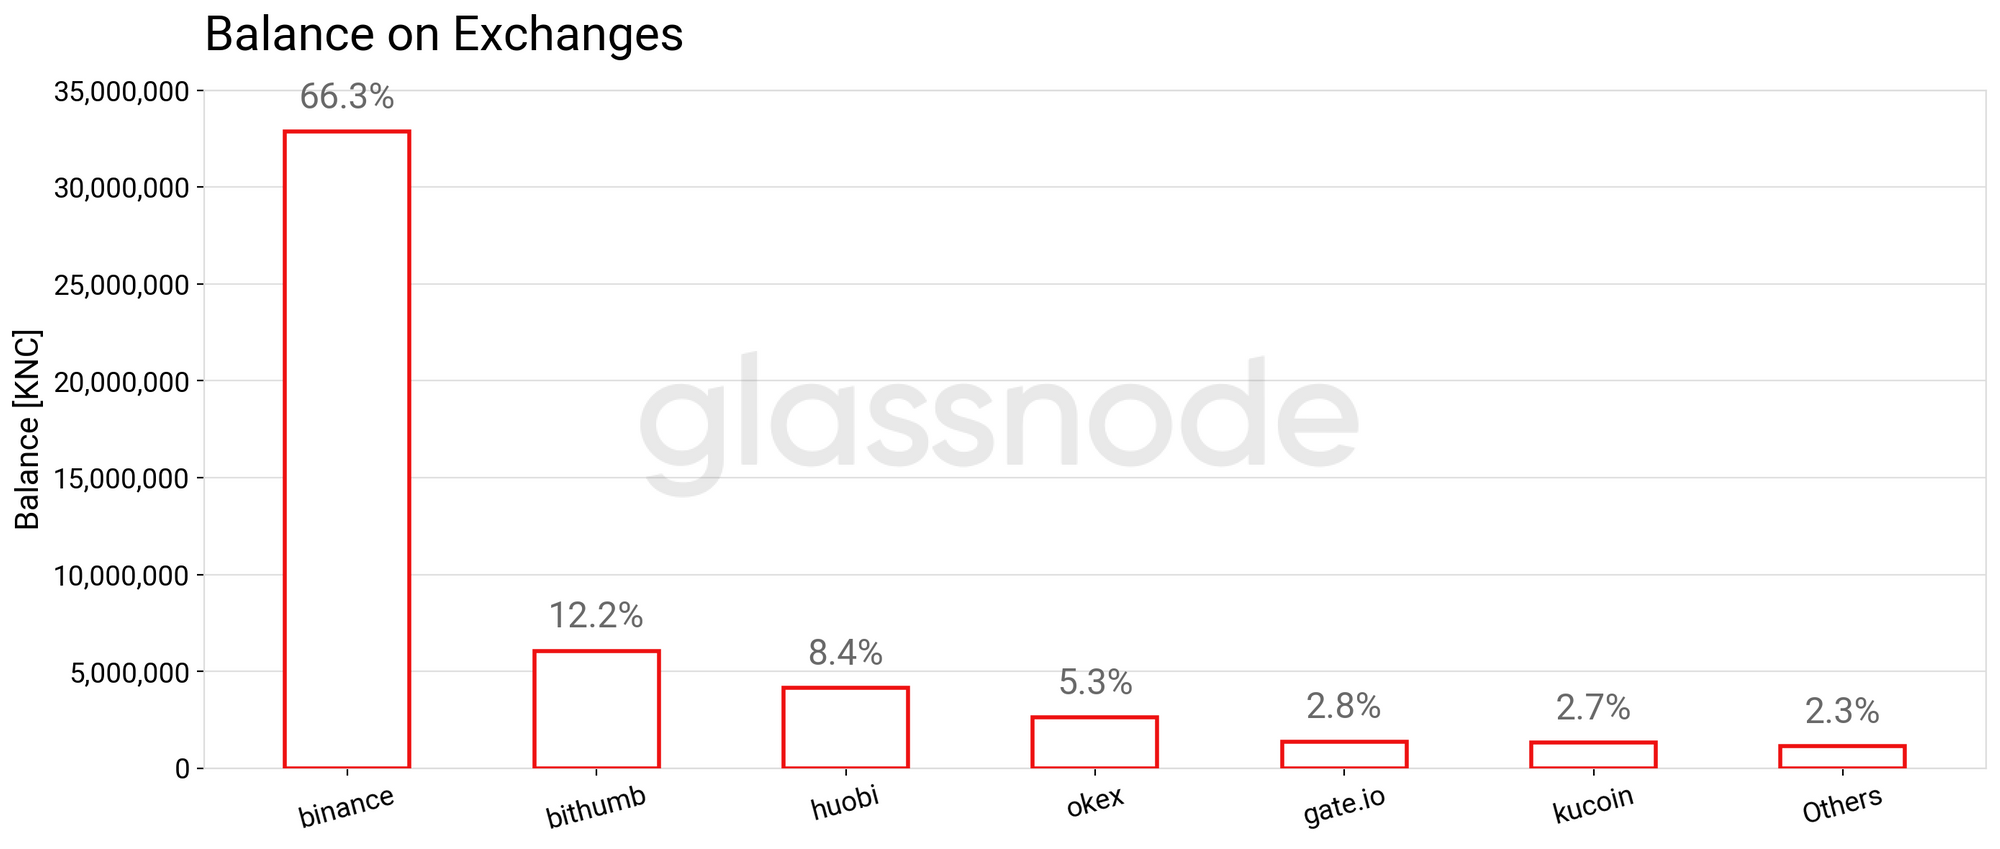
Binance has the largest market share by a considerable margin with 66.3% of KNC being stored in their wallets - unsurprising given the high trading volume on KNC pairs.
Note: Coinbase wallet flags are currently unknown and are omitted from this analysis. Kyber was recently listed on the platform and trading volume is increasing so market shares are likely less than shown.
Token Holder Distribution
In order to get the best possible picture on how KNC funds are distributed across participants in the network, in all subsequent analyses the team multisig wallet and known exchanges are excluded.
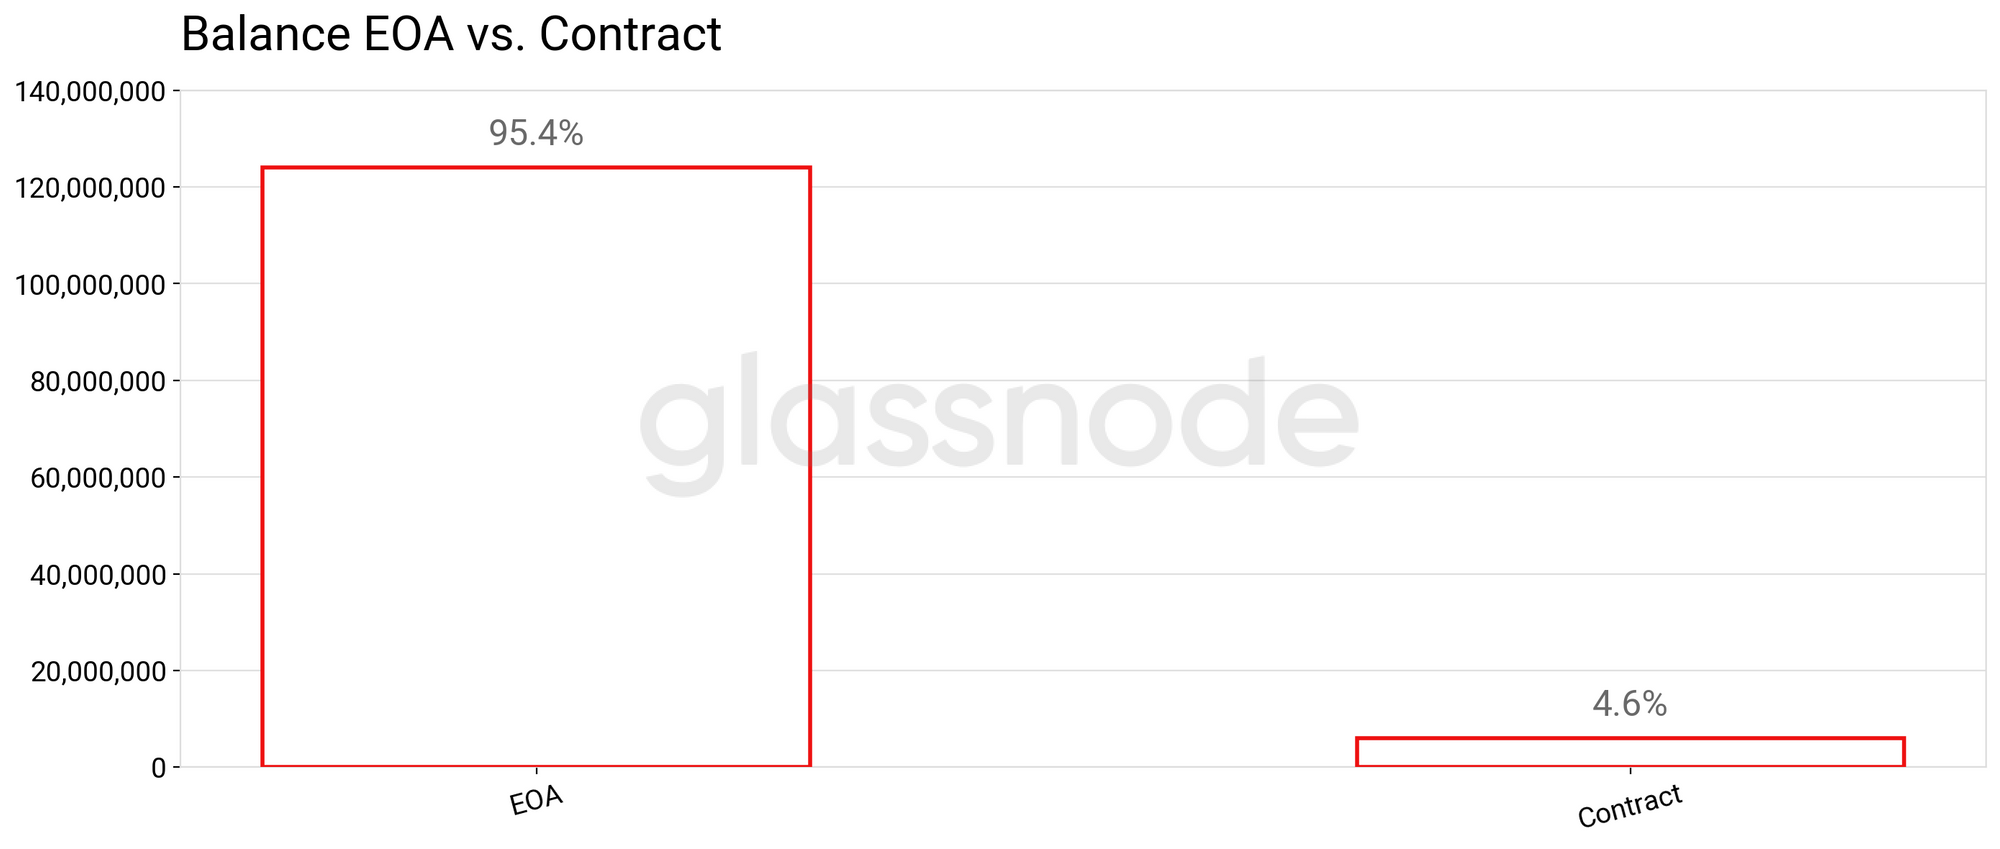
EOA vs. Contracts
As shown below, externally owned account hold the majority of KNC with 124,055,523 tokens vs just 6,045,993 in contracts. When the Katalyst protocol upgrade arrives on the Ethereum mainnet, this could change as users begin to stake their tokens to participate in the KyberDAO.
EOA vs. Contracts
Top Contracts Holding KNC
Most contracts holding a large amount of KNC are connected to decentralised exchanges or other DeFi applications. Other notable contracts include two unknown multi sig wallets - both of which have received large KNC transfers from the Kyber multi sig wallet at some point in time.
| Label | Address | Balance |
|---|---|---|
| Aave: Lending Pool Core | 0x3df...76d3 | 2,763,038.79 |
| Unknown Multi Sig Wallet* | 0x5d...15e7 | 700,000.00 |
| Unknown Multi Sig Wallet* | 0x81...6769 | 623,681.48 |
| Uniswap: KNC | 0x49...1a8b | 443,750.73 |
| Kyber: Reserve KNC | 0x60...855d | 405,433.80 |
| EtherDelta 2 | 0x8d...6819 | 175,971.62 |
| Unknown | 0xfd...0d54 | 83,722.71 |
| bZx: Vault | 0x8b...1633 | 78,471.58 |
| Bancor Smart Token Relay | 0x24...cbf8 | 74,603.18 |
EOA Distribution
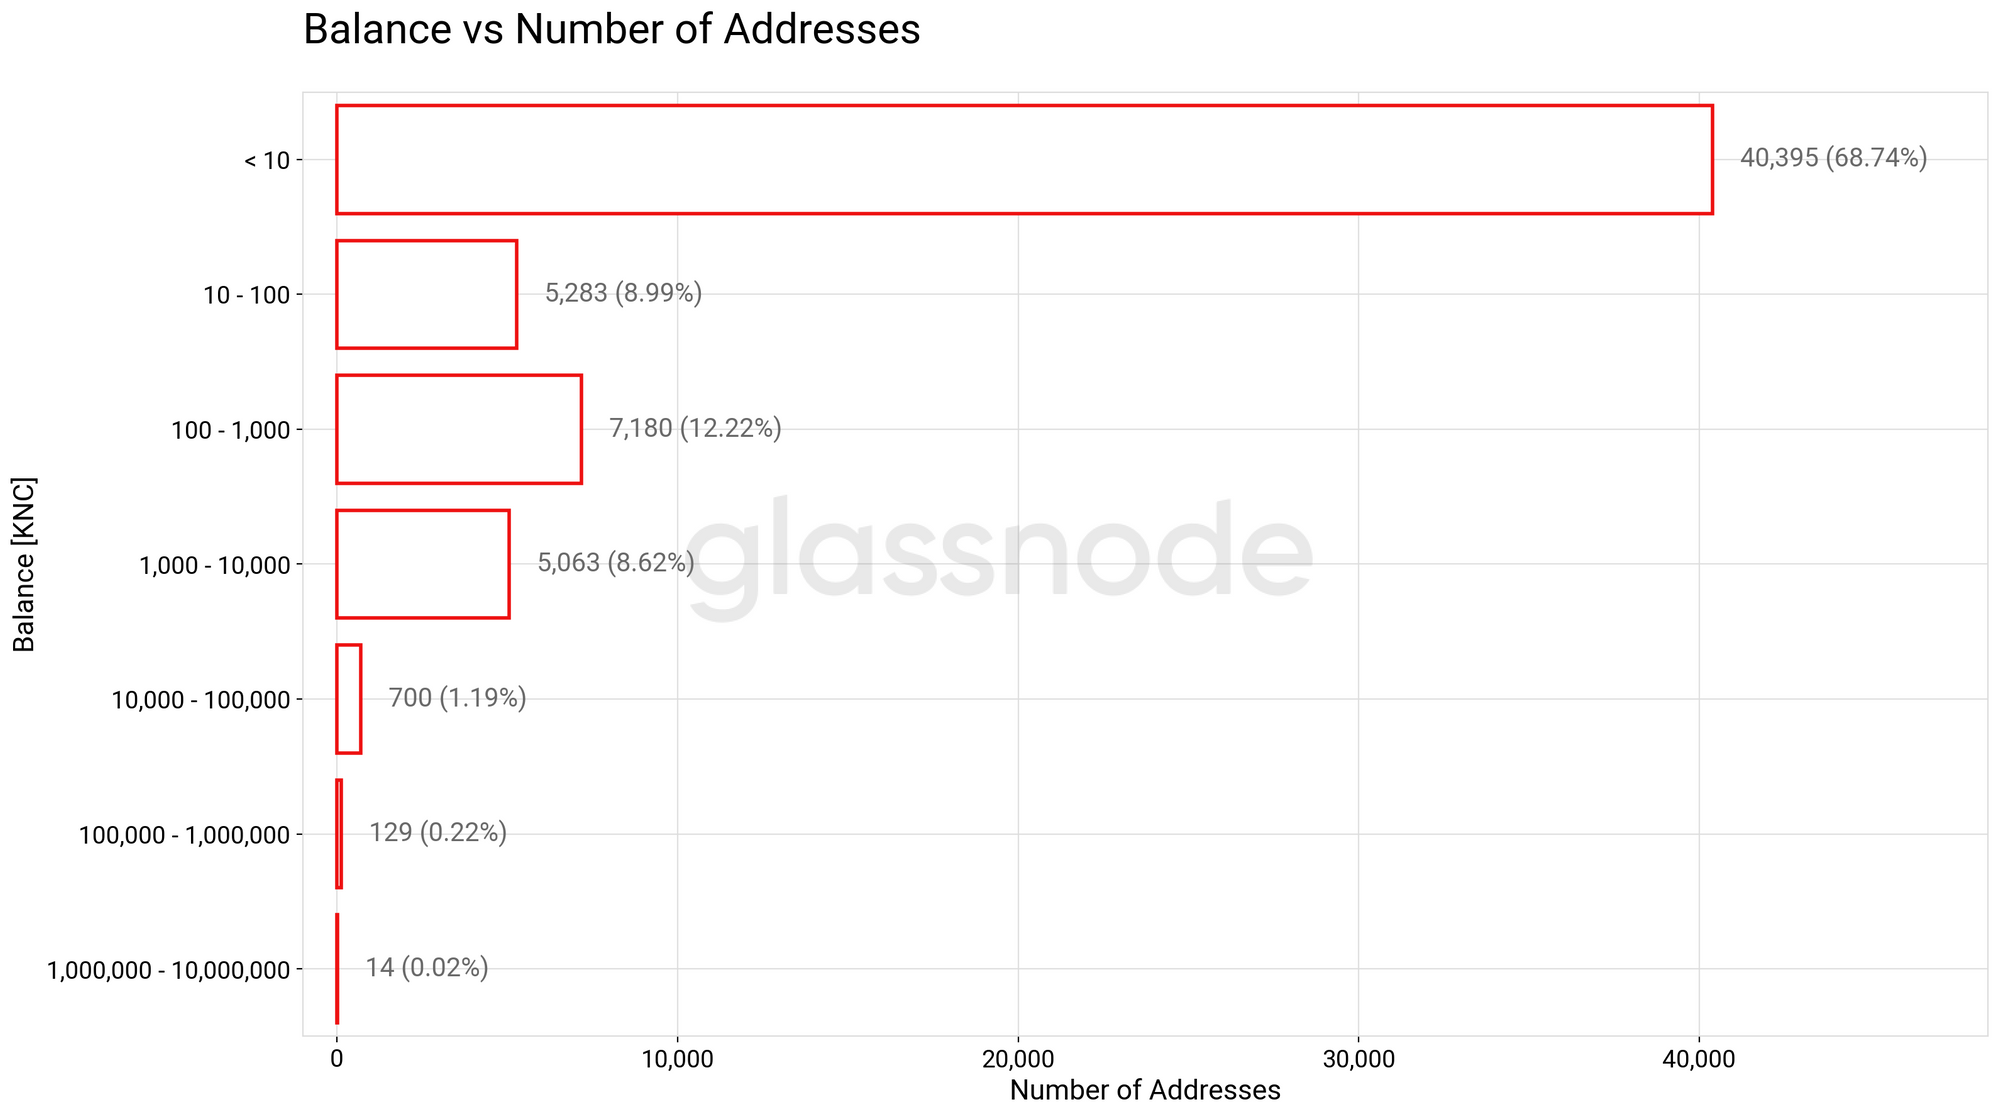
In order to get the most accurate distribution analysis of token holders, only non-contract (externally owned) account addresses are considered in the following analyses.
The chart below shows that the majority of addresses hold under 10 KNC, with the second largest group holding between 100-1000. Interestingly, similar results were found in an analysis of Chainlink and Basic Attention Token.
Even though addresses holding <1,000 KNC vastly outnumber those holding more, this does not represent a large portion of the circulating supply. The following chart better illustrates KNC's distribution by showing the total amount of KNC held by addresses within particular balance ranges:
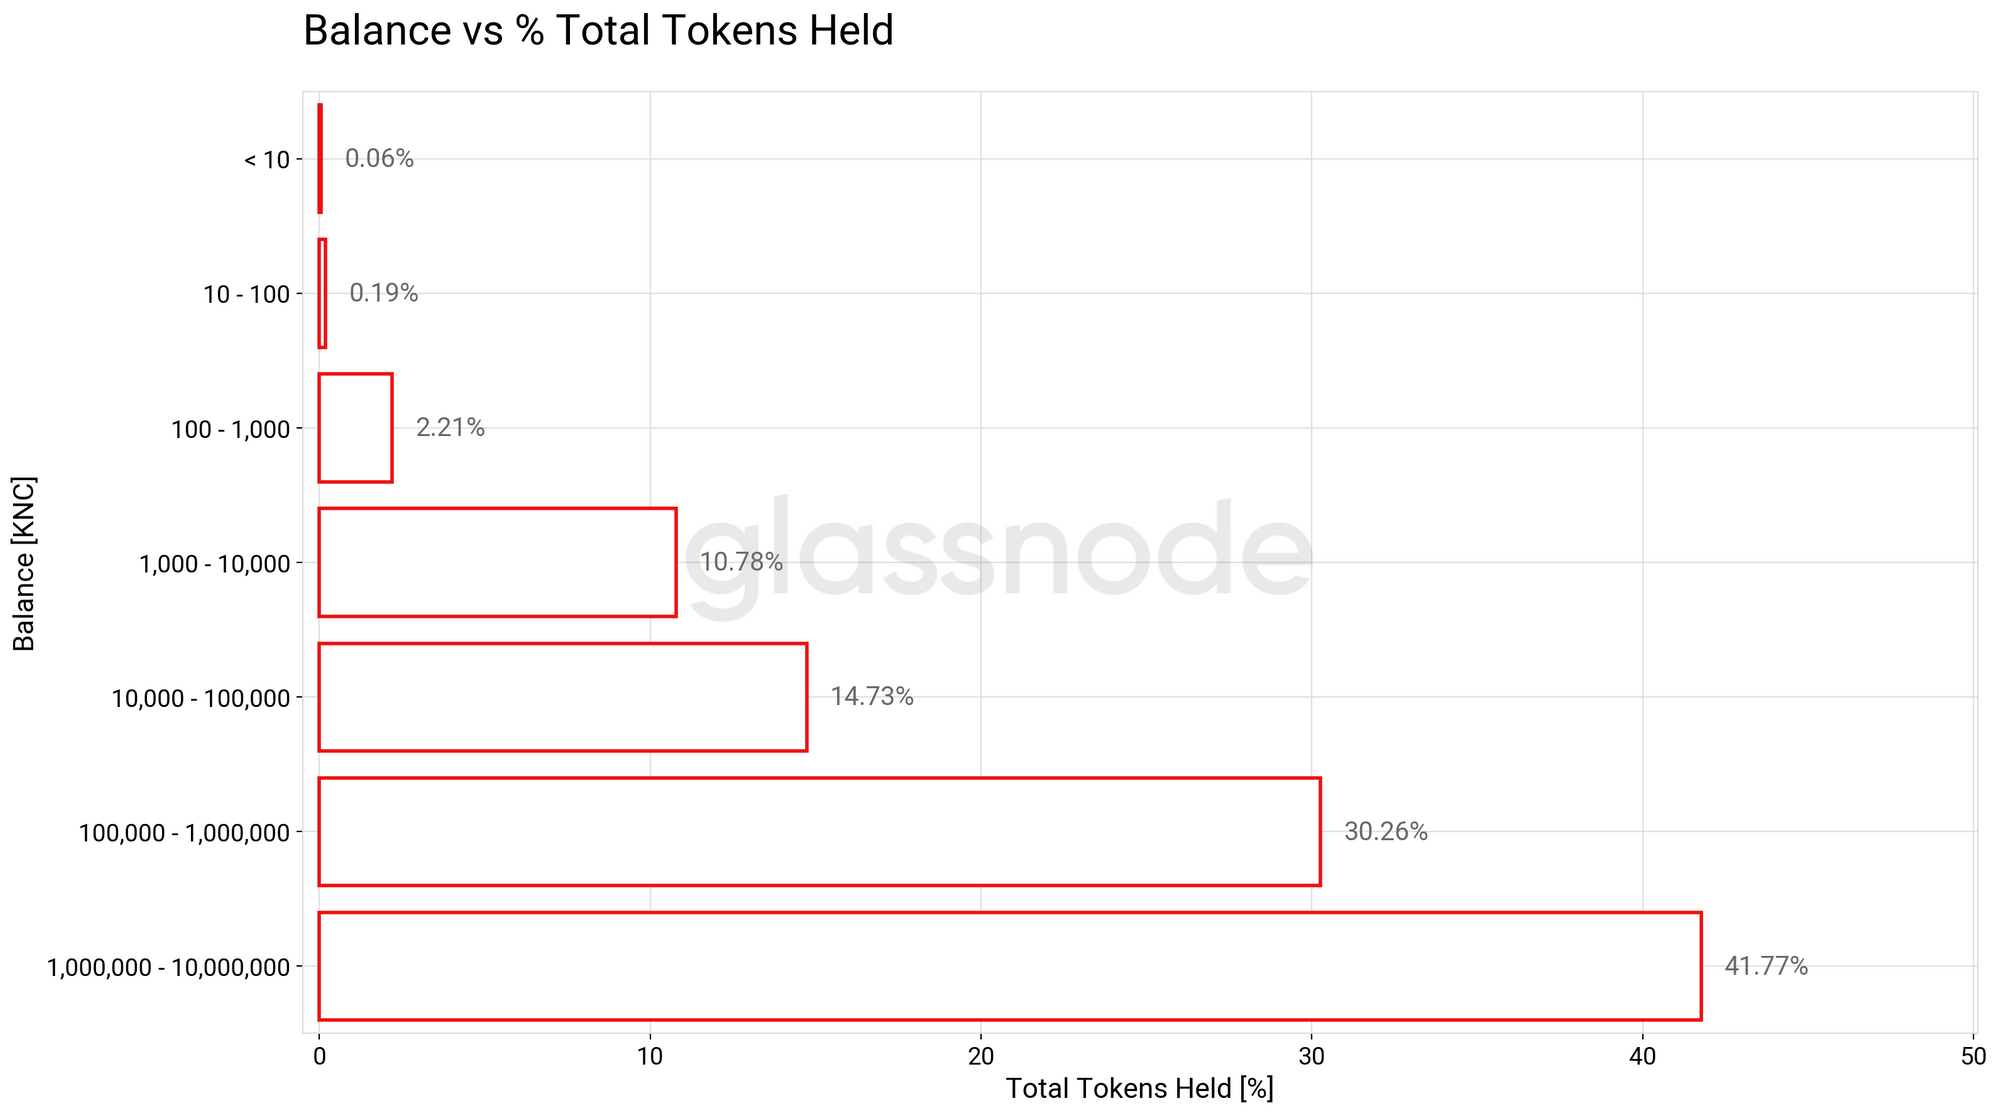
A whopping 72.03% of KNC (the sum of the two largest bars in the chart above) are owned by the top 0.24% of addresses. 13.24% of the supply is controlled by market participants with an investment below $4,100 USD.
The resulting Gini coefficient of this distribution is ~0.98.
To sum up, this EOA distribution analysis shows that:
- The top 0.01% of addresses hold 28.53% of KNC.
- The top 0.1% of addresses hold 61.18% of KNC.
- The top 1% of addresses hold 84.34% of KNC.
- The top 5% of addresses hold 93.67% of KNC.
It should be noted that this is not an uncommon distribution. Many ERC20 tokens are very similar when looking at network participant holdings - for example, in previous analyses, it was found that 94% of BAT and 90.65% of LINK was held by the top 5% of addresses.
KNC Distribution: What is the Trend?
Having explored KNC's current distribution, this next section investigates how this distribution evolved over time and highlights any trends found in the data.
The chart below shows the number of addresses with at least 1 KNC over time:
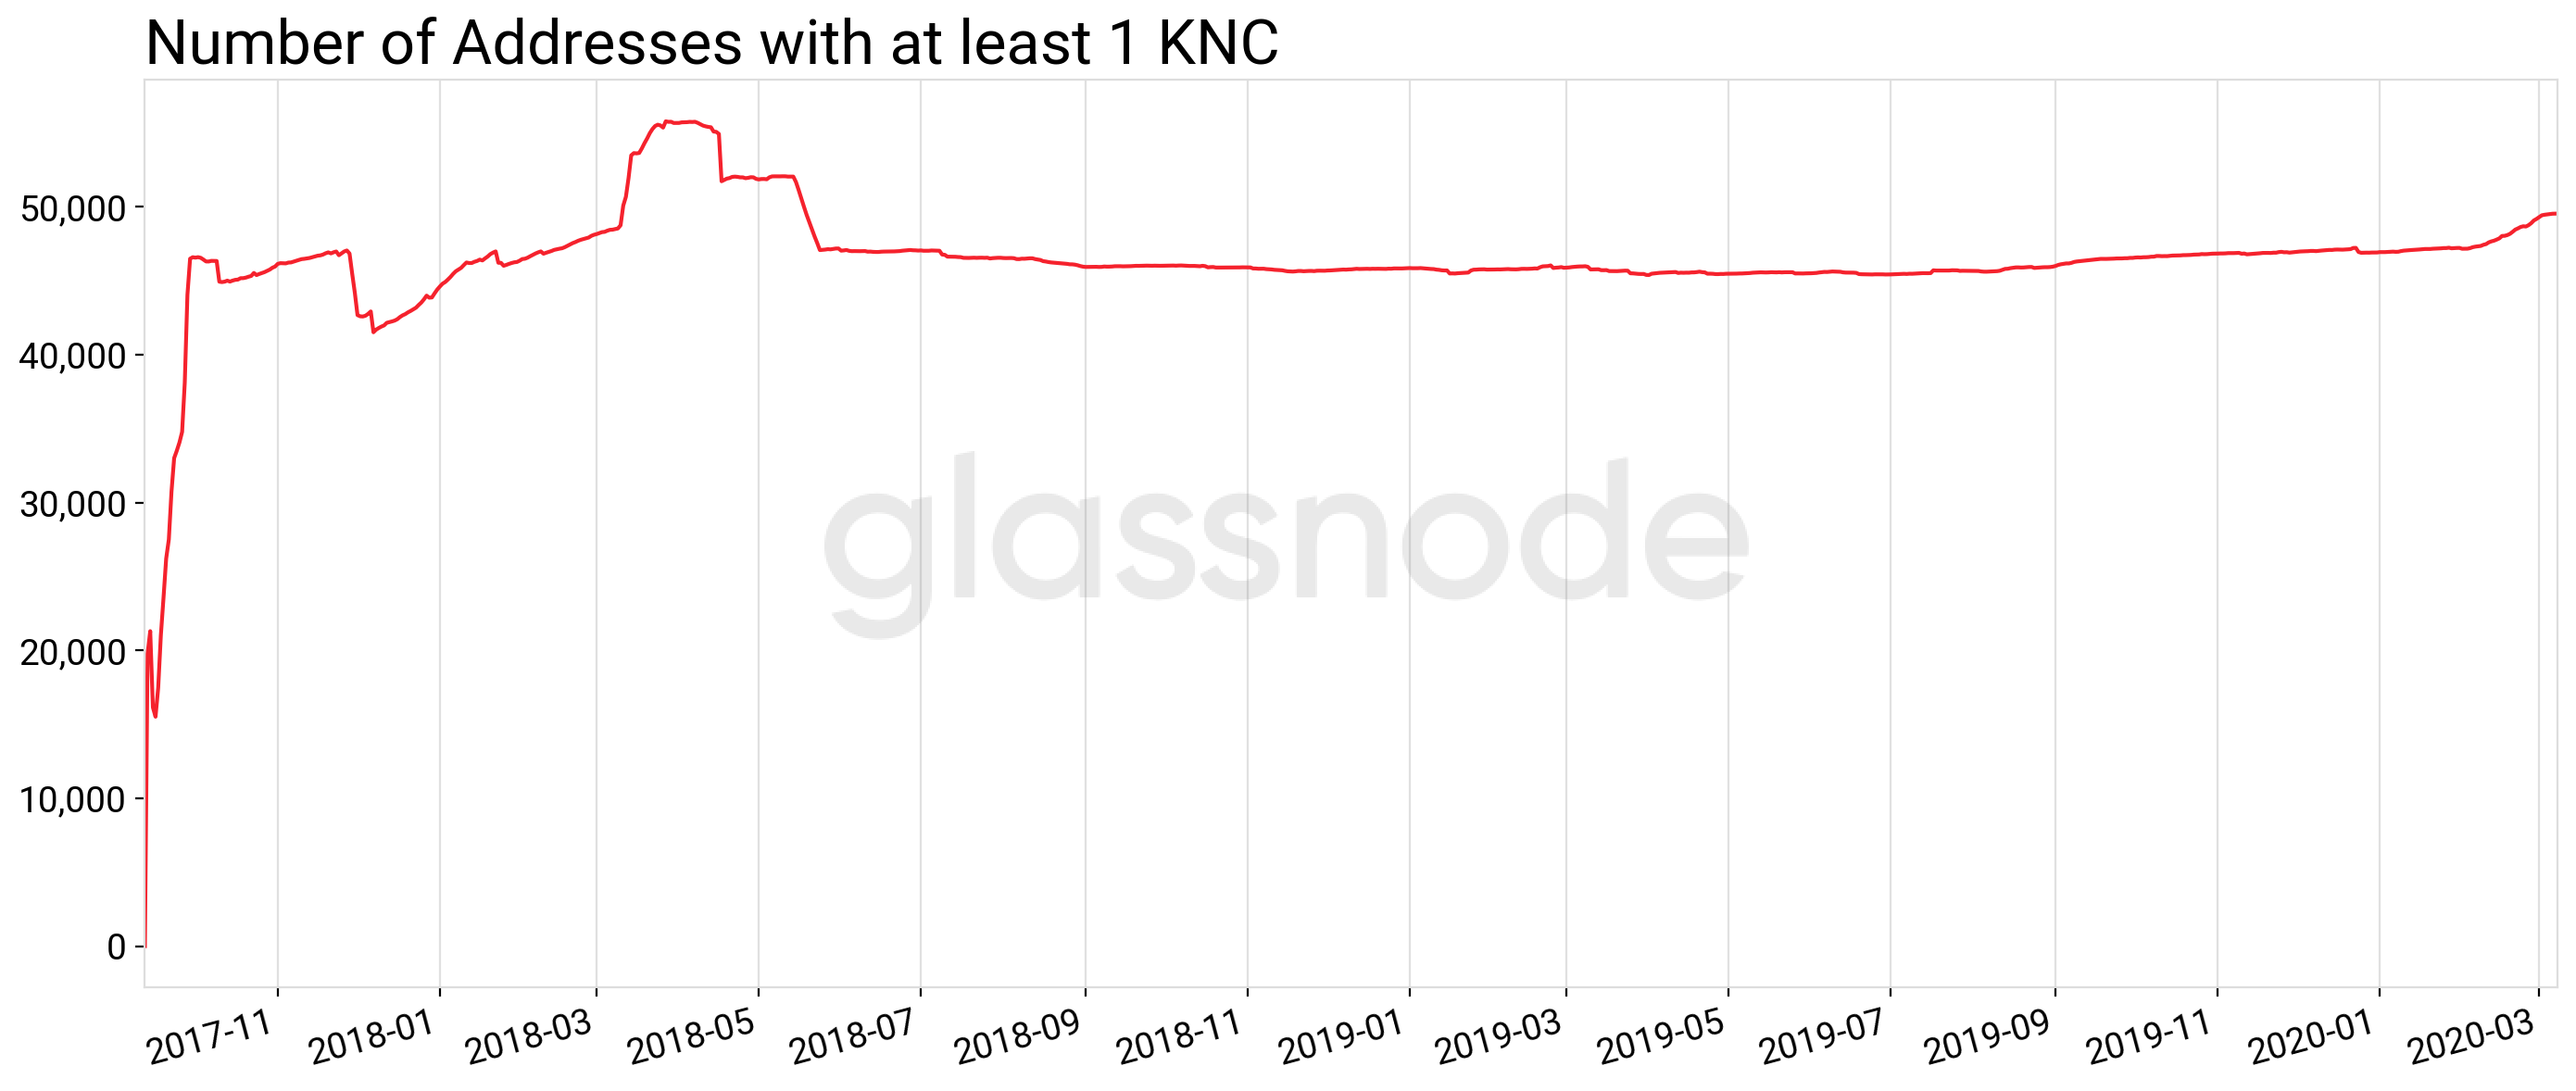
The growth of KNC holders was relatively stagnant for almost 2 years, until the trend broke in mid February 2020 and upwards growth gained significantly more momentum.
A number of events took place around this time that likely contributed to this growth: trading volume increased, KNC's price began to climb, Coinbase listed the token on their Pro and consumer platforms, and the Katalyst upgrade was given a Q2 release date. .
The following chart shows the evolution of different balance buckets over time:
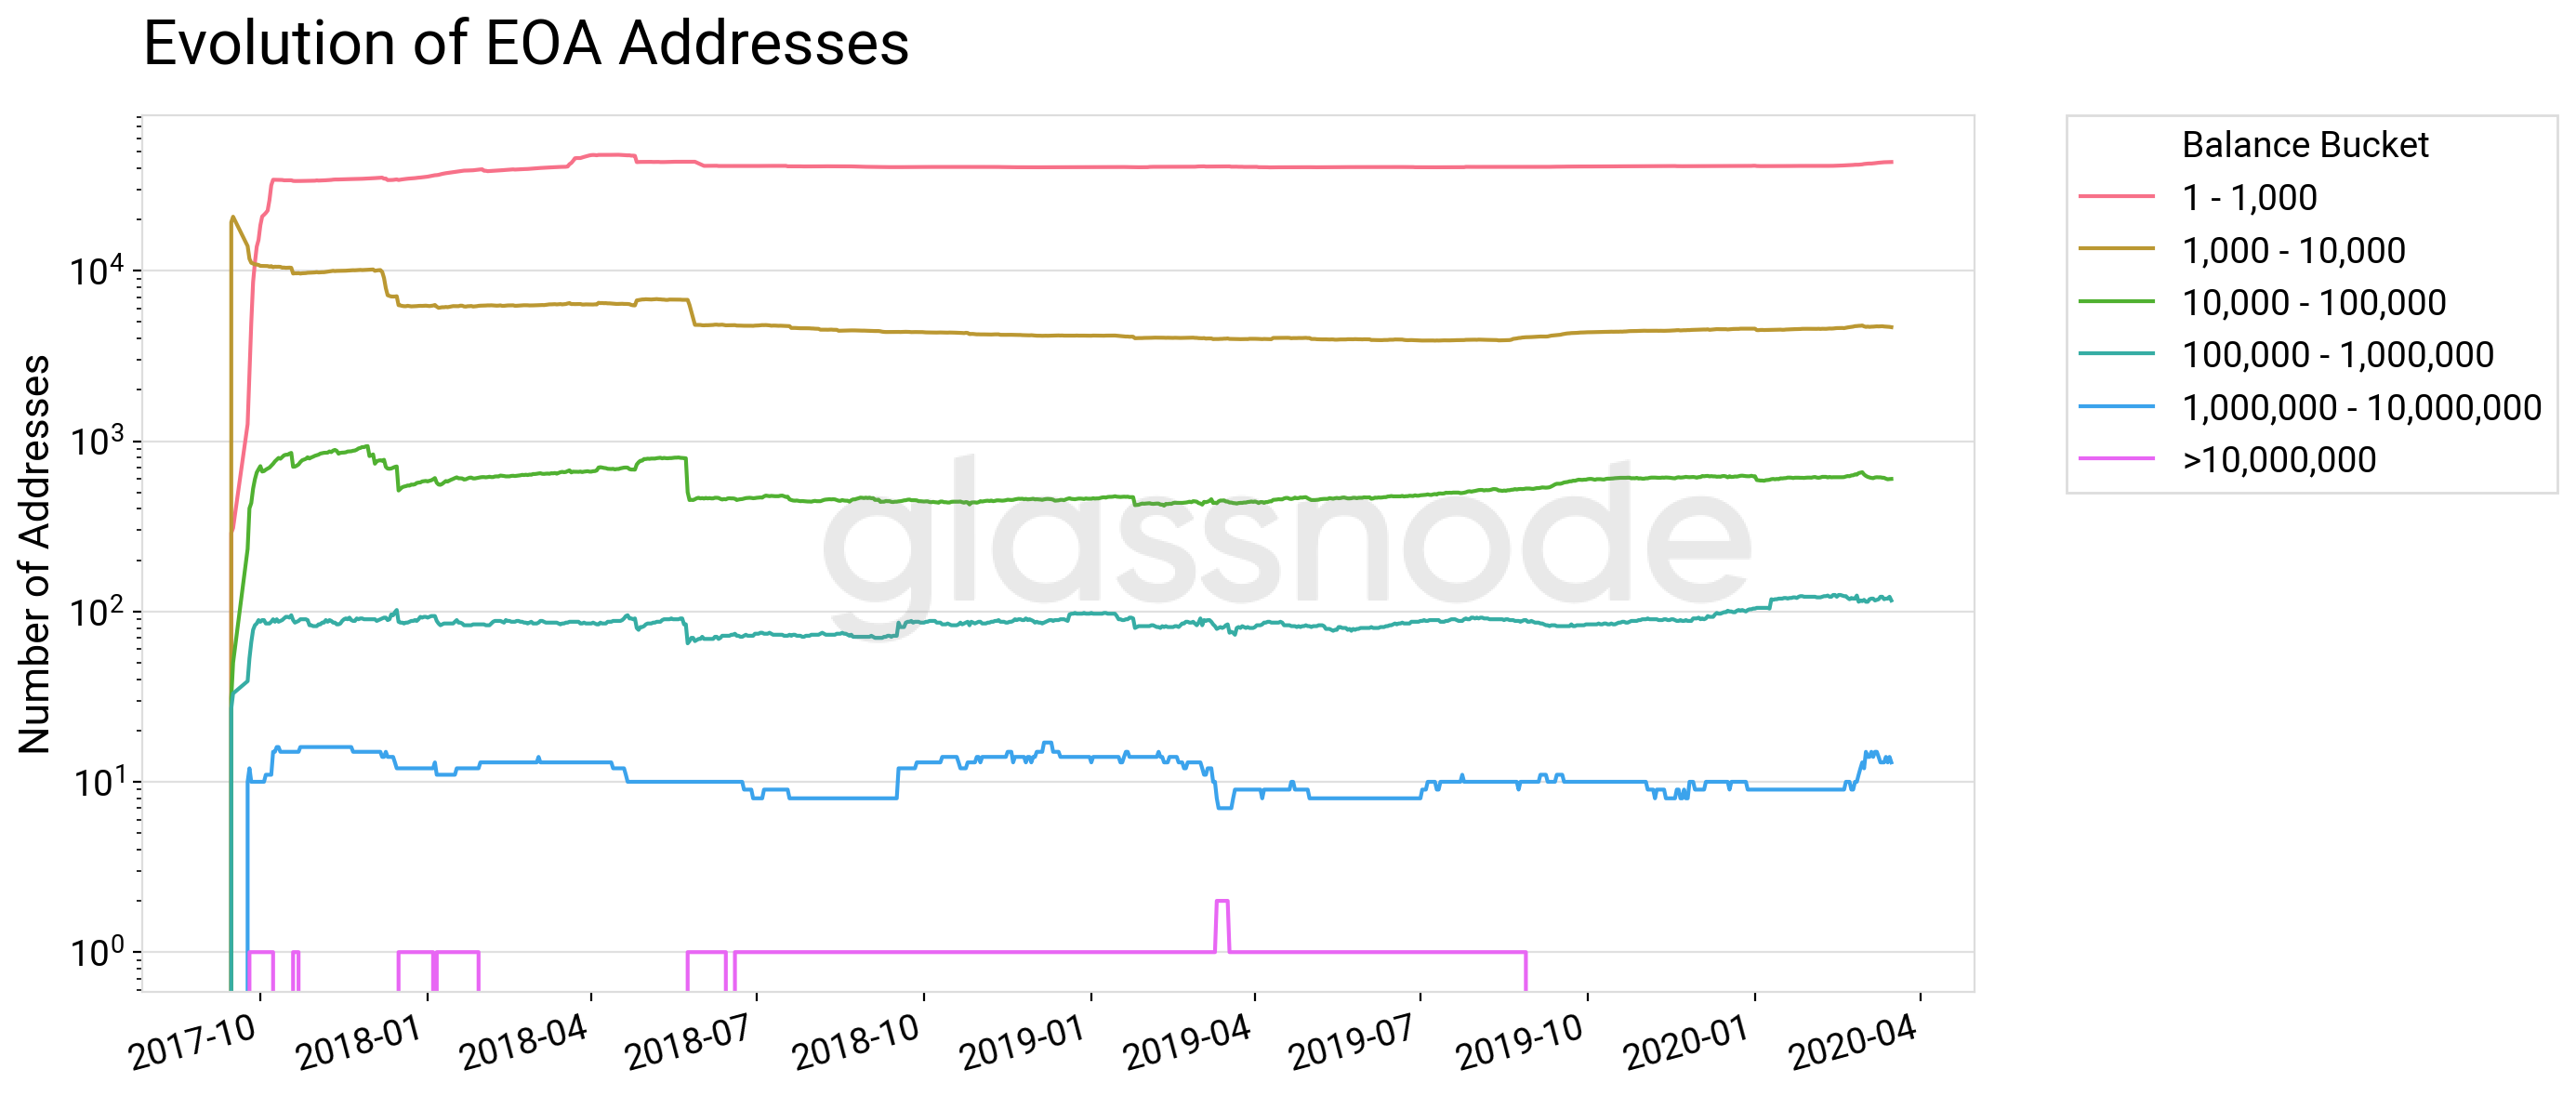
This clearly shows that the lowest bucket is responsible for the growth in the previous chart. 100,000 - 1,000,000 and 1,000,000 - 10,000,000 also grew considerably in 2020 - implying that a few new stakeholders may have taken large positions in KNC. As a reminder, these two buckets hold the majority of KNC's supply. Interestingly, they saw very little change during the crash on March 12th.
To view more KNC on–chain metrics, visit Glassnode Studio.
Special thanks to Tom Fiodorov.

- Follow us and reach out on Twitter
- For on–chain metrics and activity graphs, visit Glassnode Studio
- For automated alerts on core on–chain metrics and activity on exchanges, visit our Glassnode Alerts Twitter
Disclaimer: This report does not provide any investment advice. All data is provided for information purposes only. No investment decision shall be based on the information provided here and you are solely responsible for your own investment decisions.