The Ultimate Guide to Bitcoin Whales
In today's Bitcoin market, crypto whales with 1,000 to 5,000 BTC have a nuanced but significant role. Despite less individual influence due to more institutional players, their activities still affect market trends. This ultimate guide provides near real-time insights into whale actions.

Disclaimer: The analysis provided here offers a window into the world of Bitcoin whales. Please remember that this represents just one element in the multifaceted realm of cryptocurrency. While data from Glassnode can provide valuable insights, it's essential to approach this information holistically, as the beginning of your personal research journey.
Understanding the behaviours of Bitcoin and crypto whales is critical for investors, analysts, and traders. Leveraging on-chain analytics, it's possible to observe these entities in near real-time. Specifically, those holding between 1,000 and 5,000 BTC can provide insights into market dynamics through their accumulation and distribution activities.
However, as the Bitcoin market matures and sees increased institutional participation, the influence of individual whales has diminished. While their actions were once considered market movers, they now exist as part of a broader ecosystem that is less susceptible to single-player impacts. This ultimate guide will explore how the activities of Bitcoin whales relate to current market trends, given this evolving landscape.
Influence of Bitcoin Whales on Evolving Market Trends
Bitcoin whales have long been pivotal in shaping market directions. However, a comparison between market behaviors in 2017/2018 and 2020/2021 reveals a noticeable shift.
During the bull run of 2017, there was a net decrease in Bitcoin held by whales, as confirmed by the Number of Entities With Balance ≥ 1k metric below. This downward trend was possibly fueled by new market entrants, intense price fluctuations, and the then-maturing market landscape that presented ample opportunities for whale distribution. Utilizing this metric, which counts unique entities possessing at least 1,000 BTC, offers nuanced insights into market power dynamics. Here, "entities" are defined by clusters of addresses managed by a singular network participant, as determined by Glassnode's advanced heuristics and clustering algorithms.
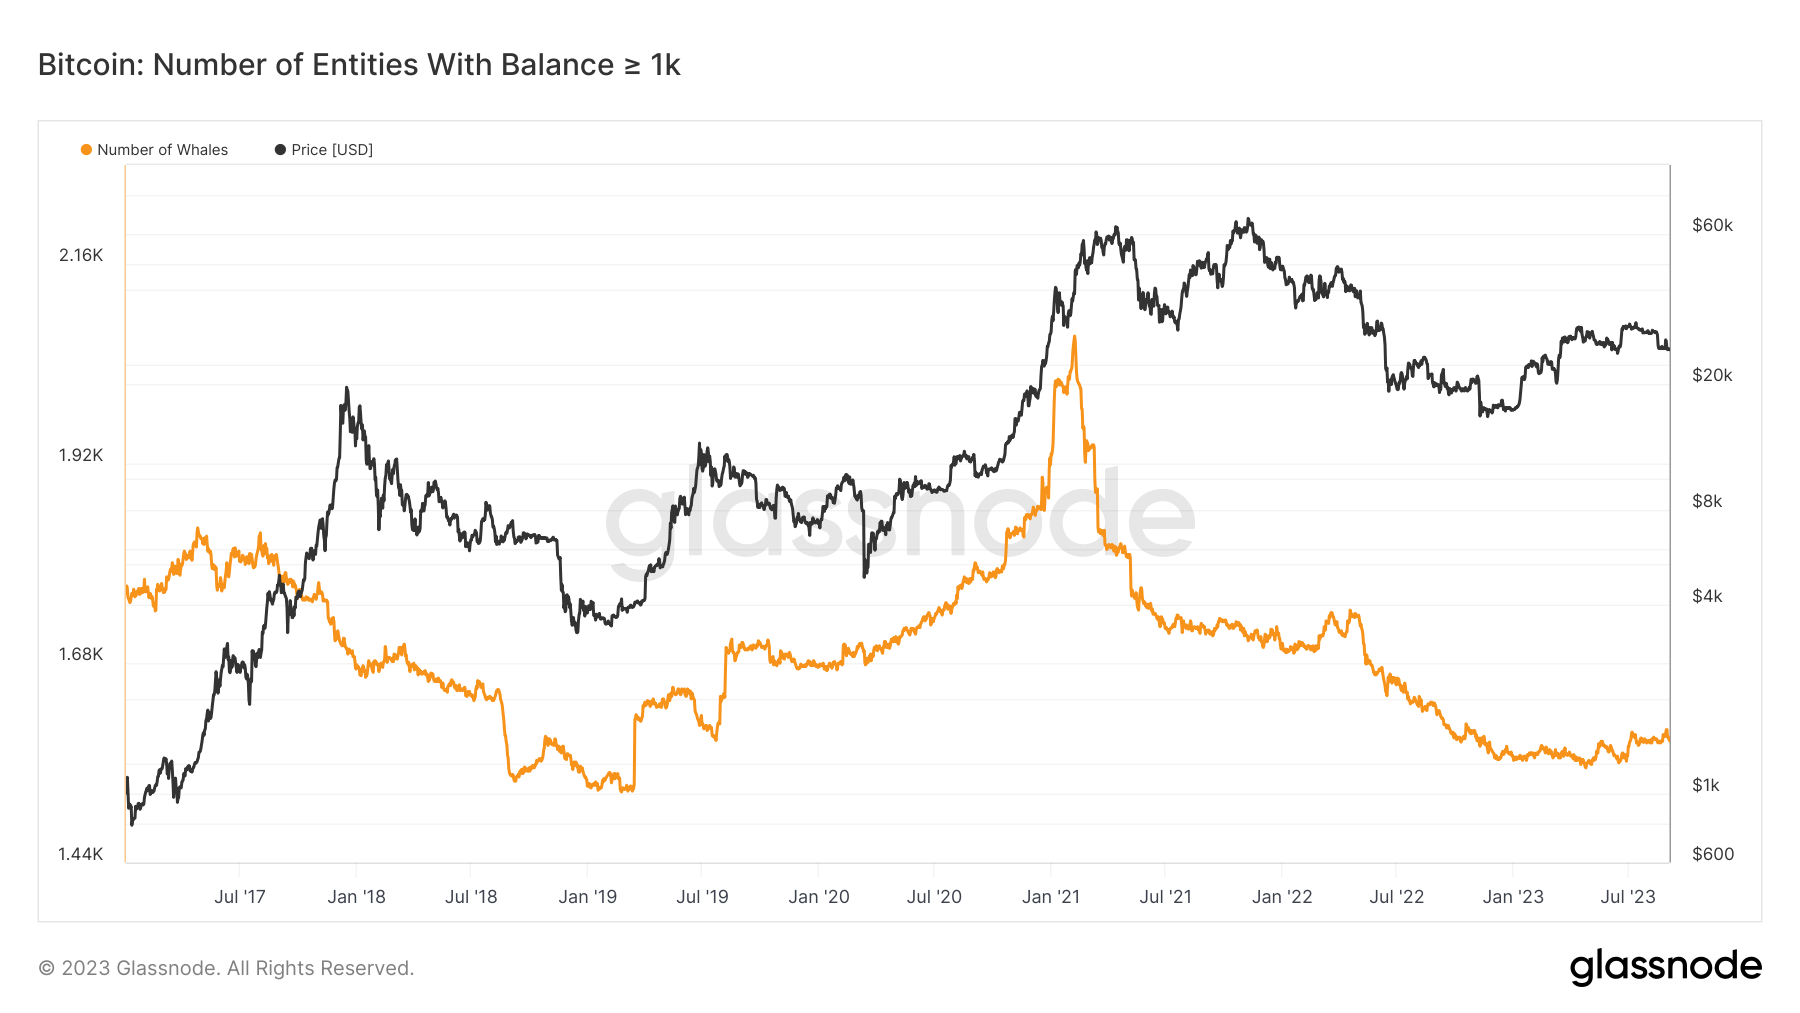
Fast-forward to the 2020/2021 period, the Bitcoin market landscape underwent a transformation, marked by the entrance of institutional investors. This shift diminished the market influence of Bitcoin whales, signifying a matured Bitcoin ecosystem characterized by higher liquidity, price stability, and varied market participation.
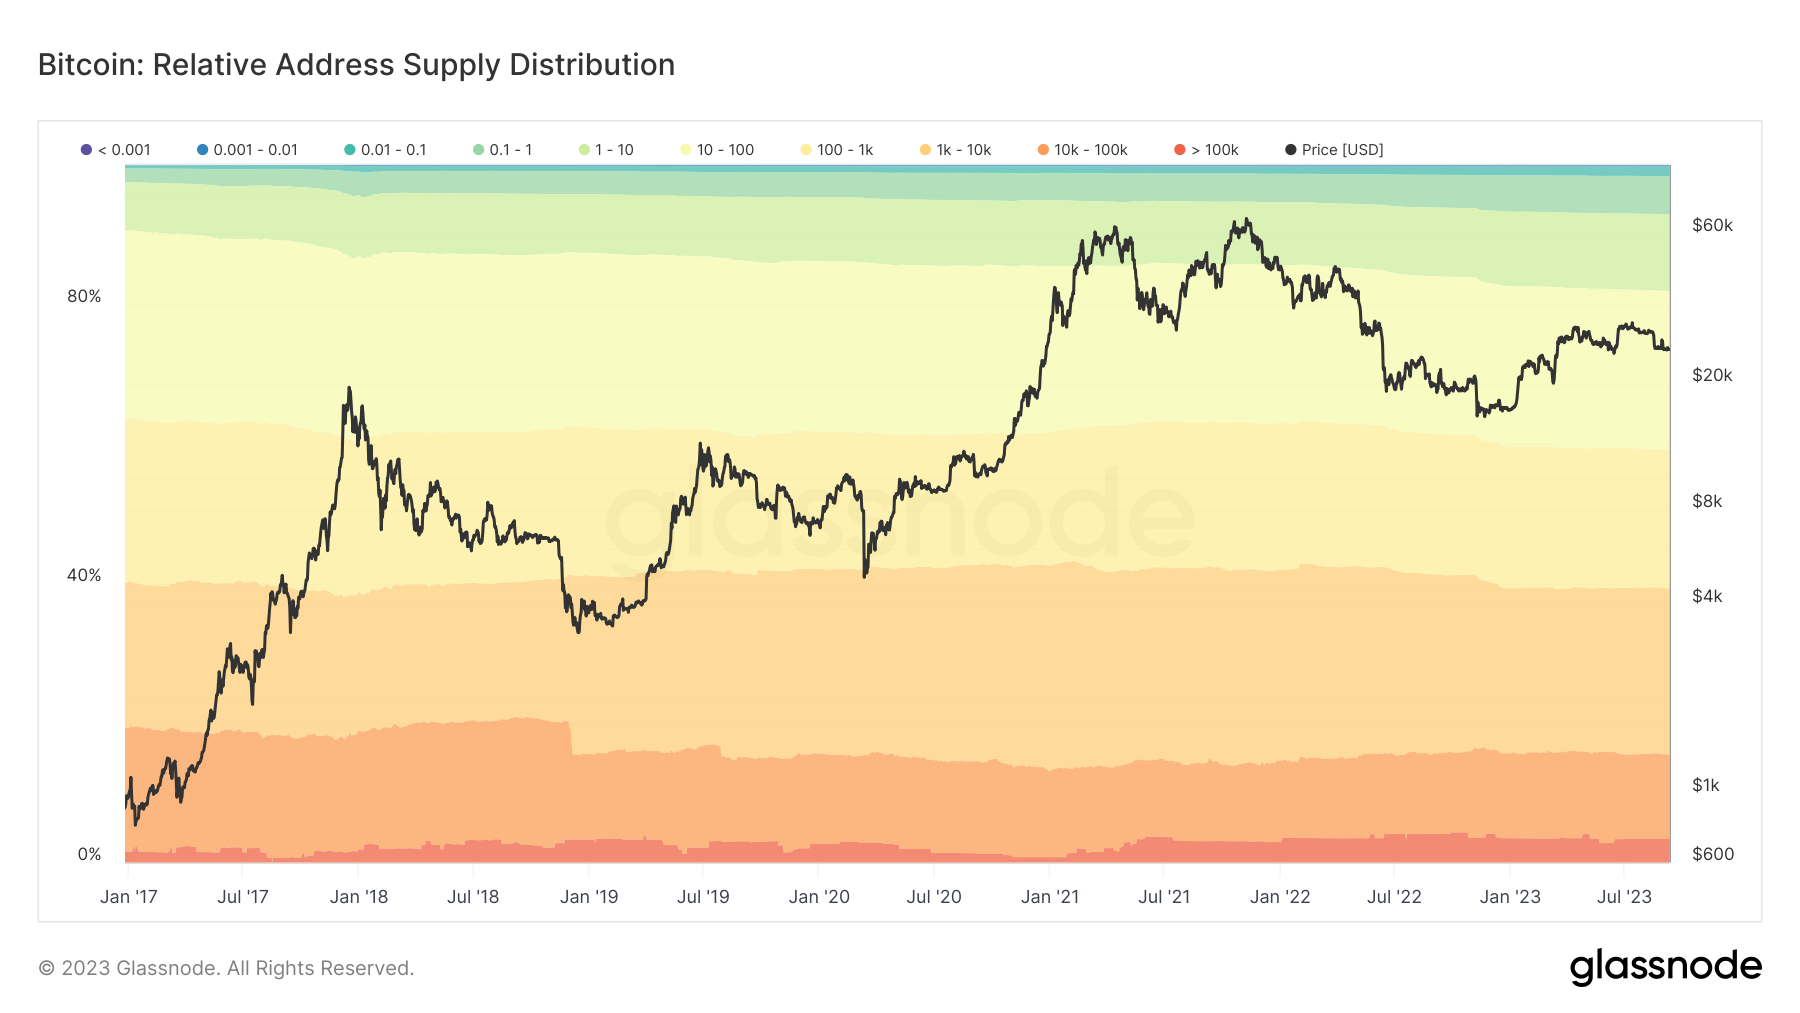
In this evolved market, we have highlighted that the total balance held by Whale entities has been decreasing over Bitcoin's history, consistent with the Relative Address Supply Distribution metric below. This metric provides a breakdown of the circulating supply of Bitcoin held by addresses within specific balance ranges.
Historical peaks offer a clear view of this declining trend:
- At the 2011 peak, Whales held around 76% of the total supply.
- By the 2013 peak, this had dropped to approximately 62%.
- In the 2017 peak, the percentage had further decreased to around 52%.
- Interestingly, during the 2021 peak, Whales held approximately 53%, showing a slight uptick.
- As of September 2023, Whales account for circa 39% of the total supply.
This data, represented in the accompanying chart, indicates a steady dilution of Whale-held Bitcoin as a percentage of total supply. It's important to clarify that the term 'Whale entities' includes not just individual large holders but also exchanges, large centralized assets like ETFs, GBTC, WBTC, and corporate holdings such as Microstrategy.
This diversification in market actors has likely translated into several benefits for the Bitcoin ecosystem, including:
- Greater market stability and resilience.
- Reduced susceptibility to price manipulation.
- Lower levels of price volatility.
- Advancements in financial infrastructure, such as regulated futures and options markets for Bitcoin, facilitating more effective risk management for investors.
By leveraging metrics like Number of Entities With Balance ≥ 1k and Supply Per Whale, one can obtain critical insights into the shifting influences on Bitcoin’s market.
The Importance of Keeping an Eye on Bitcoin Whales
Defined as entities holding large amounts of a specific cryptocurrency, crypto whales can significantly influence market trends through their transaction volumes. This influence is subject to factors such as market cap, trading volume, market depth, and liquidity for a specific cryptocurrency, as well as its distribution between holders. Although the influence of Bitcoin whales on market dynamics has diminished, tracking their activities can offer practical insights, particularly in areas like risk mitigation, as we outline below.
We will examine further detail on the role and characteristics of crypto whales later in the article.
Mitigating Risk
- While not an absolute measure of risk, the activity of Bitcoin whales can offer early signs of market shifts.
- Charts like Whale-to-Exchange Transfer Volume and Exchange-to-Whale Transfer Volume can be particularly revealing. Additionally, Glassnode's Exchange Risk Guide offers an in-depth look into managing risks associated with crypto exchanges, including a case study on the FTX downturn.
Analyzing Volatility
- Large transactions made by whales can serve as indicators for upcoming market volatility. Familiarity with historical trends can enable investors to capitalize on these movements.
- The same charts used for risk mitigation can also be valuable in this context.
Enhancing Predictive Models
- Incorporating data from whales, especially using Glassnode's point-in-time metrics, can fine-tune forecasting models. However, this data must be interpreted cautiously.
- Notable charts for this purpose include point-in-time versions for Whale-to-Exchange Transfer Volume and Exchange-to-Whale Transfer Volume, as well as Transfers from Exchanges to Whales.
Assessing Market Liquidity
- The actions of Bitcoin whales can give clues about the market's liquidity, although a more detailed study is needed for accurate evaluations.
- For this, the Absorption Rate Workbench can be a useful tool.
By monitoring these aspects of whale activity, market participants can make informed decisions in a complex and mature Bitcoin market
What Bitcoin Whales Are Doing Now
Current Distribution and Market Behavior
As of mid-2023, addresses controlled by Bitcoin whales have seen a slight decrease in their share of the circulating Bitcoin supply, moving from 41.3% at the start of the year to 40.4%. This decrease in share is indicative of a trend toward a more diversified ownership, which contributes to market stability.
Whale Deposit/Withdrawal Volume Ratio
An important metric for understanding the behavior of Bitcoin whales is the Whale Deposit/Withdrawal Volume Ratio. This metric below measures the volume of Bitcoin deposits and withdrawals from whale addresses to exchanges. Since January 2023, the volume of deposits to exchanges from these addresses has increased by approximately 100.61% (from 5,697.31 BTC to 11,425.87 BTC). In contrast, the volume of withdrawals saw a more modest increase of 16.5% (from 5,469.51 BTC to 6,371.45 BTC).
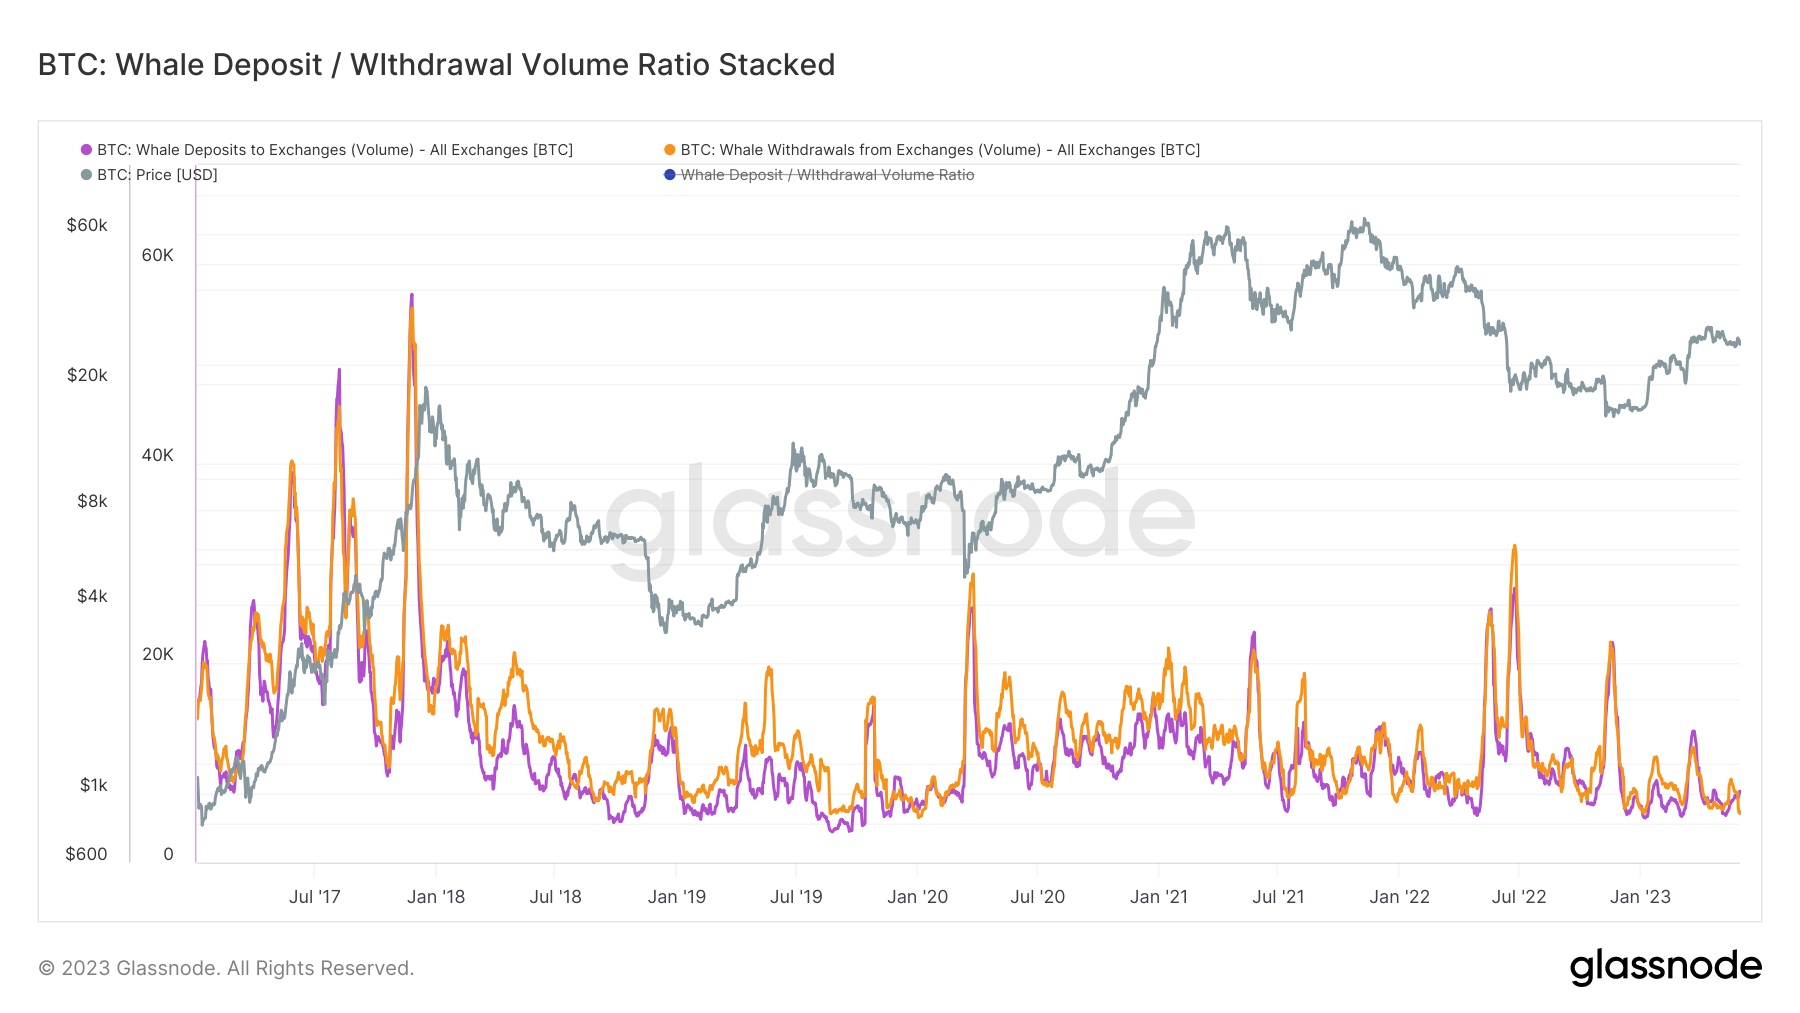
Implications of Deposit-Withdrawal Disparity
The notable difference between deposit and withdrawal rates—100.61% versus 16.5%—suggests a more aggressive accumulation strategy by Bitcoin whales. They appear to be preparing for a significant market event, although it's crucial to note they are not exiting the market at the same pace.
Potential Reasons for Current Accumulation Behavior
Given the observed activities, there are several possible scenarios to consider:
- Anticipated Market Rally: Whales could be accumulating Bitcoin in anticipation of a price surge.
- Strategic Diversification: Whales might be diversifying their holdings across multiple accounts to mitigate risks.
- Market Manipulation: While less likely given current regulations, whales could potentially be preparing for price manipulation strategies.
- Macro-Economic Factors: Geopolitical or economic conditions could be prompting whales to hold more Bitcoin as a hedge against traditional financial systems.
It's essential to understand these are speculative reasons and should not be considered definitive explanations for the observed behavior.
Decoding Bitcoin Whale Behavior: Metrics and Methodologies
Glassnode offers an array of specialized metrics for those interested in the activities and impact of Bitcoin whale addresses. Below are some key tools and metrics:
Whale Reshuffling
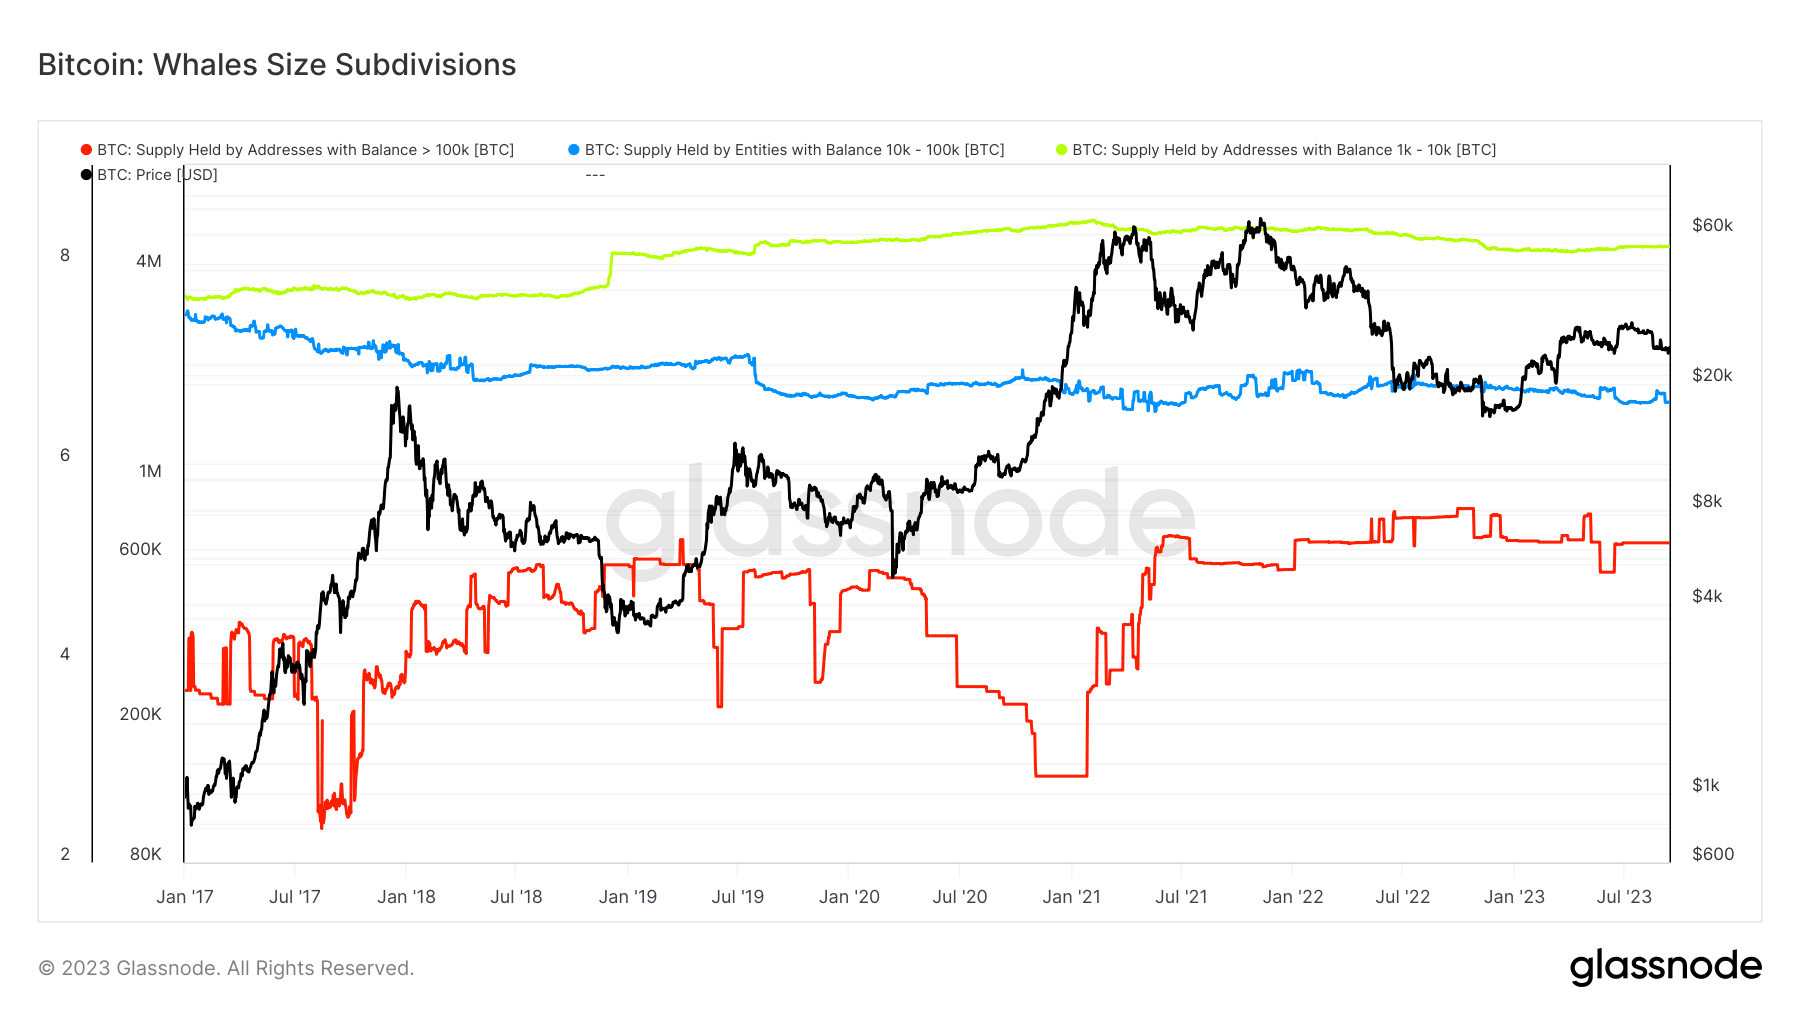
The Whales Size Subdivisions metric below tracks shifts in Bitcoin balances among different whale sub-groups over short periods, such as the last 30 days. In 2023, whales with 1k-10k BTC are accumulating more, while those with more than 10k BTC are distributing. This metric helps to understand internal dynamics among whale entities. A positive balance change in the 1k-10k BTC group suggests accumulation, while a negative change indicates distribution or a pause in accumulation.
Metrics on Supply Ownership
The term 'Supply-Held' essentially refers to the Bitcoin holdings controlled by various kinds of entities. This comprehensive dashboard enables a macro-level examination of Bitcoin ownership by whale entities across different market cycles.
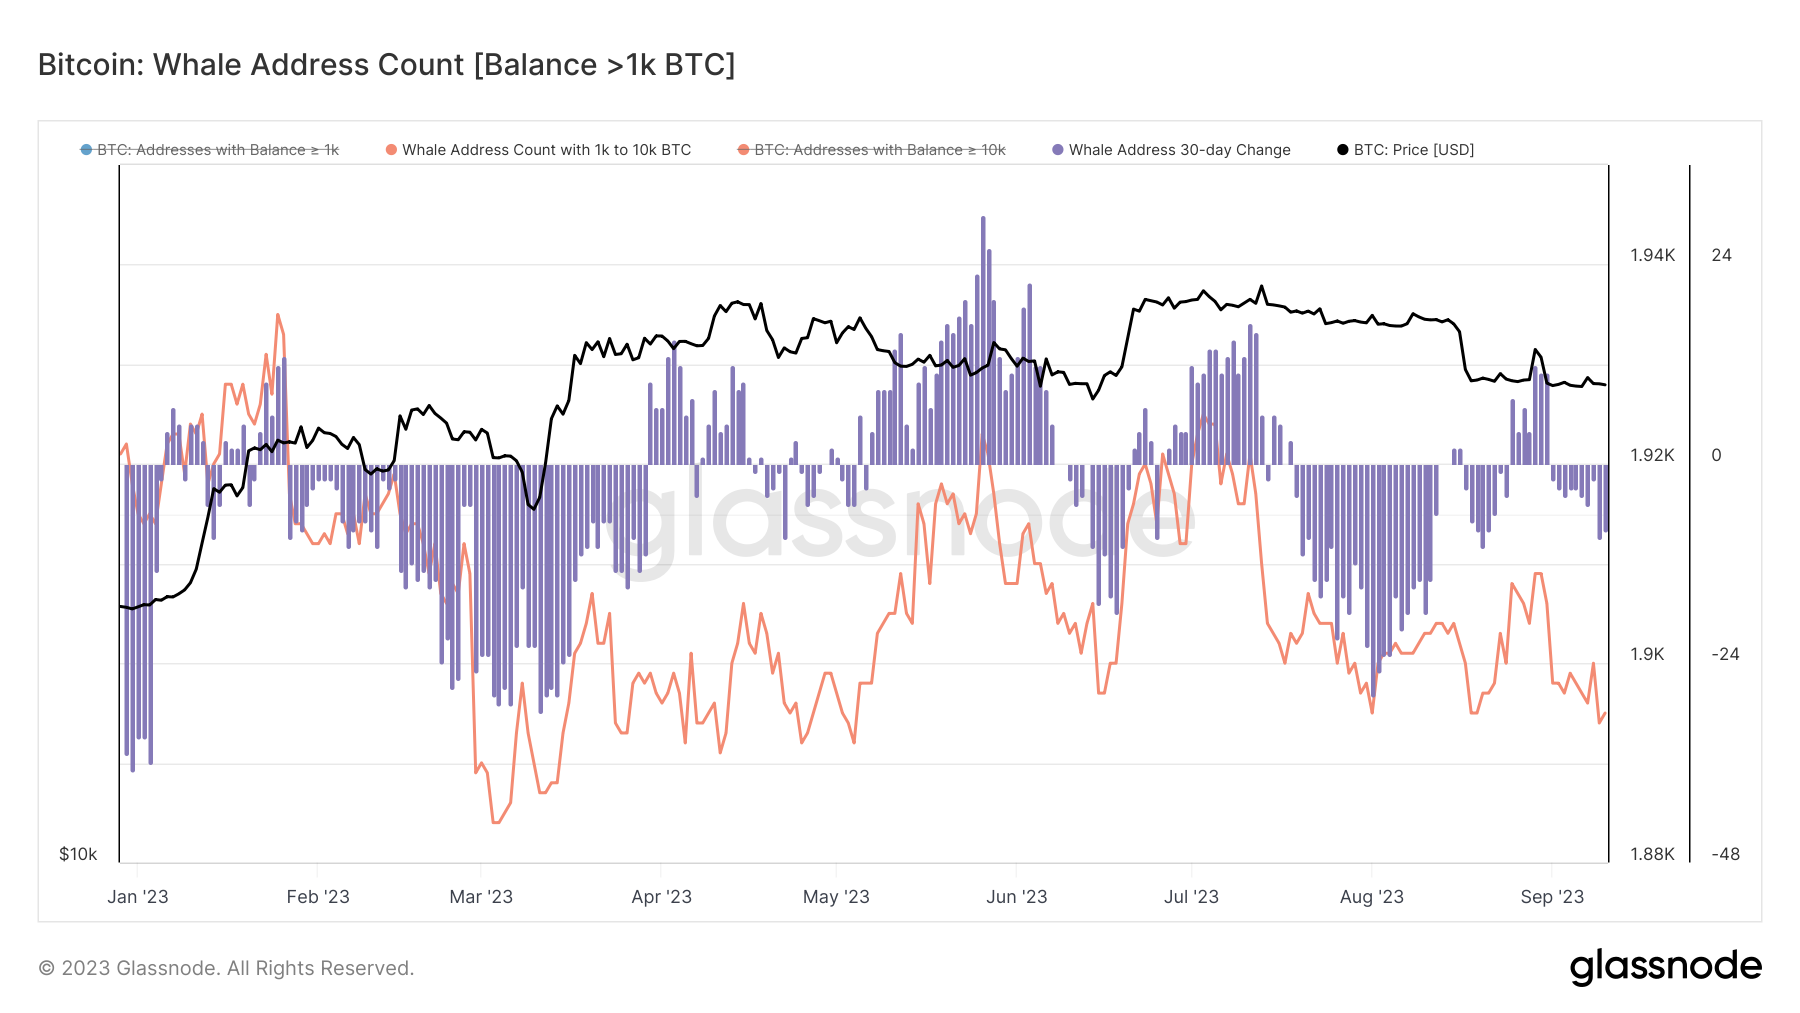
The Whale Address Count dashboard is another informative tool. Its graphical display shows both the current count of whale addresses holding more than 1,000 BTC and their 30-day variations. This visualization provides valuable insights into whale activity, including periods of accumulation or distribution. Notably, data indicates a notable decline in collective whale balances since May.
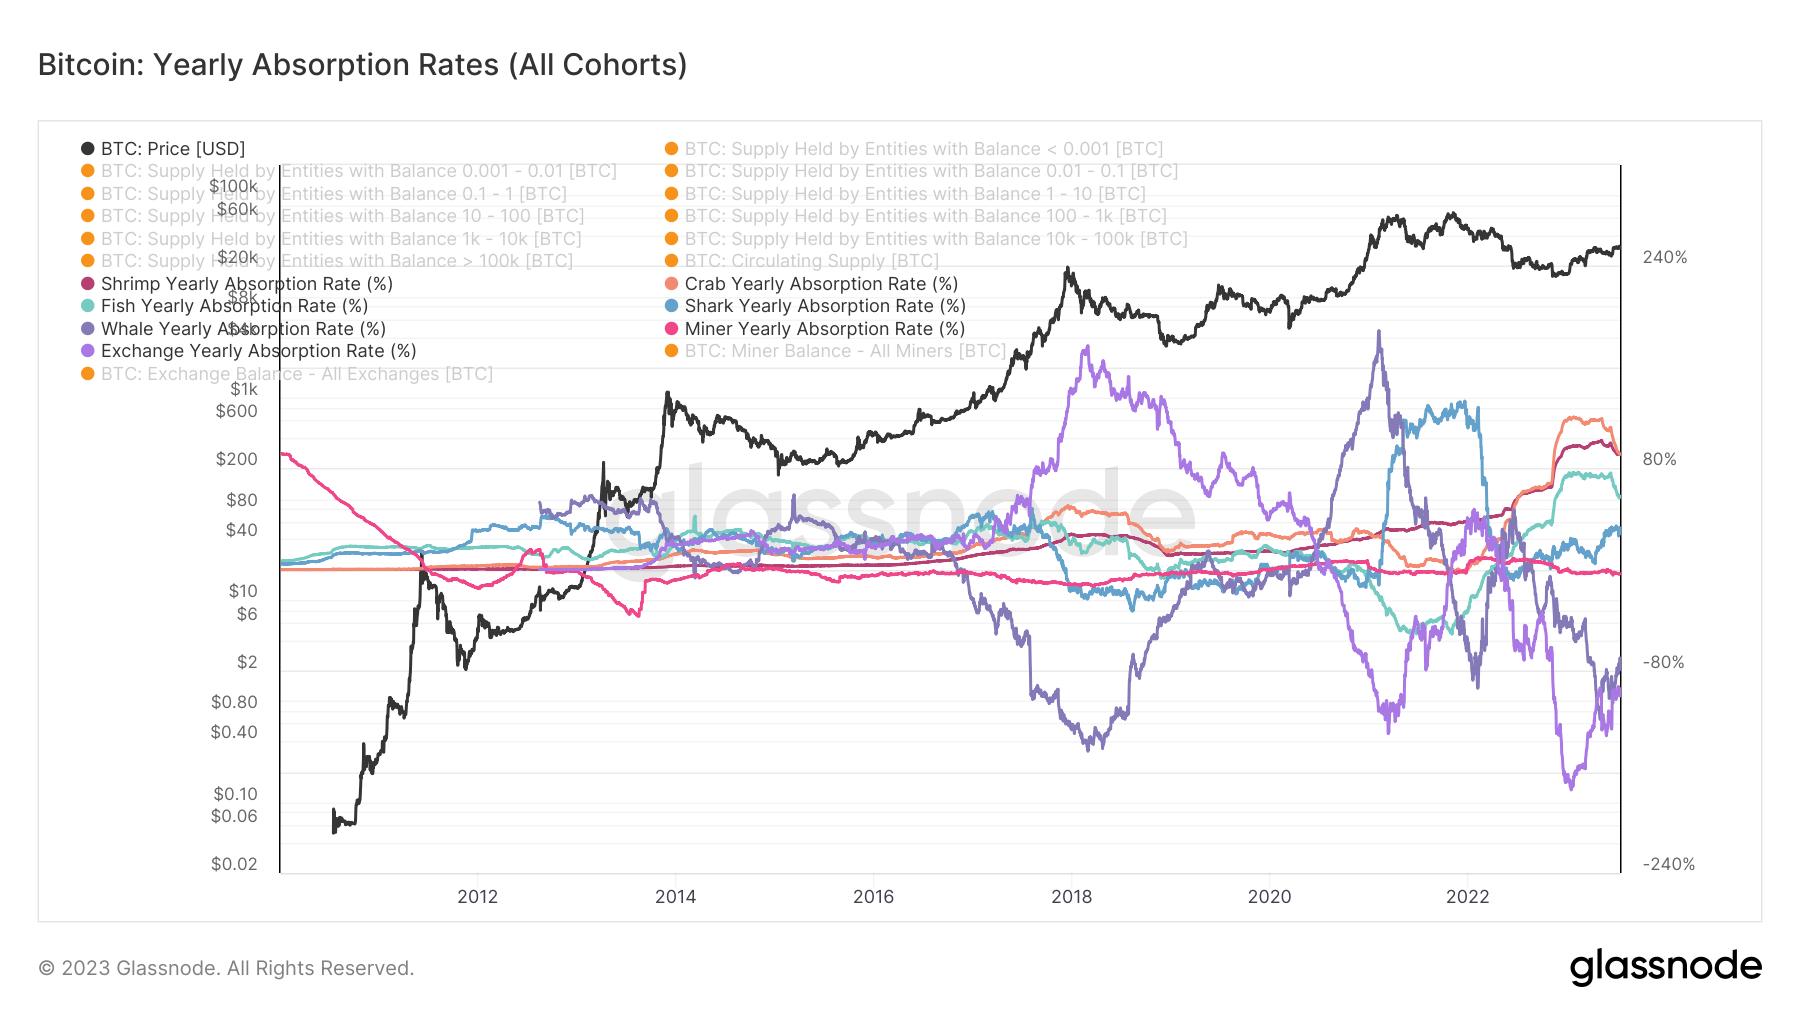
Annual Holding Variability
The Yearly Absorption Rate offers insights into the yearly percentage changes in holdings by these large-scale Bitcoin accounts. During the 2020-2021 bull market, for example, the rate recorded a significant 14% increase in Bitcoin holdings among these accounts for the first time since 2016. This suggests a substantial introduction of institutional and corporate investments into Bitcoin. However, data from 2023 shows that there has been a noticeable 67% drop in the yearly absorption rate among Bitcoin whales.
Understanding the Role of Crypto Whales in Market Dynamics
Shifting our attention from Bitcoin whales, we now turn to the broader category of crypto whales to explore their differences. As mentioned earlier, crypto whales are defined by their ability to influence market trends through substantial transaction volumes. Factors such as market cap, trading volume, and liquidity play significant roles in determining this influence. While Bitcoin whales are a specific subcategory, they also exhibit unique characteristics that distinguish them from general crypto whales. Observing their activities, commonly known as 'crypto whale tracking,' allows for better anticipation of market fluctuations
The key difference between crypto whales and Bitcoin whales lies in their impact and the markets they influence. Crypto whale activity primarily affects altcoins, especially those with smaller market caps, where even a single large transaction can lead to substantial price changes. Therefore, investors in altcoins often rely on tracking such whales to anticipate potential price movements.
On the other hand, Bitcoin whales contribute to an aggregated view of the Bitcoin market, rather than causing immediate price swings. As the Bitcoin market has matured and seen increased institutional investment, the sway of individual whales has lessened. Instead, understanding their collective behavior becomes more important for predicting broader market trends. For instance, recent contrasting behaviors among Bitcoin whales with holdings between 1k and 10k BTC indicated a likely accumulation phase, typically a sign of an impending price rise.
Understanding Accumulation and Distribution Through Crypto Whale Tracking
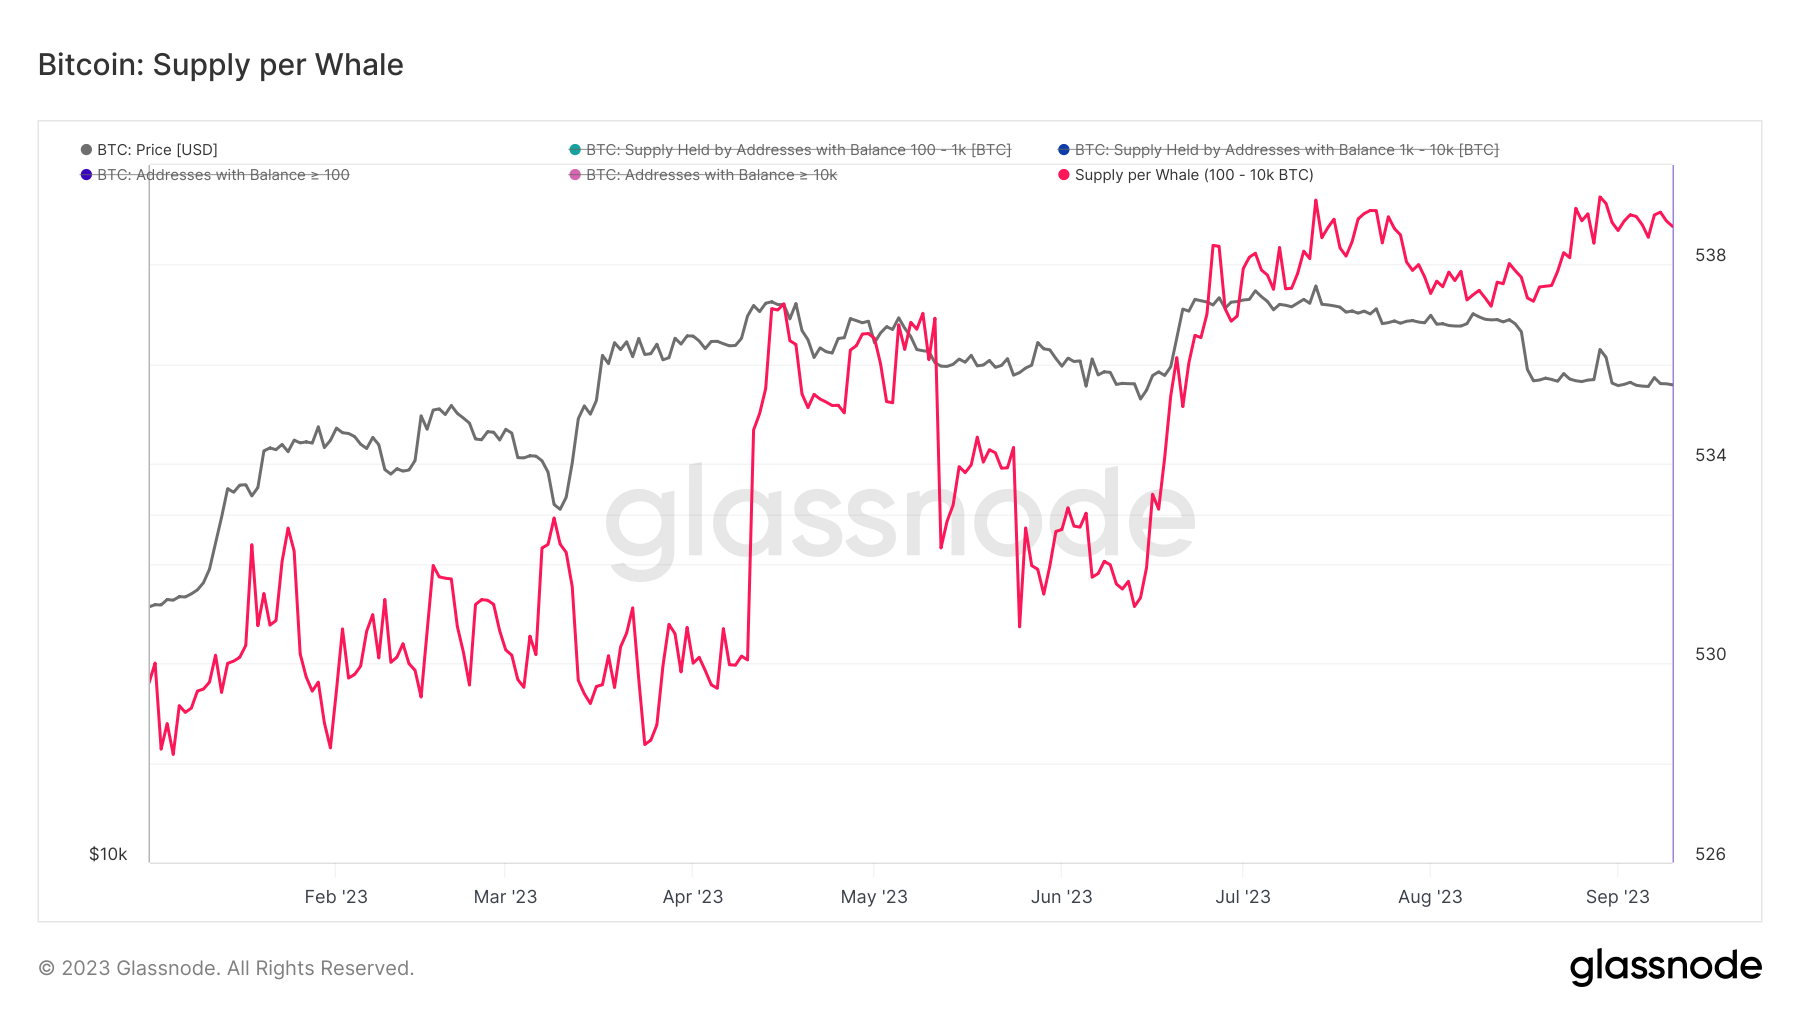
Accumulation is a phase where major cryptocurrency holders, commonly known as whales, are in the process of expanding their portfolios. One significant indicator for this is the Supply per Whale metric. This measure illustrates the average amount of Bitcoin held by addresses containing 100 to 10,000 BTC. By doing so, it also takes into account variations in wallet sizes, giving us an adjusted view that includes practices like UTXO consolidation and splitting.
For instance, in 2023, the aggregate holdings of Bitcoin whales have seen an uptick of 1.73%.
Additionally, distribution is the stage where whales are actively liquidating or 'dispersing' their holdings. Monitoring these acquisition and liquidation activities over time can yield invaluable clues about potential future price fluctuations in cryptocurrency markets.
Before we delve into a more comprehensive analysis, it's crucial to outline our methodology. Specifically, in the Bitcoin landscape, we categorize 'whales' as entities holding between 1,000 - 5,000 BTC. To analyze these large holders, we adopt a specialized approach for the following metric, focusing solely on coin movements into and out of exchanges related to these large entities.
Such an approach better isolates the buying and selling patterns of these substantial Bitcoin stakeholders. Over the years, fluctuations in these whale activities have consistently mirrored broader market dynamics, offering a contextual backdrop for our evaluation.
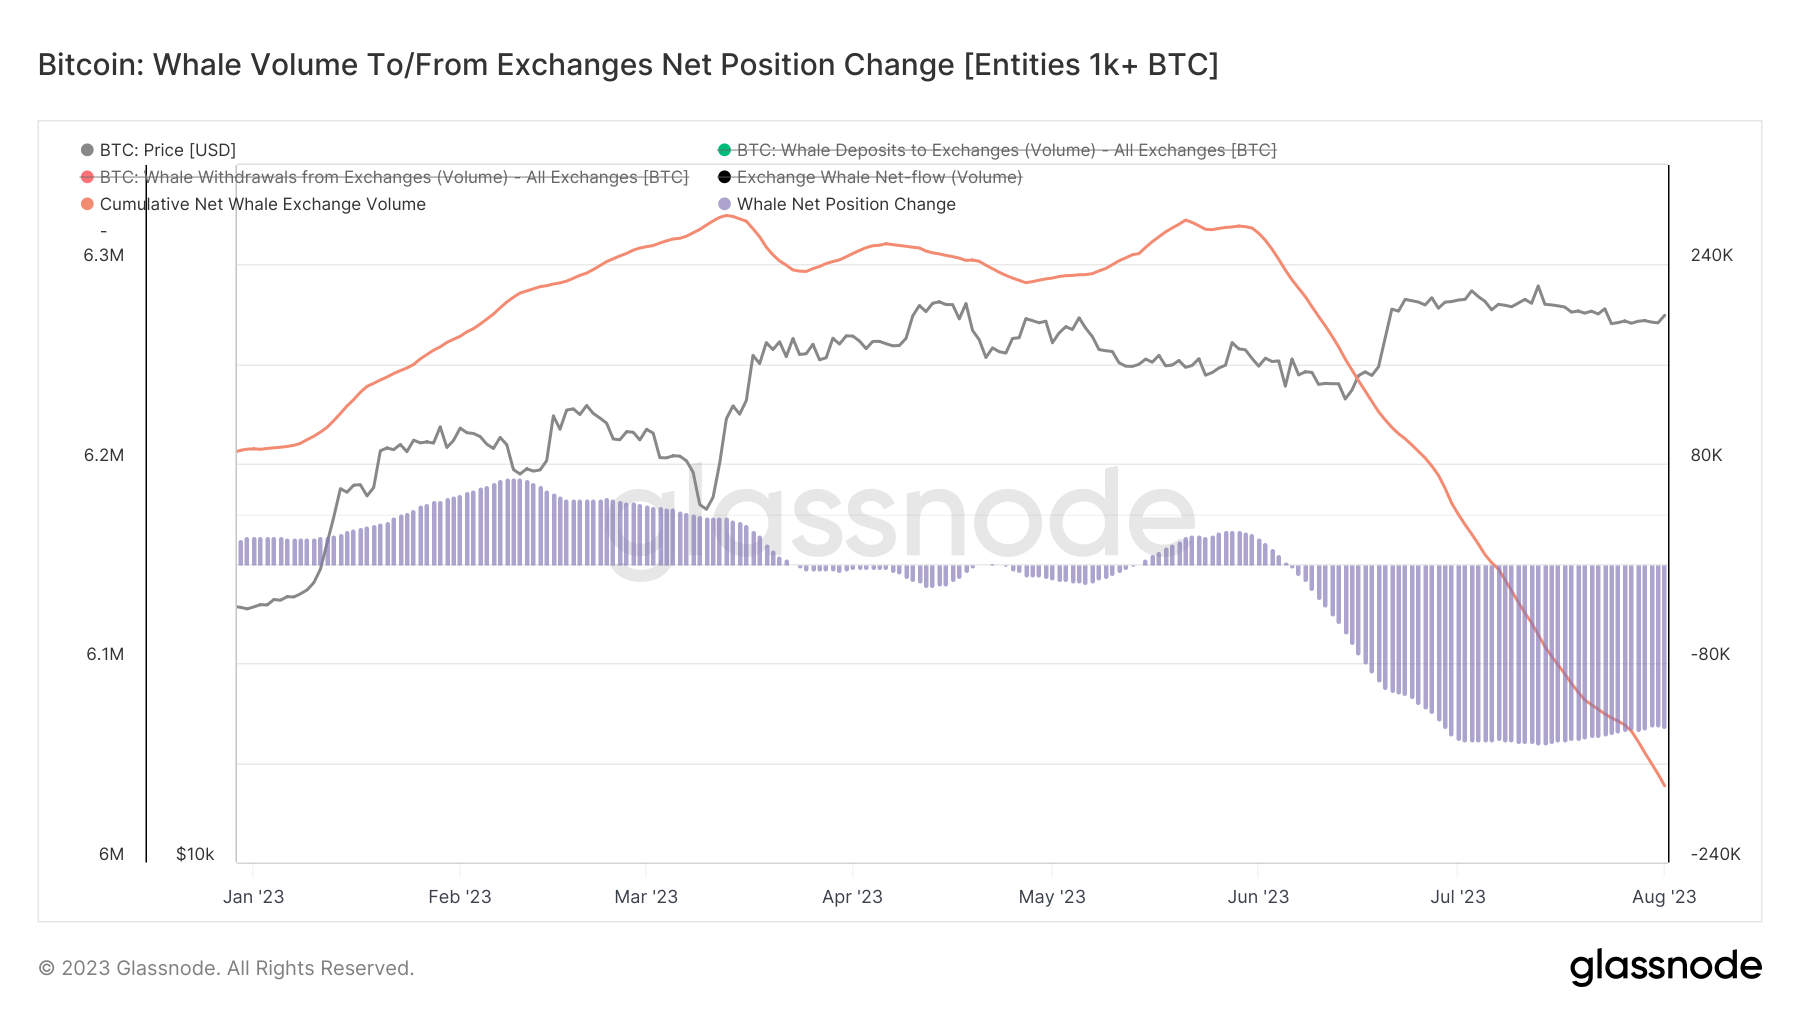
The accompanying graph highlights several important aspects:
- The orange line tracks the cumulative net balance held by the Whale Cohort, focused specifically on their exchange activities.
- The purple shaded area illustrates the 30-day net position change of the aggregate Whale Balance in relation to exchanges. This metric has seen a significant drop of around 114,617 BTC over the period.
By narrowing our analysis to transactions solely between whale entities and trading platforms, we purposely omit exchange data to focus on whale behavior. This methodology corroborates a decline of 411,093 BTC in the aggregate balance of whale holdings from May 30th to September 10th.
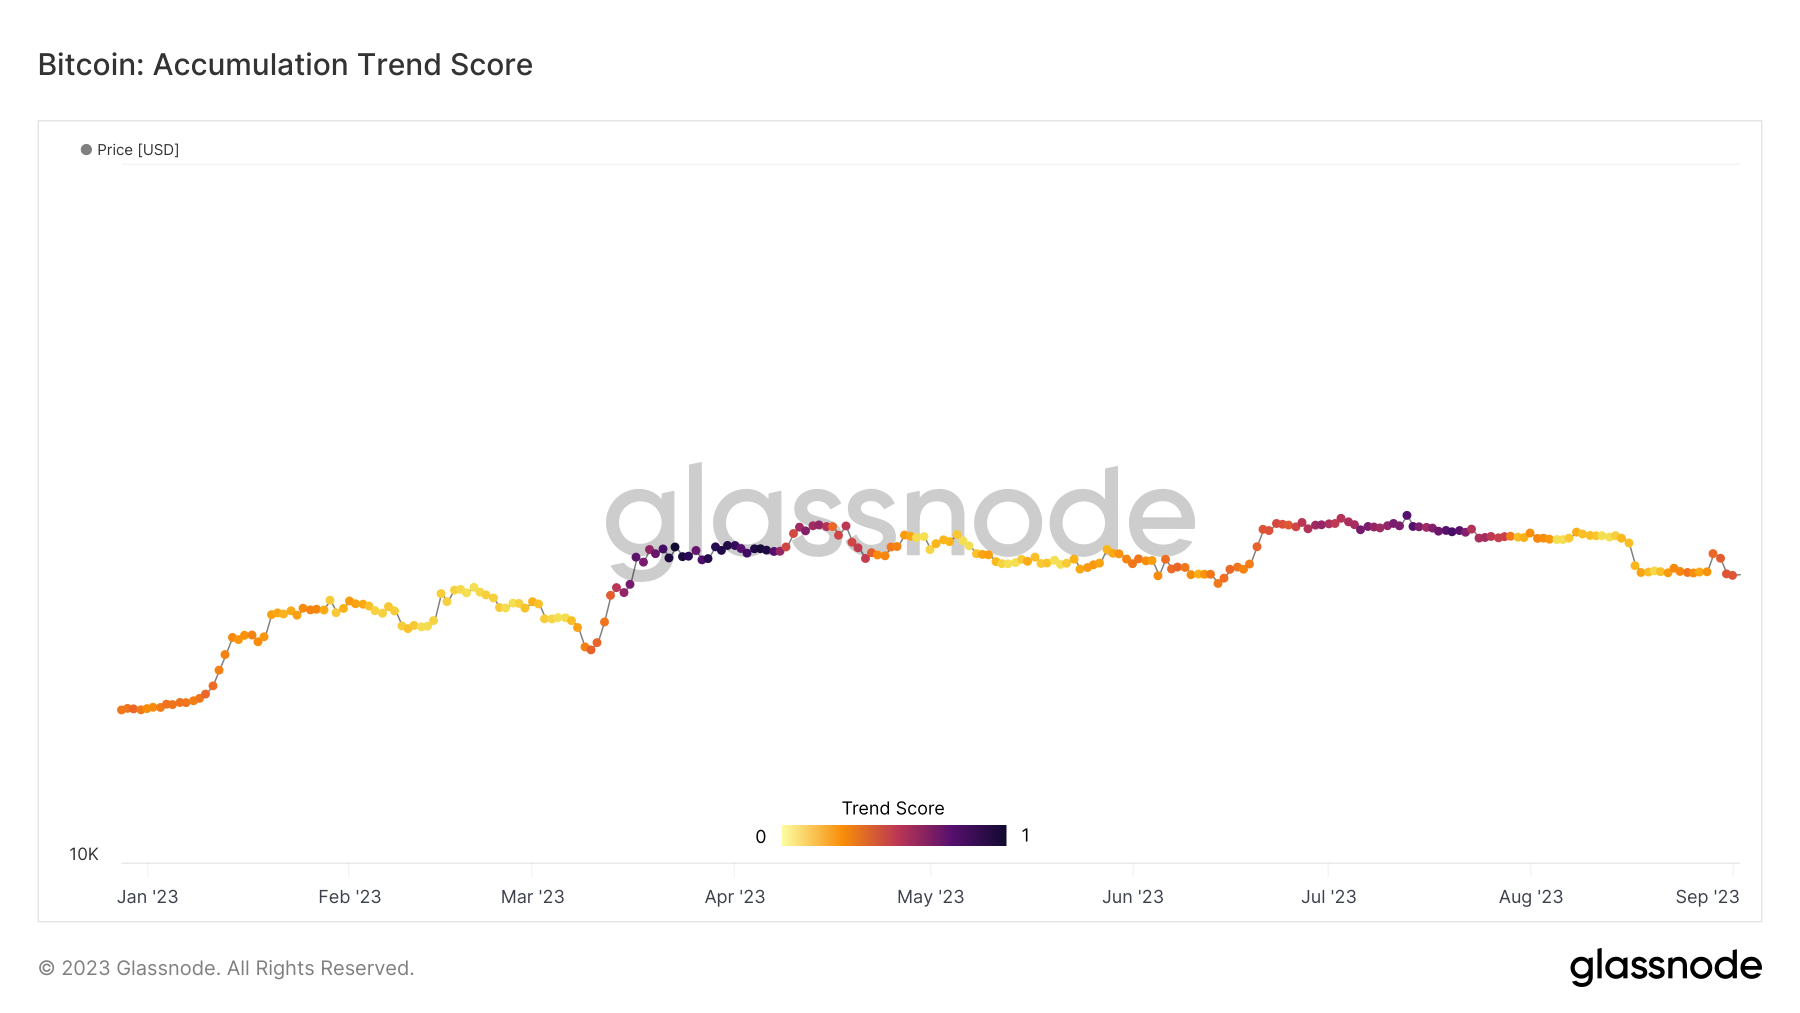
Increasing whale accumulation often signals a bullish market sentiment, hinting at an expected rise in cryptocurrency values. This notion is further backed by analytical tools such as The Bitcoin Accumulation Trend Score. A score nearing 1 indicates a strong accumulation phase among large entities like Bitcoin whales. In contrast, a score closer to 0 indicates either a distribution phase or a halt in accumulation activities. As of September 10, 2023, the Accumulation Trend Score stands at approximately 0.31, indicating a more neutral stance among larger entities, including Bitcoin whales, when it comes to accumulation or distribution activities.
Conclusion
In conclusion, monitoring the actions of Bitcoin whales, particularly those holding between 1,000 and 5,000 BTC, remains an invaluable practice for understanding market dynamics. Their accumulation and distribution activities offer a real-time barometer of market sentiment, thanks to sophisticated on-chain analytics. However, it's crucial to note that as the Bitcoin market has matured and institutional participation has grown, the sway these whales hold has proportionally lessened.
Once seen as the key drivers behind market fluctuations, these large entities are now part of a more complex, multi-faceted ecosystem. This diversified landscape is increasingly resistant to the influences of individual players, making the analysis of whale behavior just one among multiple factors to consider when evaluating market trends.
As we move forward, adapting our analytical frameworks to include both traditional whale activity and emerging influences will be crucial for obtaining a holistic view of market trends and dynamics.
Disclaimer: Past performance is not indicative of future results. This article is intended for informational purposes only, and it does not constitute investment advice. Always conduct thorough research.